저작자표시-비영리-변경금지 2.0 대한민국 이용자는 아래의 조건을 따르는 경우에 한하여 자유롭게 l 이 저작물을 복제, 배포, 전송, 전시, 공연 및 방송할 수 있습니다. 다음과 같은 조건을 따라야 합니다: l 귀하는, 이 저작물의 재이용이나 배포의 경우, 이 저작물에 적용된 이용허락조건 을 명확하게 나타내어야 합니다. l 저작권자로부터 별도의 허가를 받으면 이러한 조건들은 적용되지 않습니다. 저작권법에 따른 이용자의 권리는 위의 내용에 의하여 영향을 받지 않습니다. 이것은 이용허락규약(Legal Code)을 이해하기 쉽게 요약한 것입니다. Disclaimer 저작자표시. 귀하는 원저작자를 표시하여야 합니다. 비영리. 귀하는 이 저작물을 영리 목적으로 이용할 수 없습니다. 변경금지. 귀하는 이 저작물을 개작, 변형 또는 가공할 수 없습니다.
Master’s Thesis of Science in Food Science and Biotechnology
Metagenomic approaches to
understand the beef meat
microbiota and their interactions
소고기 마이크로바이옴과 그 상호작용에 대한
메타게놈 분석
February 2020
Department of Agricultural Biotechnology
College of Agriculture and Life Sciences
Seoul National University
석사학위논문
Metagenomic approaches to
understand the beef meat
microbiota and their interactions
지도교수 최 상 호
이 논문을 석사학위논문으로 제출함
2020년 2월
서울대학교 대학원
농생명공학부
황 보 경
황보경의 석사학위논문을 인준함
2020년 2월
위원장
유 상 열 (인)
부위원장
최 상 호 (인)
위원
최 영 진 (인)
i
Abstract
Beef is one of the most consumed food in the world, and it can be spoilage or occurred foodborne illness by microbes. These risks could be caused by resident microbiota and their interactions in beef meat. However, there are little information about the potential risk factors by resident microbiota and interactions between microbes in beef meat. In this study, we analyzed the composition, bacterial interactions, and their predicted functions of microbiota in beef meat. A total of 120 beef meat samples (60 fresh ground and 60 non-grounded beef samples) were collected from three different sites and different sampling months in South Korea, and the microbiota were analyzed by the MiSeq system. Although the microbiota in beef meat were different in each sampling site and sampling month, the dominant phyla were same with sharing core bacteria. In particular, psychrotrophic genera related to spoilage were detected in all samples, and they were significantly increased in July. In the co-occurrence networks, genera related to spoilage were negatively correlated to other indigenous genera. These genera could inhibit the growth of other microbes with using glucose by fermentation. Carnobacterium could play the key role in
ii
these interactions. Results in this study extend our understanding of microbiota and spoilage by resident microbiota in beef meat, and can apply to develop the prevention and reduction the bacterial risks of beef meat products.
Keyword : Beef meat, Microbiota, Spoilage, Foodborne illness, Food safety, Co-occurrence Network
iii
Contents
Abstract ... Ⅰ Contents ... Ⅲ List of Figures ... Ⅴ List of Tables ... Ⅵ Ⅰ. INTRODUCTION ... 1Ⅱ. MATERIALS AND METHODS ... 4
Beef sample collection ... 4
Metagenomic DNA extraction ... 6
16S rRNA gene amplification and MiSeq sequencing ... 7
Sequencing data processing ... 7
Co-occurrence analysis and prediction of functionality .... 9
Ⅲ. RESULTS AND DISCUSSION ... 11
Comparison of diversity indices and bacterial compositions among samples ... 11
Factors influencing the differences in microbiota in different beef samples ... 27
The core genus in beef microbiota in all samples ... 37
Co-occurrence patterns and preserved module in beef core microbiota ... 46
iv
The predicted function of beef core microbiota... 56
Ⅳ. CONCLUSION ... 62
Ⅴ. REFERENCES ... 64
v
List of Figures
Fig. 1. Sampling sites of beef ... 5 Fig. 2. Comparison of bacterial diversity and abundance in
beef meat samples obtained from different sites and at times ... 23 Fig. 3. The composition of microbiota was compared among
samples at the phylum and genus levels ... 25 Fig. 4. The dissimilarity of microbiota in beef meat samples
... 31 Fig. 5. Core genera of beef microbiota ... 41 Fig. 6. Comparison of core genera using heatmap analysis
... 42 Fig. 7. Co-occurrence networks between genera in each
group (A, B, C, and D for groups 1, 2, 3, and 4
in heatmap analysis) ... 50 Fig. 8. Co-occurrence networks between genera in each
group (A, B, C, and D for group 1,2,3 and
4, respectively) ... 52 Fig. 9. Comparison of predicted pathways between group 1
and the other groups clustered in heatmap
vi
List of Tables
Table 1. Summary of diversity indices obtained through Illumina MiSeq sequencing ... 16 Table 2. The list of log2 fold change value according to
sampling months and processing types ... 33 Table 3. Core genera in the microbiota of beef meat ... 43 Table 4. Network diameters of each community and top 5
genera selected by the greatest values of
normalized Betweenness Centrality (BC) ... 54 Table 5. The list of predicted pathways which were
1
Ⅰ. INTRODUCTION
Beef is one of the most highly consumed meats in the world, including Korea [1], and beef products are highly perishable [2]. Microorganisms in beef can cause food safety problems, such as bacterial spoilage and food poisoning. Since beef meat is nutrient rich and has high water activity, microorganisms from the processing environments can easily colonize a beef matrix [3]. Even during storage at refrigeration temperatures, psychrophilic bacteria such as lactic acid bacteria and Pseudomonas spp. could grow on beef meat, thereby increasing bacterial spoilage risks [2]. In addition, outbreaks due to contamination with Escherichia coli and Salmonella spp. on beef have continuously occurred despite maintenance of high hygiene levels [4-6]. Several studies have analyzed the spoilage bacteria or pathogens by culture-based methods to reduce spoilage and foodborne illness [7-9]. Recent studies using high-throughput sequencing methods have also reported the presence of spoilage related microorganisms or pathogens in processing steps or focused on the bacterial
2
change under different storage conditions [3, 10-12]. These studies focusing on specific bacteria provided limited information on the whole microbial composition of beef meat. Therefore, analyzing the whole microbiota in the beef is needed to understand the microbial risk for food safety.
Furthermore, understanding the interactions between microbes in the beef microbiota are also important to prevent or reduce the bacterial risks, because, the existence of complex interactions between the members in microbiota can influence their habitat. However, there were no study reporting the bacterial interactions in beef microbiota. Microorganisms generally shape the module in the co-occurrence network and interact with each other to maintain their functions with the keystone taxa [13-17]. These interactions between microbes could be related to the bacterial risk factors such as spoilage and foodborne illness. Previous studies have also reported that two or more microorganisms contributed to spoilage simultaneously by interacting with each other [18-20] and interspecies
3
interactions of foodborne pathogens are important for their pathogenesis [21].
This study aimed to analyze the potential safety problems posed by microbiota and their interactions on beef meat. The microbiota of fresh beef meat (ground and non-grounded), collected from different sites in different seasons in South Korea, were compared by using the Illumina Miseq sequencing. The effects of the environmental variables on bacterial distributions in beef meat were analyzed, and the bacterial risk was predicted using microbiota information. Results in this study provided insights into bacterial interactions in beef meat and extended our understanding of spoilage and food poisoning by the ecosystem of microbiota in beef meat.
4
Ⅱ. MATERIALS AND METHODS
Beef sample collection
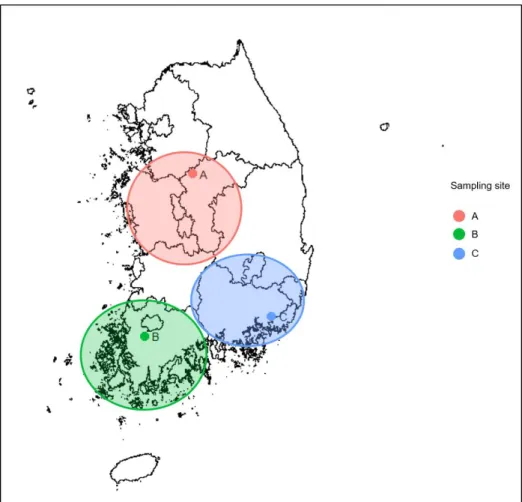
A total of 120 beef samples (60 non-ground and 60 grounded samples) were collected from Livestock Processing Center (LPC; the government local livestock joint market) from three different sites (Fig. 1). These sites were the areas with maximum beef production in Korea based on the annual report of livestock production and marketing channel, 2017, Korea Institute for Animal Products Quality Evaluation (KAPE, www.ekape.or.kr). To figure out the influence of seasonal differences on beef microbiota, we collected the samples in January and July 2018. 4 kg of the beef sample (n=10 at each site) were transported in iceboxes to the laboratory and stored at -80°C until further experiments.
5
Fig. 1. Sampling sites of beef. Samples were obtained from three different sites in January 2018 and July 2018. Those sites are known as the maximum production areas of the South Korea. The beef cattle from the local farms in larger circle were transported into each district LPC (the Smaller points) to processing and transportation to customer.
6 Metagenomic DNA extraction
Non-grounded beef was cut into 5 g cubes and 5 cubes were selected randomly. Ground beef was homogenized, and 25 g of sample was randomly selected. The samples were diluted in 225 mL of buffered peptone water (10 g peptone, 5 g sodium chloride, 3.5 g disodium phosphate, 1.5 g potassium dihydrogen phosphate, with pH 7.2). Bacterial cells were detached from beef using a spindle (microorganism homogenizer, Korea patent registration 10-2010-0034930), and stored at -80°C. Metagenomic DNA was extracted from each sample using the phenol DNA extraction method as described in a previous study [56]. Extracted genomic DNA was purified with the PowerClean DNA Clean-up kit (MO Bio Laboratories, Carlsbad, CA, USA) and confirmed through 1% agarose gel electrophoresis.
7
16S rRNA gene amplification and MiSeq sequencing
The extracted DNA was amplified using primers (targeting V1-V3 region of the 16S rRNA gene) with adapters. PCR amplification followed preparation a 16S metagenomics sequencing library for the MiSeq system (Illumina, Inc., San Diego, CA, USA) was performed following Lee et al.[57]. The library was quantified by quantitative real-time PCR using the Takara PCR Thermal Cycler Dice Real-Time System III with the GenNext NGS Library Quantification Kit (Toyobo, Osaka, Japan). Equimolar concentrations of each library from the different samples were pooled and sequenced using an Illumina MiSeq system (300 bp-paired ends), following the manufacturer's instructions.
Sequencing data processing
Low-quality sequences (Q < 30) and chimeric reads were removed, and paired reads were merged using the Usearch pipeline v8.0 [58]. Primer sequences were removed from these merged sequences, and sequences were clustered to
8
operational taxonomic units (OTUs) by 97% sequence identity based on EzTaxon-e database [59] using CLC genomic workbench (ver.11.0.1) with the Microbial Genomics Module (Qiagen). To compare diversity indices, the numbers of reads in each sample were normalized by random subsampling, and diversity indices were calculated using MOTHUR [60]. Canonical Correspondence Analysis (CCA) was performed to analyze the factors influencing the composition of microbiota using the Bray-Curtis distance matrix in R software and then confirmed with the permutation test. To find the core genus in beef, the average abundance of genera in each sample was used with Venn package in R. The relative abundance of genera was in different samples was calculated by the DeSeq2 package and compared using the heatmap by the pheatmap package in R. For this analysis, the genus with more than 1% relative abundance in each sample was selected. Result with FDR < 0.01 were considered statistically significant.
9
Co-occurrence analysis and prediction of functionality
The co-occurrence network analysis was performed to reveal systematic interactions between the microbes [61]. Spearman’s rank coefficient (ρ) was used to construct the networks with the cutoff values of FDR < 0.01 and ∣𝜌∣≥ 0.6. The networks were visualized by Gephi software [62]. To figure out the keystone genera and their stable modules in beef, we calculated the topological features such as Betweenness Centrality (BC) and figured out modular groups in each network in the Gephi workplace. BC measures how often a node appears on shortest paths between nodes in the network [47] . The high BC represents the importance of taxa over the network, while low BC indicates the peripheral location [63]. Here we have identified the keystone genera based on the normalized BC scores. The top 5 nodes with the highest normalized BC were considered as keystone genus in the co-occurrence network [64, 65].
Then the potential function of each network was predicted by PICRUSt2 (Phylogenic Investigation of Communities by
10
Reconstruction of Unobserved States 2) [66]. The abundance of the predicted function was normalized concerning 16S rRNA gene copy numbers, and MetaCyc pathways were used for predicted functions of microbiota. The statistical differences between groups were analyzed using the two-sided Welch’s test, and confidence intervals were calculated using Welch’s inverted test in Statistical Analysis of Metagenomic Profiles (STAMP) software [67]. Benjamini-Hochberg FDR was used to correct for multiple tests. Only significant results with q-value (corrected p-value) < 0.01 were used.
11
Ⅲ. RESULTS AND DISCUSSION
Comparison of diversity indices and bacterial compositions among samples
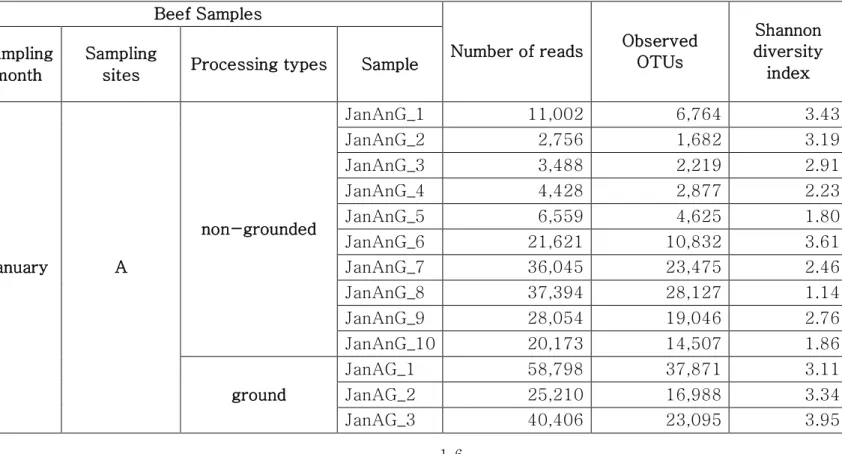
A total of 7,551,419 reads (average 41,475 reads for January samples and 84,382 reads for July samples) were analyzed after the trimming process for the 120 beef samples (Table 1). The numbers of observed OTUs in the July samples revealed higher OTUs (average 61,041 ± 7,843) than January (24,559 ± 1,922; P < 0.0001). Wherein, the number of observed OTUs
was highest in ground beef from the sampling site C in July (JulCG, 81,176 ± 39,019), and the lowest in non-grounded beef from the site A in January (JanAnG, 11,415 ± 3,005). The Shannon diversity indices were compared between samples collected January and July, as well as between samples from different sites at the same time. The average diversity of microbiota was higher in January samples (3.63 ± 0.12) than July samples (2.73 ± 0.11) (P < 0.0001; Fig. 2A). For January samples, the highest diversity was detected in
12
non-grounded beef from site B (4.44 ± 0.08), and the lowest diversity was detected in non-grounded beef from site A (2.54 ± 0.25; P < 0.0001) (Fig. 2B). For July, non-grounded beef from site A had the highest diversity (3.20 ± 0.22), while non-grounded beef from site C had the lowest diversity (1.99 ± 0.34; P < 0.01) (Fig. 2C).
The relative bacterial abundance was determined and compared among samples using quantitative real-time PCR. The abundance of bacteria in beef samples was higher in July (average 1.45 × 10⁶ copies/g) than January (average 1.44 × 10⁵ copies/g; P < 0.0001) (Fig. 2D). The highest bacterial abundance was detected in ground beef from site B in July (average 2.39 × 10⁷ copies/g), whereas the lowest bacterial abundance was detected in non-grounded beef from site B in January (average 1.23 × 10⁴ copies/g) (Fig. 2E). These results indicated that the decreased diversity of July samples with a higher bacteria abundance could be due to the dominance of some bacteria in the microbiota.
13
at phylum and genus levels (Fig. 3). Firmicutes (51.03%) and Proteobacteria (36.58%) were found to be the dominant phyla in all beef samples. The proportions of Firmicutes were higher in July (average 63.20%) than in January (average 38.86%) (P < 0.05). Between the sites, site B revealed higher relative abundance of Actinobacteria both in January (average 14.93%) and July (average 29.67%) samples. However, the identified genera were more diverse in January samples than in July samples (Fig. 3C and D). It was observed that the composition of the microbiota differed between samples collected from different sites in January. The dominant genera in samples from site A were Pseudomonas, Carnobacterium, and Brochothrix; in those from site B were Serratia, Kocuria, and Corynebacterium; and in those from site C were Escherichia, Macrococcus, and Salmonella. In July samples, Carnobacterium (average 28.11%), Lactobacillus (average 19.49%), and Pseudomonas (average 14.54%) were dominant in all samples. However, Serratia and Kocuria were dominant only in samples of site B similar to the microbiota in January
14
samples. Carnobacterium is a prevalent member of lactic acid bacteria (LAB) in fresh meat and processed meat product [22]. Psychrotrophic bacteria such as LAB and Pseudomonas spp. could be easily dominated in meat at a chill temperature [23, 24]. Although the average temperature in July at the three sites was above 26°C (27.2°C at site A, 28.3°C at site B, 26.7°C at site C), psychrotrophic bacteria were found to be dominant in July. This could be due to the cold temperature (below 10°C) during processing in Livestock Processing Center (LPC) and transportation in July. Though the cold temperature in LPC and transportation was also maintained in January, the more diverse microbiota in January could be due to the storage duration of beef meat. An earlier study has reported higher bacterial diversity in fresh-cut beef than the later stage of storage [25].
In addition, the dominant genera differed by sampling sites. Serratia was especially dominant in ground beef from site B in both months (26.32%, 24.0% in January, and July, respectively). Serratia spp. is commonly found in meat [26]
15
and also known as the major spoilage Enterobacteriaceae [9]. On the other hand, Escherichia (16.32% in ground beef) and Salmonella (15.22% in non-grounded beef) were dominant in beef samples from site C in January. The observed differences of microbiota could be due to the environments of LPC, farm, and individual differences of microbiota in cattle. Cattles from different farms were gathered to LPC of each site; thus, the microbiota in cattle was already different before slaughter. However, cattle were washed and processed under a controlled environment in LPC. Therefore, the microbiota in beef meat could be influenced more by the environment of LPC, implicating its importance for food safety. The findings of the present study were supported by the earlier studies that have shown the importance of the processing environment for food safety with reducing microbial contamination was reported in previous studies [27-29].
16
Table 1. Summary of diversity indices obtained through Illumina MiSeq sequencing
Beef Samples
Number of reads Observed OTUs Shannon diversity index Sampling month Sampling
sites Processing types Sample
January A non-grounded JanAnG_1 11,002 6,764 3.43 JanAnG_2 2,756 1,682 3.19 JanAnG_3 3,488 2,219 2.91 JanAnG_4 4,428 2,877 2.23 JanAnG_5 6,559 4,625 1.80 JanAnG_6 21,621 10,832 3.61 JanAnG_7 36,045 23,475 2.46 JanAnG_8 37,394 28,127 1.14 JanAnG_9 28,054 19,046 2.76 JanAnG_10 20,173 14,507 1.86 ground JanAG_1 58,798 37,871 3.11 JanAG_2 25,210 16,988 3.34 JanAG_3 40,406 23,095 3.95
17 JanAG_4 75,094 47,382 3.71 JanAG_5 45,096 29,790 2.91 JanAG_6 17,492 11,696 3.55 JanAG_7 48,658 34,240 2.87 JanAG_8 55,890 37,180 2.62 JanAG_9 56,688 37,160 2.52 JanAG_10 17,870 11,538 2.33 B non-grounded JanBnG_1 40,354 22,723 4.32 JanBnG_2 71,675 37,355 4.55 JanBnG_3 68,525 36,607 4.19 JanBnG_4 78,700 49,386 3.97 JanBnG_5 60,090 34,905 4.45 JanBnG_6 69,832 35,807 4.75 JanBnG_7 72,384 37,706 4.42 JanBnG_8 61,493 32,607 4.78 JanBnG_9 71,112 39,261 4.61 JanBnG_10 38,460 21,963 4.35 ground JanBG_1 51,560 26,124 4.17 JanBG_2 42,104 20,252 4.17 JanBG_3 63,307 31,922 4.30 JanBG_4 53,126 28,627 4.22
18 JanBG_5 43,455 24,321 4.19 JanBG_6 39,228 20,702 4.17 JanBG_7 56,868 31,746 4.15 JanBG_8 41,397 22,022 4.59 JanBG_9 42,078 23,404 4.06 JanBG_10 57,698 27,163 4.20 C non-grounded JanCnG_1 40,750 22,153 4.57 JanCnG_2 83,480 54,084 2.63 JanCnG_3 79,527 48,874 3.09 JanCnG_4 30,098 17,426 3.79 JanCnG_5 57,539 27,364 4.52 JanCnG_6 78,456 43,836 4.05 JanCnG_7 4,755 2,473 4.02 JanCnG_8 5,486 3,454 3.51 JanCnG_9 4,283 2,549 3.35 JanCnG_10 65,501 49,745 3.25 ground JanCG_1 47,421 26,459 4.94 JanCG_2 2,718 1,735 3.50 JanCG_3 24,522 15,021 1.17 JanCG_4 2,145 1,260 4.01 JanCG_5 74,030 51,046 3.82
19 JanCG_6 66,660 44,849 4.24 JanCG_7 46,884 32,633 4.41 JanCG_8 12,918 9,118 4.25 JanCG_9 22,064 12,105 3.60 JanCG_10 3,083 1,663 4.22 July A non-grounded JulAnG_1 41,054 30,699 1.91 JulAnG_2 121,269 71,952 3.83 JulAnG_3 31,251 18,612 3.69 JulAnG_4 66,482 46,824 2.73 JulAnG_5 38,782 23,487 3.74 JulAnG_6 17,792 9,705 3.86 JulAnG_7 15,068 8,375 3.85 JulAnG_8 62,453 38,997 2.59 JulAnG_9 62,068 38,306 2.55 JulAnG_10 24,688 16,618 3.25 ground JulAG_1 51,116 29,599 3.74 JulAG_2 94,347 63,311 2.98 JulAG_3 119,727 75,567 3.44 JulAG_4 92,037 69,458 2.11 JulAG_5 150,001 101,813 2.95 JulAG_6 82,136 65,386 2.45
20 JulAG_7 94,703 68,842 3.42 JulAG_8 208,301 157,294 2.56 JulAG_9 81,371 58,932 2.84 JulAG_10 23,098 16,732 3.17 B non-grounded JulBnG_1 65,485 47,749 3.29 JulBnG_2 72,001 55,706 3.23 JulBnG_3 94,589 74,712 2.95 JulBnG_4 76,867 60,019 3.03 JulBnG_5 284,448 224,623 2.77 JulBnG_6 147,746 90,190 2.57 JulBnG_7 83,251 57,559 3.08 JulBnG_8 68,240 44,990 3.68 JulBnG_9 130,315 84,363 2.85 JulBnG_10 85,197 48,967 3.96 ground JulBG_1 77,165 59,508 1.47 JulBG_2 58,936 46,785 2.75 JulBG_3 62,419 48,154 2.69 JulBG_4 54,512 40,571 2.16 JulBG_5 78,264 57,646 2.43 JulBG_6 84,533 47,851 3.87 JulBG_7 71,697 44,462 2.98
21 JulBG_8 69,961 41,172 3.12 JulBG_9 64,539 43,614 2.46 JulBG_10 104,940 65,482 2.85 C non-grounded JulCnG_1 63,362 48,852 2.21 JulCnG_2 37,084 28,292 1.96 JulCnG_3 117,181 97,471 1.42 JulCnG_4 189,701 165,129 0.95 JulCnG_5 64,503 31,491 4.25 JulCnG_6 69,395 60,974 0.17 JulCnG_7 18,923 15,698 2.62 JulCnG_8 39,451 33,492 2.18 JulCnG_9 25,682 22,449 1.97 JulCnG_10 64,527 52,197 2.11 ground JulCG_1 65,096 54,161 1.11 JulCG_2 516,550 430,355 1.79 JulCG_3 91,631 60,374 2.74 JulCG_4 84,320 51,077 3.16 JulCG_5 32,515 20,707 2.67 JulCG_6 85,777 44,396 4.15 JulCG_7 36,351 26,462 2.30 JulCG_8 47,299 40,601 2.04
22
JulCG_9 63,733 53,621 1.83 JulCG_10 37,001 30,002 2.19
24
Fig. 2. Comparison of bacterial diversity and abundance in beef meat samples obtained from different sites and at times. (A) Comparison of bacterial diversity between samples obtained in January and July. (B) Comparison of diversity indices of samples obtained in January and (C) July. (D) The average bacterial abundance was compared between samples obtained in January and July. (E) The bacterial abundance in each group was compared. The sample name indicates the sampling month, site, and processing types (for example, JanAnG; sample collected in January from site A and non-grounded beef). Error bars indicate the standard deviation. *P < 0.05, **P < 0.01, ***P < 0.001, ****P < 0.0001.
25
26
Fig. 3. The composition of microbiota was compared among samples at the phylum and genus levels. Comparison of phylum composition in beef meat collected in (A) January and (B) July. Comparison of genus composition collected in (C) January and (D) July. Taxa with relative abundance < 1% in each sample were combined with the ‘other’ group.
27
Factors influencing the differences in microbiota in different beef samples
Canonical Correspondence Analysis (CCA) was used to show the correlation of microbiota difference with environmental variables (Fig. 4A). The total inertia of the CCA plot was 5.88, and the constrained inertia was 1.13. A total of 8.6% of the constrained inertia was explained by the CCA1 axis, while CCA2 explained further 5.6%. Arrows on the plot showed the strength that affected the dispersion of the plot. Among the arrows, sampling sites and sampling months had a more significant influence on microbiota dispersion than processing type. Microbiota in January samples was more distinguished according to sampling sites than those in July samples. For July samples, samples from site B were significantly different from the samples of the other two sites. This difference was also observed in genera composition of samples from site B (Fig. 3D). Of the processing types, beef microbiota was significantly different in the ground samples from site B and C in January. In addition, the cluster dendrogram also showed
28
that the distance between ground beef and non-grounded beef was relatively high in these sites, while other samples shared similar communities irrespective of the processing types (Fig. 4B). Overall, the CCA plot indicated that the regional and seasonal factors could comprehensively affect the diversity of beef microbiota. Earlier studies have shown the possibility of transmission of the microbes present in beef cattle and the processing plant to the beef products [28, 30]. From the present findings i also speculated that the cleanliness of farm and processing environment, water quality, and even storage conditions of LPC could have regulated the composition of the microbiota of the beef products, therefore, requiring careful management before and after slaughtering.
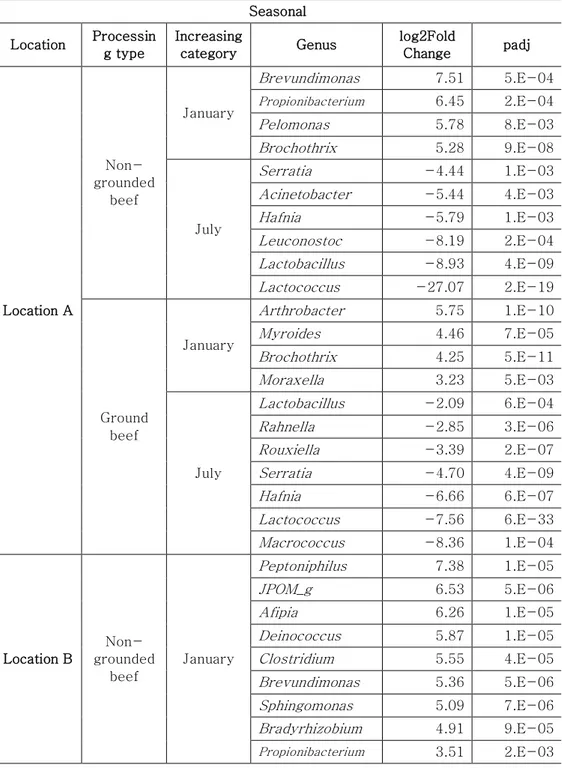
The genera present in the samples collected from different sites at different months subjected to different the grinding processes were determined by DeSeq2 based on log2 fold change values of genus proportion (Table 2). Ten to twenty-one genera were found to be significantly different between sampling months in each sampling site. Propionibacterium was
29
dominant in January samples from all sites (5.62 ± 0.70-fold), whereas Serratia (4.71 ± 0.27-fold), Hafnia (6.39 ± 0.77– fold), Lactobacillus (5.26 ± 0.25–fold), and Lactococcus (12.42 ± 7.46-fold) were dominant in July samples. The dominance of Propionibacterium in January samples could be due to contamination from human skin and indoor slaughter environments [11, 31, 32]. However, a reduced level of Propionibacterium in July sample could be due to the dominance of the LAB, such as Lactobacillus and Lactococcus. As reported earlier, these LAB could inhibit the growth of Propionibacterium acnes through the secretion of bacteriocins [33, 34]. In addition, LAB plays a major role in beef spoilage even in refrigerated temperature [35, 36] and the abundance of LAB, Serratia, and Hafnia genera in the present study could be related to the spoilage of beef. These results indicated that the environmental conditions in July favor spoilage, hence management of beef meat should be careful in July for food safety.
30
and July identified 7 to 19 significantly different genera; however, there’s no significant difference between the ground and non-grounded beef from sites A and C in July. In addition, the cluster dendrogram showed that the similarity of microbiota between ground and non-grounded beef from the same sites in each months was relatively high (Fig. 4B). The findings of the present study indicated that the ground process is not a factor influencing the microbiota in beef meat.
32
Fig. 4. The dissimilarity of microbiota in beef meat samples. (A) Canonical correspondence analysis (CCA) biplot of beef microbiota. The points indicate microbiota of each sample, and the dissimilarity was calculated by Bray-Curtis distance. The axes represent the percentage of the corresponding total variance. The variables (sampling months, sites, and processing types) were depicted as vectors. The longer vector has stronger effects on the dispersion of microbiota. (B) Clustering of microbiota based on Bray-Curtis distance between samples.
33
Table 2. The list of log2 fold change value according to sampling months and processing types
Seasonal Location Processin g type Increasing category Genus log2Fold Change padj Location A Non-grounded beef January Brevundimonas 7.51 5.E-04 Propionibacterium 6.45 2.E-04 Pelomonas 5.78 8.E-03 Brochothrix 5.28 9.E-08 July Serratia -4.44 1.E-03 Acinetobacter -5.44 4.E-03 Hafnia -5.79 1.E-03 Leuconostoc -8.19 2.E-04 Lactobacillus -8.93 4.E-09 Lactococcus -27.07 2.E-19 Ground beef January Arthrobacter 5.75 1.E-10 Myroides 4.46 7.E-05 Brochothrix 4.25 5.E-11 Moraxella 3.23 5.E-03 July Lactobacillus -2.09 6.E-04 Rahnella -2.85 3.E-06 Rouxiella -3.39 2.E-07 Serratia -4.70 4.E-09 Hafnia -6.66 6.E-07 Lactococcus -7.56 6.E-33 Macrococcus -8.36 1.E-04 Location B Non-grounded beef January Peptoniphilus 7.38 1.E-05 JPOM_g 6.53 5.E-06 Afipia 6.26 1.E-05 Deinococcus 5.87 1.E-05 Clostridium 5.55 4.E-05 Brevundimonas 5.36 5.E-06 Sphingomonas 5.09 7.E-06 Bradyrhizobium 4.91 9.E-05 Propionibacterium 3.51 2.E-03
34 July Lactobacillus -2.81 6.E-03 Kocuria -3.53 5.E-05 Carnobacterium -3.68 2.E-05 Serratia -4.23 1.E-05 Brochothrix -4.74 4.E-11 Macrococcus -5.23 5.E-09 Staphylococcus -5.97 1.E-16 Weissella -10.78 3.E-20 Ground beef January Anoxybacillus 8.33 2.E-13 Sphingomonas 8.08 4.E-14 Clostridium 7.81 4.E-14 Methylobacterium 7.35 4.E-11 Brevundimonas 6.46 1.E-08 JPOM_g 6.43 6.E-12 Pseudomonas 6.41 3.E-11 Deinococcus 6.37 3.E-10 Propionibacterium 6.22 5.E-11 Bradyrhizobium 5.67 7.E-08 Arthrobacter 4.77 5.E-06 Psychrobacter 4.74 3.E-07 Afipia 4.07 6.E-03 Moraxella 3.07 4.E-03 July Myroides -3.01 8.E-03 Lactobacillus -4.25 2.E-07 Carnobacterium -4.62 9.E-17 Hafnia -4.94 1.E-09 Macrococcus -5.36 1.E-08 Enterococcus -5.92 2.E-13 Weissella -6.95 1.E-09 Location C Non-grounded beef January Anoxybacillus 10.01 1.E-17 Peptoniphilus 8.25 1.E-14 Pelomonas 6.69 1.E-07 Salmonella 6.53 1.E-06 Propionibacterium 6.29 3.E-09 Vibrio 5.94 2.E-05 Clostridium 5.62 6.E-08 Deinococcus 4.74 3.E-06
35 Sphingomonas 3.23 4.E-03 July Acinetobacter -3.44 3.E-03 Pseudomonas -4.11 1.E-03 Lactobacillus -4.31 4.E-03 Brochothrix -4.99 2.E-04 Rahnella -5.06 4.E-03 Carnobacterium -5.17 2.E-03 Ground beef January Anoxybacillus 9.09 2.E-11 Peptoniphilus 7.18 2.E-07 Clostridium 5.33 1.E-03 Micrococcus 5.26 5.E-04 Vibrio 4.84 1.E-03 Psychrobacter 3.66 9.E-03 July Lactococcus -2.62 7.E-03 Pseudomonas -4.43 3.E-06 Rouxiella -5.39 2.E-04 Serratia -5.48 3.E-04 Hafnia -7.57 2.E-06 Carnobacterium -7.70 2.E-14 Lactobacillus -9.19 5.E-15 Leuconostoc -9.43 7.E-15 Processing type Location Season Increasing
category Genus log2Fold Change padj Location A January Non-grounded beef Enterococcus 7.16 2.E-06 Propionibacterium 3.05 9.E-04 Ground beef Moraxella -3.91 2.E-04 Lactococcus -4.43 4.E-03 Psychrobacter -4.57 1.E-05 Lactobacillus -7.03 3.E-11 Leuconostoc -9.30 2.E-26 Myroides -10.16 6.E-24 Arthrobacter -10.55 9.E-31 July N
36 Location B January Non-grounded beef JPOM_g 4.86 2.E-10 Vibrio 4.75 5.E-03 Afipia 4.43 2.E-06 Micrococcus 4.11 2.E-10 Deinococcus 3.75 1.E-08 Bacillus 3.44 3.E-03 Bradyrhizobium 3.39 1.E-07 Brevundimonas 2.71 2.E-03 Sphingomonas 2.64 6.E-05 Clostridium 2.06 1.E-03 Enterococcus 1.37 3.E-03 Ground beef Staphylococcus -1.57 3.E-03 Carnobacterium -1.95 2.E-03 Kocuria -2.45 2.E-06 Arthrobacter -2.68 1.E-03 Pseudomonas -4.70 2.E-23 Pantoea -5.55 1.E-13 Corynebacterium -8.14 2.E-39 Serratia -9.05 1.E-50 July Non-grounded beef Methylobacterium 21.53 1.E-14 Anoxybacillus 20.35 1.E-10 Pseudomonas 4.42 7.E-03 Brochothrix 3.17 5.E-03 Staphylococcus 3.07 4.E-03 Ground beef Enterococcus -3.78 3.E-04 Corynebacterium -8.13 5.E-09 Location C January Non-grounded beef Pelomonas 4.53 2.E-04 Salmonella 3.92 2.E-04 Propionibacterium 2.41 5.E-03 Deinococcus 2.03 2.E-04 Micrococcus 1.93 8.E-03 Ground beef Kocuria -4.11 2.E-04 Brochothrix -4.76 2.E-04 July N
37
The core genus in beef microbiota in all samples
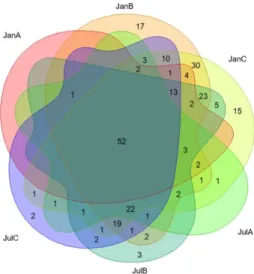
Based on the results of the cluster dendrogram that showed the minimal influence of the ground process on the community dissimilarity (Fig. 4B), the core genera were determined in the beef samples collected from different sampling sites and times (Fig. 5). The identified core genera are summarized in Table 3. A total of 52 genera were detected as core genera among all beef samples while 27 genera in January samples, and 25 genera in July samples. Also, two genera were found to be specific to site B and one genus specific to site C.
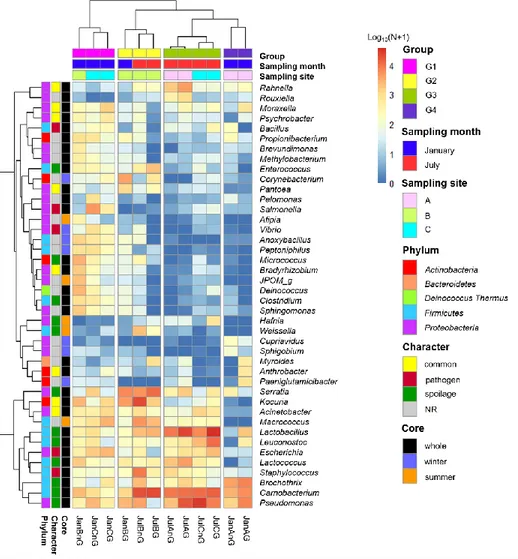
Subsequently the relative abundances of core genera were compared among samples through heatmap analysis (Fig. 6). The samples were clustered into 4 groups based on Spearman correlation, and groups were mainly distinguished by the sampling month (January samples in groups 1 and 4; July samples in groups 2 and 3). Then the genera were classified into 4 character groups related to microbial risk factors according to the previous studies [2, 29, 37]. The characters groups were common (commonly found genera in fresh beef),
38
spoilage (genera related to beef spoilage), pathogen (related to potential foodborne pathogens), and NR (not reported). We identified 8 genera as common, 12 genera as spoilage, 5 genera as pathogen, and 17 genera as NR (Table 3). In the present study, the relative abundances of spoilage genera (63.11%) in beef microbiota was highest (P < 0.001) followed by NR (12.61%), common (11.17%), pathogen (7.71%). It was observed that 84.59% of the core genera were Firmicutes and Proteobacteria and mostly comprising the spoilage group that included 8 genera of Firmicutes, 3 genera of Proteobacteria, and one genus of Actinobacteria. These results were consistent with the previous studies, which have reported that Firmicutes and Proteobacteria as the dominant phyla in spoiled beef [3, 38].
The genera, Escherichia and Salmonella, belonging to the character group ‘pathogen’ were found to be more abundant in beef samples from site C in January compared to the other three groups (16.38% in group 1, 3.91% in group 2, 6.80% in group 3, and 2.24% in group 4). Wherein the other genera
39
related to pathogen were detected with relatively small proportions. It has been shown that these two genera (Escherichia coli and Salmonella spp.) are the most common pathogens causing foodborne illness related to beef consumption [39, 40]. Beef cattle are known as reservoirs of these bacteria, and they can be contaminated during slaughter and processing steps [41, 42]. E. coli and S. enterica were more abundant in final beef products than in the feedlot, as reported in a previous study [10]. Although various pathogens can be eliminated by application of surface antimicrobial treatments, Salmonella spp. can survive by internalization into peripheral lymph nodes and multiply [43].
The relative abundances of genera related to spoilage were higher in samples of group 2, 3, and 4 (60.84%, 82.82%, and 84.90% of core genera, respectively). The risk of spoilage might be higher in beef samples of these groups. Although the relative abundances of Carnobacterium and Pseudomonas were high in these beef samples, the proportions of spoilage genera were different among samples in these groups.
40
Serratia was the dominant genus in group 2 (19.05%), Lactobacillus in group 3 (27.05%), and Brochothrix in group 4 (22.86%). These differences could be due to the existence of different microbiota in different samples, and the influence of the environmental conditions of respective LPC. The spoilage genera that were most abundant in these samples were psychrotrophs and they could grow under cold storage [44, 45]. The findings of the present study revealing the composition of microbiota in beef meat could provide the information for microbial risks such as spoilage and foodborne illness.
41
Fig. 5. Core genera of beef microbiota. Venn diagram shows the shared genera among samples in each season. Only genera with 0.1 % relative abundance threshold were depicted. Samples were grouped by site in each month. There were 27 core genera in January, and 25 core genera in July. And 52 genera would be core of beef microbiota. Site specific genera were found in location B and C with small proportions.
42
Fig. 6. Comparison of core genera using heatmap analysis. The relative abundances of genera were calculated by a log10 scale. Samples were clustered to group 1, 2, 3, and 4 by spearman correlations. Core genera were characterized by common, pathogen, spoilage, and NR.
43
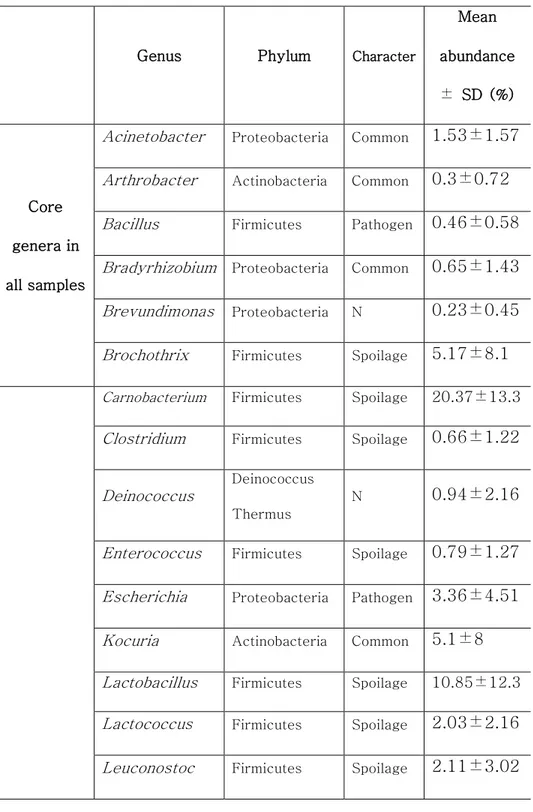
Table 3. Core genera in the microbiota of beef meat
Genus Phylum Character
Mean abundance ± SD (%) Core genera in all samples
Acinetobacter Proteobacteria Common 1.53±1.57
Arthrobacter Actinobacteria Common 0.3±0.72
Bacillus Firmicutes Pathogen 0.46±0.58
Bradyrhizobium Proteobacteria Common 0.65±1.43
Brevundimonas Proteobacteria N 0.23±0.45
Brochothrix Firmicutes Spoilage 5.17±8.1
Carnobacterium Firmicutes Spoilage 20.37±13.3 Clostridium Firmicutes Spoilage 0.66±1.22
Deinococcus
Deinococcus Thermus
N 0.94±2.16
Enterococcus Firmicutes Spoilage 0.79±1.27
Escherichia Proteobacteria Pathogen 3.36±4.51
Kocuria Actinobacteria Common 5.1±8
Lactobacillus Firmicutes Spoilage 10.85±12.3 Lactococcus Firmicutes Spoilage 2.03±2.16
44
Methylobacterium Proteobacteria N 0.26±0.42
Micrococcus Actinobacteria Spoilage 1.07±2.36
Moraxella Proteobacteria Common 1.16±1.62
Myroides Bacteroidetes N 0.39±0.77
Pantoea Proteobacteria Common 0.53±1.4
Pelomonas Proteobacteria N 0.54±1.52
Propionibacterium Actinobacteria N 1.12±1.45
Pseudomonas Proteobacteria Spoilage 13.93±10.5 Psychrobacter Proteobacteria Common 0.59±1.01
Rahnella Proteobacteria Common 1.31±2.21
Rouxiella Proteobacteria N 0.29±0.53
Salmonella Proteobacteria Pathogen 1.48±4.18
Serratia Proteobacteria Spoilage 5.65±8.92
Sphingomonas Proteobacteria N 0.65±1.4
Staphylococcus Firmicutes Pathogen 1.98±2.85
Core genera in January samples Anoxybacillus Firmicutes N 1.02±1.66 Corynebacterium Actinobacteria N 1.67±4.51 Cupriavidus Proteobacteria N 0.17±0.45 Paeniglutamicibacter Actinobacteria N 0.37±1.05
45
Peptoniphilus Firmicutes N 0.9±1.7
Sphingobium Proteobacteria N 0.12±0.31
Vibrio Proteobacteria Pathogen 0.44±0.89
Core genera in
July samples
Afipia Proteobacteria N 0.13±0.34
Hafnia Proteobacteria Spoilage 0.17±0.44
JPOM_g Proteobacteria N 0.69±1.88
Macrococcus Firmicutes N 3.12±4.01
46
Co-occurrence patterns and preserved module in beef core microbiota
The genera related to spoilage in this study were also reported in spoiled beef, and they can contribute to bacterial spoilage by interacting with each other [46]. Thus, we analyzed the co-occurrence networks to figure out the interactions of microbes in beef meat (Fig. 7). Significant (FDR < 0.01) and strong (∣𝜌∣≥ 0.6) correlations were selected for co-occurrence networks. The network diameter and top 5 genera with high Betweenness Centrality (BC) scores were showed in Table 4. The interactions between abundant pathogen genera and other microbes in beef meat of group 1 were relatively few (Fig. 7A). Escherichia was positively correlated with Bacillus (𝜌 = 0.62), whereas Salmonella did not show any relationships with other genera. Although these genera were found to be correlated to genera of common and NR in the other groups, their
47
proportions were relatively smaller than group 1. Spoilage genera (Lactobacillus, Carnobacterium, Serratia, Weissella, and Hafnia) were negatively correlated with other genera in group 2 (Fig. 7B). These findings indicated that spoilage microbes could inhibit non-spoilage microbes by interaction in beef meat of group 2. The predominant genus, Lactobacillus, was positively correlated with Lactococcus (𝜌 = 0.64) and Leuconostoc (𝜌 = 0.67) in samples of group 3 (Fig. 7C). Other dominant genera in group 3, Carnobacterium and Pseudomonas, did not show any significant correlations. In group 4, Pseudomonas was positively correlated with Leuconostoc (𝜌 = 0.70) and Lactobacillus (𝜌 = 0.72), and Carnobacterium and Brochotrhix were correlated with each other (𝜌 = 0.75). Furthermore, the modularity analysis of the network revealed that the abundant genera tend to form the small modules among them; Escherichia had the smallest module in group 1 (module1 in Fig. 8A), Serratia in group 2 didn't
48
form any module (module 4 in Fig. 8B), LAB formed an isolated module in group 3 (module 5 in Fig. 8C), and the abundant spoilage genus in group 4 also formed small modules among them (module 1, 3 in Fig. 8). These results indicated that dominant genera formed their independent modules making a synergistic environment to each other. In particular, spoilage genera module makes the competitive interactions with other microbes, and this interaction could inhibit the growth of other microbes in beef microbiota.
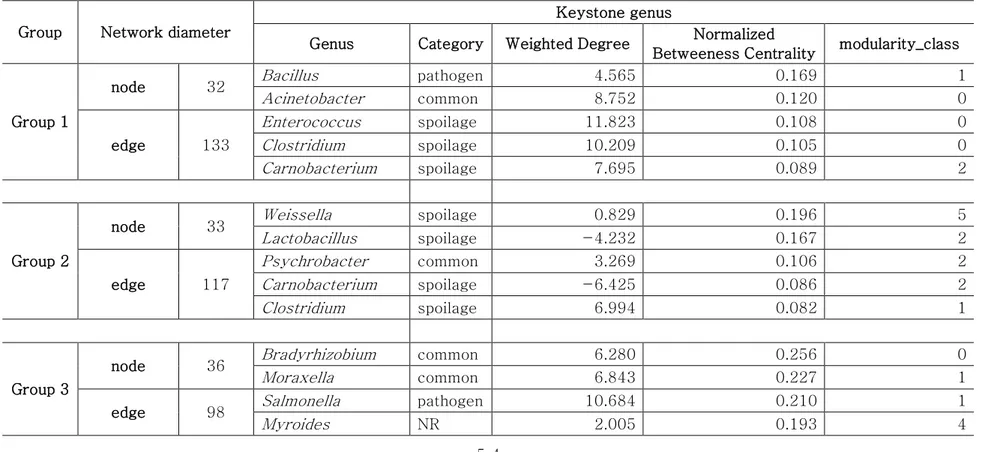
The spoilage module was found to be conserved by Carnobacterium in the networks. Genera with relatively low abundance showed the high BC scores (Fig. 8). This result was consistent with the previous study that the less abundant taxa have important role in maintaining the bacterial community [47]. However, Carnobacterium and Lactobacillus had high BC scores with low proportions in group 1 and with high proportions in groups 2 and 4 (Fig.
49
7 and Fig. 8). These two genera conserved the module with other spoilage genera, such as Lactococcus, Leuconostoc, and Moraxella in the networks. In addition, Carnobacterium was defined as the keystone genus in samples of groups 1 and 2 (Table 4). Several studies defined the conserved module as a functional group [14, 15]. Therefore, Carnobacterium could play a key role in bacterial spoilage of beef meat, and the presence of C. divergens during all spoilage stages in refrigerated storage has been reported earlier [44]. Thus, the presence of Carnobacterium could serve as the spoilage marker, and the management of this genus is important in bacterial risk of spoilage in beef meat.
51
Fig. 7. Co-occurrence networks between genera in each group (A, B, C, and D for groups 1, 2, 3, and 4 in heatmap analysis). Nodes correspond to the core genus, and edges indicate the correlation between genera. Only significant edges (FDR < 0.01) with spearman's rho (ρ) less than -0.6 (blue line) and larger than 0.6 (red line) are shown. The color of node indicates the category of characteristics in Figure 6. The size of node corresponds to relative abundance of genus.
53
Fig. 8. Co-occurrence networks between genera in each group (A, B, C, and D for group 1,2,3 and 4, respectively). Nodes correspond to core genus, and edges indicate correlations between them. Only significant (FDR < 0.01) edges with spearman’s rho (𝜌) less than -0.6 (blue) or larger than 0.6 (red) were showed. The nodes are grouped by module, and node sizes are correspond to normalized betweenness centrality (BC) score. Carnobacterium was detected as the keystone genus in (A) group 1 and (B) group 2, and it conserved its module with the spoilage genera.
54
Table 4. Network diameters of each community and top 5 genera selected by the greatest values of normalized Betweenness Centrality (BC)
Group Network diameter
Keystone genus
Genus Category Weighted Degree Normalized
Betweeness Centrality modularity_class
Group 1
node 32 Bacillus pathogen 4.565 0.169 1 Acinetobacter common 8.752 0.120 0 edge 133 Enterococcus spoilage 11.823 0.108 0 Clostridium spoilage 10.209 0.105 0 Carnobacterium spoilage 7.695 0.089 2 Group 2
node 33 Weissella spoilage 0.829 0.196 5 Lactobacillus spoilage -4.232 0.167 2 edge 117 Psychrobacter common 3.269 0.106 2 Carnobacterium spoilage -6.425 0.086 2 Clostridium spoilage 6.994 0.082 1 Group 3
node 36 Bradyrhizobium common 6.280 0.256 0 Moraxella common 6.843 0.227 1 edge 98 Salmonella pathogen 10.684 0.210 1 Myroides NR 2.005 0.193 4
55 Sphingomonas NR 5.403 0.162 3 Group 4 node 31 Corynebacterium NR 7.538 0.145 0 Bacillus pathogen 4.181 0.069 2 edge 69 Propionibacterium NR 6.598 0.056 0 Escherichia pathogen 4.591 0.041 0 Acinetobacter common 3.619 0.034 0
56
The predicted function of beef core microbiota
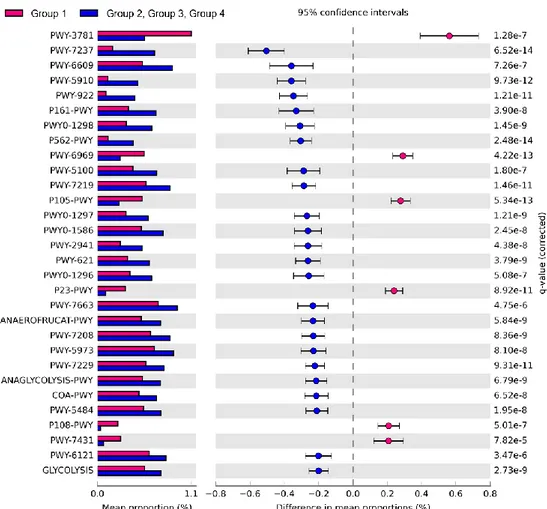
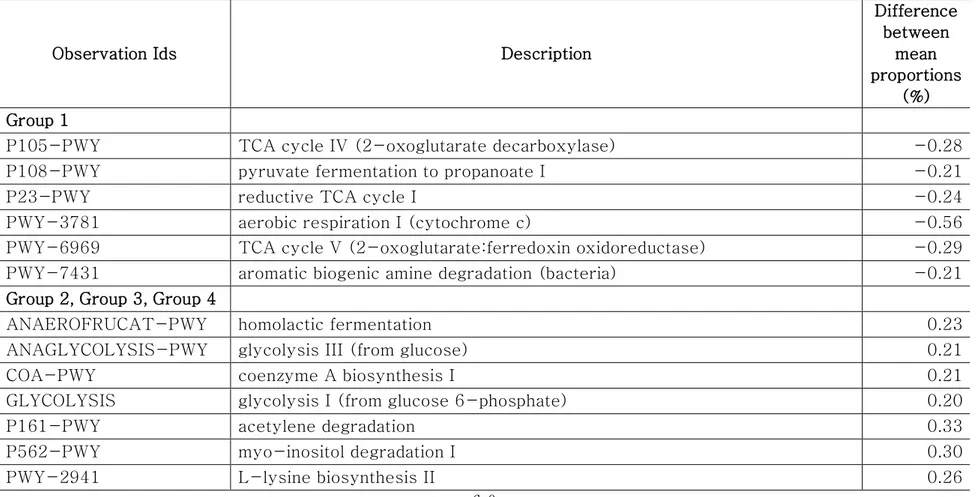
Comparison of the predicted functions of microbiota between samples in group 1 and other groups using PICRUSt2 (Fig. 9) identified a total of 221 significantly different pathways between group 1 and other groups (FDR < 0.01). The details of the groups with more than 0.20% difference are provided in Fig. 9 and Table 5.
The proportions of pathways related to the TCA cycle and aerobic respiration were significantly higher in samples of group 1 than those in other groups (Table 5). These results indicated that the aerobic bacteria were predominant and played important roles in samples of group 1. We observed higher abundance of Escherichia and Salmonella in these samples. The results were consistent with the previous studies that showed the abundance of E. coli and Salmonella corresponded to the abundance of aerobic bacteria in beef [48-50]. Wherein, the proportions of pathways related to fermentation and glycolysis were significantly higher in samples of group 2, 3, and 4. These results indicated that
57
fermentation could lead to beef spoilage. Homolactic fermentation (ANAEROFRUCAT-PWY) and pyruvate fermentation to acetate and lactate II (PWY-5100) pathways were significantly higher in samples of group 2, 3, and 4 compared to samples of group 1. These pathways were related to beef souring in previous study [29]. Lactate can maintain a low pH in beef meat; thus, bacteria with acid-tolerance can dominate [51, 52]. The proportions of glycolysis pathways and sucrose degradation pathways were significantly higher in samples of groups 2, 3, and 4. Glucose is one of the main precursors for off-flavors and acids by spoilage microbes such as Carnobacterium, Brochothrix, LAB, and Pseudomonas [46]. In addition, Lactobacillus can cause severe acidification in beef and emission of off-odor compounds, and Leuconostoc can produce organic acid such as acetic acid by using glucose in spoiled beef [22, 53, 54]. Therefore, spoilage genera in samples of groups 2, 3, and 4 could dominate by producing acid, and as a result they could be related to beef spoilage with interactions of microbes in
58 beef meat.
Microbiota in samples of group 1 was more diverse than those of other groups, and the relative abundances of aerobic bacteria were higher in microbiota of group 1. In contrast to microbiota in samples of group 1, the microbes related to the spoilage were detected higher in the microbiota of groups 2, 3, and 4 samples even at cold temperatures. These bacteria may inhibit the aerobic bacteria through fermentation in beef meat. As a result of these interactions, beef meat could be spoiled. The initial contaminating microbes and the storage condition were important to the later stage microbiota in beef [44], and spoilage could occur by metabolites produced by spoilage microbes [55]. In this study, the dominance of spoilage microbes could be related to pathways of glucose utilization, and it could cause beef meat spoilage by resident microbiota. Beef meat has glucose enriched environment; thus, strategies to inhibit the spoilage microbes using obtained information can reduce and prevent spoilage of beef meat by microbiota.
59
Fig. 9. Comparison of predicted pathways between group 1 and the other groups clustered in heatmap analysis (Fig. 6). Pathways were predicted by PICRUSt2. The significantly different pathways between groups (Welch’s t-test q < 0.01) are shown.
60
Table 5. The list of predicted pathways which were significantly different between groups
Observation Ids Description
Difference between mean proportions (%) Group 1
P105-PWY TCA cycle IV (2-oxoglutarate decarboxylase) -0.28 P108-PWY pyruvate fermentation to propanoate I -0.21 P23-PWY reductive TCA cycle I -0.24 PWY-3781 aerobic respiration I (cytochrome c) -0.56 PWY-6969 TCA cycle V (2-oxoglutarate:ferredoxin oxidoreductase) -0.29 PWY-7431 aromatic biogenic amine degradation (bacteria) -0.21
Group 2, Group 3, Group 4
ANAEROFRUCAT-PWY homolactic fermentation 0.23 ANAGLYCOLYSIS-PWY glycolysis III (from glucose) 0.21 COA-PWY coenzyme A biosynthesis I 0.21 GLYCOLYSIS glycolysis I (from glucose 6-phosphate) 0.20 P161-PWY acetylene degradation 0.33 P562-PWY myo-inositol degradation I 0.30 PWY-2941 L-lysine biosynthesis II 0.26
61
PWY-5100 pyruvate fermentation to acetate and lactate II 0.29 PWY-5484 glycolysis II (from fructose 6-phosphate) 0.21 PWY-5910 superpathway of geranylgeranyldiphosphate biosynthesis I (via mevalonate) 0.36 PWY-5973 cis-vaccenate biosynthesis 0.23 PWY-6121 5-aminoimidazole ribonucleotide biosynthesis I 0.20 PWY-621 sucrose degradation III (sucrose invertase) 0.26 PWY-6609 adenine and adenosine salvage III 0.36 PWY-7208 superpathway of pyrimidine nucleobases salvage 0.23 PWY-7219 adenosine ribonucleotides de novo biosynthesis 0.29 PWY-7229 superpathway of adenosine nucleotides de novo biosynthesis I 0.22 PWY-7237 myo-, chiro- and scillo-inositol degradation 0.51 PWY-7663 gondoate biosynthesis (anaerobic) 0.23
PWY-922 mevalonate pathway I 0.35
PWY0-1296 purine ribonucleosides degradation 0.26 PWY0-1297 superpathway of purine deoxyribonucleosides degradation 0.27 PWY0-1298 superpathway of pyrimidine deoxyribonucleosides degradation 0.31 PWY0-1586 peptidoglycan maturation (meso-diaminopimelate containing) 0.26
62
Ⅳ. CONCLUSION
In the present study, the microbiota in beef meat that collected from three different sites in two sampling times in South Korea were analyzed. The microbiota in each sampling site and months were different; however, Firmicutes and Proteobacteria were found to be the dominant phyla in beef meat comprising most of the core genera. Genera related to spoilage were dominant in beef meat from all sampling sites, wherein genera related to pathogens, including Escherichia and Salmonella, were abundantly detected only in one sampling site. The co-occurrence network analysis showed that spoilage genera were keystone and could be important in the interaction between microbes in beef meat, and they interacted with other microbes through fermentation. In particular, Carnobacterium played a key role in the spoilage bacteria module, and this genus was detected in all beef meat samples. Thus, the presence and abundance of this genus could be used as biomarker for spoilage, and its strategized control could be useful for safety and quality of beef meat
63
consumption. The findings of this study enriched the information about bacterial risks of spoilage and foodborne illness by bacterial interactions and their functions in microbiota of beef meat. To best of my knowledge, this study is the first report of beef meat microbiota reporting the interactions between microbes and their functions. However, further studies such as co-culturing, metatranscriptomic, and metabolomics analyses are necessary to validate the results of this study.
64
Ⅴ. REFERENCES
1. Cho S, Kim J, Park B, Seong P, Kang G, Kim J, et al. Assessment of meat quality properties and development of a palatability prediction model for Korean Hanwoo steer beef. Meat Sci. 2010;86:236-42.
2. Doulgeraki AI, Ercolini D, Villani F, Nychas G-JE. Spoilage microbiota associated to the storage of raw meat in different conditions. Int J Food Microbiol. 2012;157:130-41. 3. De Filippis F, La Storia A, Villani F, Ercolini D. Exploring the sources of bacterial spoilers in beefsteaks by culture-independent high-throughput sequencing. PLoS One. 2013;8:e70222.
4. Friesema IH, Schimmer B, Ros JA, Ober HJ, Heck ME, Swaan CM, et al. A regional Salmonella enterica serovar Typhimurium outbreak associated with raw beef products, The Netherlands, 2010. Foodborne Pathog Dis. 2012;9:102-7. 5. Kivi M, Hofhuis A, Notermans D, Wannet W, Heck M, Van De Giessen A, et al. A beef-associated outbreak of Salmonella Typhimurium DT104 in The Netherlands with implications for national and international policy. Epidemiol Infect. 2007;135:890-9.
6. Heiman KE, Mody RK, Johnson SD, Griffin PM, Gould LH. Escherichia coli O157 outbreaks in the United States, 2003–2012. Emerg Infect Dis. 2015;21:1293.
65
7. Black E, Hirneisen K, Hoover D, Kniel K. Fate of Escherichia coli O157: H7 in ground beef following high‐pressure processing and freezing. J Appl Microbiol. 2010;108:1352-60.
8. Limbo S, Torri L, Sinelli N, Franzetti L, Casiraghi E. Evaluation and predictive modeling of shelf life of minced beef stored in high-oxygen modified atmosphere packaging at different temperatures. Meat Sci. 2010;84:129-36.
9. Ercolini D, Russo F, Torrieri E, Masi P, Villani F. Changes in the spoilage-related microbiota of beef during refrigerated storage under different packaging conditions. Appl Environ Microbiol. 2006;72:4663-71.
10. Yang X, Noyes NR, Doster E, Martin JN, Linke LM, Magnuson RJ, et al. Use of metagenomic shotgun sequencing technology to detect foodborne pathogens within the microbiome of the beef production chain. Appl Environ Microbiol. 2016;82:2433-43.
11. Stoops J, Ruyters S, Busschaert P, Spaepen R, Verreth C, Claes J, et al. Bacterial community dynamics during cold storage of minced meat packaged under modified atmosphere and supplemented with different preservatives. Food Microbiol. 2015;48:192-9.
12. Hultman J, Rahkila R, Ali J, Rousu J, Björkroth KJ. Meat processing plant microbiome and contamination patterns of
66
cold-tolerant bacteria causing food safety and spoilage risks in the manufacture of vacuum-packaged cooked sausages. Appl Environ Microbiol. 2015;81:7088-97.
13. Faust K, Raes J. Microbial interactions: from networks to models. Nat Rev Microbiol. 2012;10:538.
14. Zheng H, Xu L, Wang Z, Li L, Zhang J, Zhang Q, et al. Subgingival microbiome in patients with healthy and ailing dental implants. Sci Rep. 2015;5:10948.
15. Tong M, Li X, Parfrey LW, Roth B, Ippoliti A, Wei B, et al. A modular organization of the human intestinal mucosal microbiota and its association with inflammatory bowel disease. PLoS One. 2013;8:e80702.
16. Zhang B, Zhang J, Liu Y, Shi P, Wei G. Co-occurrence patterns of soybean rhizosphere microbiome at a continental scale. Soil Biol Biochem. 2018;118:178-86.
17. Freilich S, Kreimer A, Meilijson I, Gophna U, Sharan R, Ruppin E. The large-scale organization of the bacterial network of ecological co-occurrence interactions. Nucleic Acids Res. 2010;38:3857-68.
18. Jørgensen LV, Huss HH, Dalgaard P. The effect of biogenic amine production by single bacterial cultures and metabiosis on cold‐smoked salmon. J Appl Microbiol. 2000;89:920-34.
67
spoilage of meat and cured meat products. Int J Food Microbiol. 1996;33:103-20.
20. Seminiano EN, Frazier W. Effect of pseudomonads and Achromobacteraceae on growth of Staphylococcus aureus. J Milk Food Technol. 1966;29:161-4.
21. Giaouris E, Heir E, Desvaux M, Hebraud M, Møretrø T, Langsrud S, et al. Intra-and inter-species interactions within biofilms of important foodborne bacterial pathogens. Front Microbiol. 2015;6:841.
22. Pothakos V, Devlieghere F, Villani F, Björkroth J, Ercolini D. Lactic acid bacteria and their controversial role in fresh meat spoilage. Meat Sci. 2015;109:66-74.
23. Stanborough T, Fegan N, Powell SM, Tamplin M, Chandry PS. Insight into the genome of Brochothrix thermosphacta, a problematic meat spoilage bacterium. Appl Environ Microbiol. 2017;83:e02786-16.
24. Gill C, Newton K. The ecology of bacterial spoilage of fresh meat at chill temperatures. Meat Sci. 1978;2:207-17. 25. Säde E, Penttinen K, Björkroth J, Hultman J. Exploring lot-to-lot variation in spoilage bacterial communities on commercial modified atmosphere packaged beef. Food Microbiol. 2017;62:147-52.
68
Characterization of the Enterobacteriaceae community that developed during storage of minced beef under aerobic or modified atmosphere packaging conditions. Int J Food Microbiol. 2011;145:77-83.
27. Rivera-Betancourt M, Shackelford SD, Arthur TM, Westmoreland KE, Bellinger G, Rossman M, et al. Prevalence of Escherichia coli O157: H7, Listeria monocytogenes, and Salmonella in two geographically distant commercial beef processing plants in the United States. J Food Prot. 2004;67:295-302.
28. Stellato G, La Storia A, De Filippis F, Borriello G, Villani F, Ercolini D. Overlap of spoilage-associated microbiota between meat and the meat processing environment in small-scale and large-scale retail distributions. Appl Environ Microbiol. 2016;82:4045-54.
29. Nychas G-JE, Skandamis PN, Tassou CC, Koutsoumanis KP. Meat spoilage during distribution. Meat Sci. 2008;78:77-89.
30. Elder RO, Keen JE, Siragusa GR, Barkocy-Gallagher GA, Koohmaraie M, Laegreid WW. Correlation of enterohemorrhagic Escherichia coli O157 prevalence in feces, hides, and carcasses of beef cattle during processing. PNAS. 2000;97:2999-3003.
31. Alessandria V, Ferrocino I, De Filippis F, Fontana M, Rantsiou K, Ercolini D, et al. Microbiota of an Italian
grana-69
like cheese during manufacture and ripening, unraveled by 16S rRNA-based approaches. Appl Environ Microbiol. 2016;82:3988-95.
32. Jeon Y-S, Chun J, Kim B-S. Identification of household bacterial community and analysis of species shared with human microbiome. Curr Microbiol. 2013;67:557-63.
33. Kober M-M, Bowe WP. The effect of probiotics on immune regulation, acne, and photoaging. Int J Womens Dermatol. 2015;1:85-9.
34. Oh S, Kim S-H, Ko Y, Sim J-H, Kim KS, Lee S-H, et al. Effect of bacteriocin produced by Lactococcus sp. HY 449 on skin-inflammatory bacteria. Food Chem Toxicol. 2006;44:552-9.
35. Holzapfel WH. The Gram-positive bacteria associated with meat and meat products. The microbiology of meat and poultry1998. p. 35-84.
36. Nychas GE, Skandamis P. Fresh meat spoilage and modified atmosphere packaging (MAP). Improving the safety of fresh meat: Elsevier; 2005. p. 461-502.
37. Iulietto MF, Sechi P, Borgogni E, Cenci-Goga BT. Meat spoilage: a critical review of a neglected alteration due to ropy slime producing bacteria. Ital J Anim Sci. 2015;14:4011.
70
high-oxygen modified-atmosphere packaged raw beef steaks by Leuconostoc gasicomitatum and Leuconostoc gelidum. Int J Food Microbiol. 2007;119:340-5.
39. Dechet AM, Scallan E, Gensheimer K, Hoekstra R, Gunderman-King J, Lockett J, et al. Outbreak of multidrug-resistant Salmonella enterica serotype Typhimurium definitive type 104 infection linked to commercial ground beef, northeastern United States, 2003–2004. Clin Infect Dis. 2006;42:747-52.
40. Laufer A, Grass J, Holt K, Whichard J, Griffin PM, Gould L. Outbreaks of Salmonella infections attributed to beef– United States, 1973–2011. Epidemiol Infect. 2015;143:2003-13.
41. Hussein H. Prevalence and pathogenicity of Shiga toxin-producing Escherichia coli in beef cattle and their products. J Anim Sci. 2007;85:E63-E72.
42. Roels T, Frazak P, Kazmierczak J, Mackenzie W, Proctor M, Kurzynski T, et al. Incomplete sanitation of a meat grinder and ingestion of raw ground beef: contributing factors to a large outbreak of Salmonella Typhimurium infection. Epidemiol Infect. 1997;119:127-34.
43. Brichta-Harhay DM, Arthur TM, Bosilevac JM, Kalchayanand N, Schmidt JW, Wang R, et al. Microbiological analysis of bovine lymph nodes for the detection of Salmonella enterica. J Food Prot. 2012;75:854-8.
71
44. Hilgarth M, Behr J, Vogel RF. Monitoring of spoilage‐associated microbiota on modified atmosphere packaged beef and differentiation of psychrophilic and psychrotrophic strains. J Appl Microbiol. 2018;124:740-53. 45. Olofsson T, Ahrné S, Molin G. Composition of the bacterial population of refrigerated beef, identified with direct 16S rRNA gene analysis and pure culture technique. Int J Food Microbiol. 2007;118:233-40.
46. Gram L, Ravn L, Rasch M, Bruhn JB, Christensen AB, Givskov M. Food spoilage—interactions between food spoilage bacteria. Int J Food Microbiol. 2002;78:79-97.
47. Lupatini M, Suleiman AK, Jacques RJ, Antoniolli ZI, de Siqueira Ferreira A, Kuramae EE, et al. Network topology reveals high connectance levels and few key microbial genera within soils. Front Environ Sci. 2014;2:10.
48. Brichta-Harhay DM, Guerini MN, Arthur TM, Bosilevac JM, Kalchayanand N, Shackelford SD, et al. Salmonella and Escherichia coli O157: H7 contamination on hides and carcasses of cull cattle presented for slaughter in the United States: an evaluation of prevalence and bacterial loads by immunomagnetic separation and direct plating methods. Appl Environ Microbiol. 2008;74:6289-97.
49. Siragusa GR, Dorsa WJ, Cutter CN, Bennett GL, Keen JE, Koohmaraie M. The incidence of Escherichia coli on beef
72
carcasses and its association with aerobic mesophilic plate count categories during the slaughter process. J Food Prot. 1998;61:1269-74.
50. Arthur TM, Bosilevac JM, Nou X, Shackelford SD, Wheeler TL, Kent MP, et al. Escherichia coli O157 prevalence and enumeration of aerobic bacteria, Enterobacteriaceae, and Escherichia coli O157 at various steps in commercial beef processing plants. J Food Prot. 2004;67:658-65.
51. Ahn C, Stiles ME. Plasmid-associated bacteriocin production by a strain of Carnobacterium piscicola from meat. Appl Environ Microbiol. 1990;56:2503-10.
52. Schillinger U, Holzapfel W. Antibacterial activity of carnobacteria. Food Microbiol. 1990;7:305-10.
53. Samelis J, BJOeRKROTH J, Kakouri A, Rementzis J. Leuconostoc carnosum associated with spoilage of refrigerated whole cooked hams in Greece. J Food Prot. 2006;69:2268-73.
54. Doulgeraki AI, Paramithiotis S, Kagkli DM, Nychas G-JE. Lactic acid bacteria population dynamics during minced beef storage under aerobic or modified atmosphere packaging conditions. Food Microbiol. 2010;27:1028-34.
55. Jääskeläinen E, Hultman J, Parshintsev J, Riekkola M-L, Björkroth J. Development of spoilage bacterial community and volatile compounds in chilled beef under vacuum or high