©Copyright 2021 Architectural Institute of Korea. 1. INTRODUCTION
An information system (IS) is generally established for a single organization with homogeneous organizational cul-ture and task processes (Checkland et al. 1997), and its performance should be evaluated based on whether it reflects the unique business atmosphere. Done and McLean (2003) proposed a model to evaluate the success of IS using similar indicators to Checkland et al., organization culture and working environment. This model assesses the success of an IS based on the System Quality, Information Quality, Service Quality,
System Use, User Satisfaction, and Net Benefit and has been applied in various fields such as finance, electronic commerce, and the Internet industry (Pitt et al. 1995; Li 1997; Meyers at al. 1997; Raymond and Bergeron 2008; Lee and Yu 2012).
In the construction industry various information systems such as ERP and PMIS have been implemented and used. For this reason, model Done and McLean seems suitable to evaluate the IS to support practitioners in the field of construction. However ERP was designed to support tasks of a single organization, Project Management Information Systems (PMIS) were developed to maintain and provide data for one-off construction projects (Yang et al. 2007). For this reason, the users of PMIS are also members of one-off project organization consisting of clients, representatives on the client side, contractors etc. and main agent to lead the use of PMIS were uncertain. As consequence, the use of PMIS is greatly affected by the temporary cultivated organizational tendencies and individual awareness of participants. Depending on the user’s role, various individual users characteristics also need to be considered because the main management challenges and users’ IT abilities would be. The main individual factors include users’ ability to use IT applications ability (Nelson 1990; Compeau and Higgins 1995), which is an individual characteristic variable, Extrinsic Motivation (Petter et al. 2013) from a psychological perspective, and future Loyalty (Yalowitz 2002; Bai et al. 2008; Deng et al.
Analysis of PMIS Users Satisfaction and Loyalty
Using Structural Equation Model
Min-Cheol Kim, Hyung-Il Lee, Sang-Ho Cho and Ju-Hyung Kim
Researcher, Department of Architectural Engineering, Hanyang University, Seoul, South Korea General Manager, NH Investment & Securities, Seoul, South Korea
Vice President, Tomoon Architects & Engineering, Seoul, South Korea
Professor, Department of Architectural Engineering, Hanyang University, Seoul, South Korea
https://doi.org/10.5659/AIKAR.2021.23.1
Abstract Project management information systems (PMIS) have been implemented to support cooperation among the participants of construction projects. Unlike other information systems used by members from an organization with similar culture and business environment, the PMIS are members from one-off fragmented project organization with diverse professional background. Successful operation is significantly affected by the tendencies of client’s side and individual awareness of participants. In this regard, it is imperative to evaluate the success of the system based on the individual characteristics of PMIS users. Thus, this study proposes a method for determining the system success by analyzing the extent of the effects of system factors such as System Quality, Information Quality, and Service Quality and individual factors such as a user’s IT application ability, Extrinsic Motivation to achieve User Satisfaction, and loyalty. Accordingly, a structural equation model (SEM), an effective tool to examine of the comprehensive structure of a causal relationship, is applied for analysis because the internal awareness of individuals is established as a variable.
Keywords: Structural Equation Model, PMIS, Satisfaction, Loyalty, System Quality
Corresponding Author : Min-Cheol Kim
Department of Architectural Engineering, Hanyang University, 222, Wangsimni-ro, Seongdong-gu, Seoul, South Korea
e-mail : [email protected]
This is an Open Access article distributed under the terms of the Creative Commons Attribution Non-Commercial License (http:// creativecommons. org/licenses/by-nc/3.0/) which permits unrestricted non-commercial use, distribution, and reproduction in any medium, provided the original work is properly cited.
2010; Chang et al. 2008) toward using the system, i.e., their likeliness to recommend the system to other members of their respective organizations. In existing studies on evaluating the success of the PMIS, the System Quality, Information Quality, and Service Quality (Raymond and Bergeron 2008; Lee and Yu 2011) are proposed as general factors for evaluating the success of PMIS. These factors affect User Satisfaction (Lee and Yu 2012; Sung et al. 2012; Caniels and Bakens 2012), Project Management Efficiency (Lee and Yu, 2011), Quality of Decision-making (Caniels and Bakens 2012), and the success of both the project managers and the project (Raymond and Bergeron 2008).
Previous studies have proposed various factors responsible for affecting the success of a system, and regression analysis (Williams et al. 2009; Jang 2010; Kim 2012), which examines the relationship between dependent variables and independent variables, has frequently been used as the method of analysis. However, this analytical method has a limitation in examining the overall causal structure between system-related variables and individual variables. In this regard, it is reasonable to implement a structural equation model (SEM), which can comprehensively analyze the awareness of the users of the system, their individual characteristics, and Extrinsic Motivation to examine the effects of these factors on single indices such as overall Satisfaction and Loyalty from various angles.
This study uses a modification of the IS success model of DeLone and McLean (2003) to investigate the effects of the quality of the PMIS (i.e., the System Quality, Information Quality, and Service Quality), Users’ IT application Ability, and Extrinsic Motivation on User Satisfaction and Loyalty through an SEM analysis. The study also reflects the situation in the field by obtaining data from the users of the PMIS, which, in practice, is being operated in firms where different projects are being carried out simultaneously.
2. LITERATURE ON INFORMATION SYSTEM (IS) SUCCESS Among the IS success evaluation models that have been reported, the model by DeLone and McLean(1992) has been widely applied. The model has six performance variables as follows: Information Quality, System Quality, System Use, User Satisfaction, Individual Impact, and Organizational Impact. The relationship among variables is indicated in Figure. 1
Figure 1. Model of IS Success by DeLone and McLean(1992; 87p)
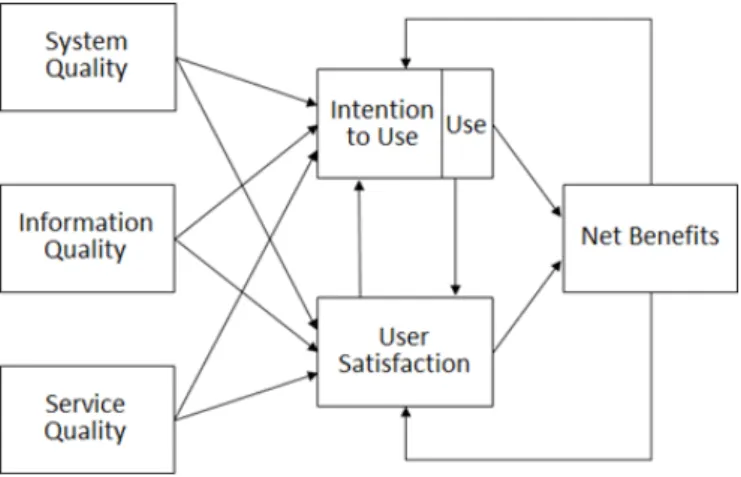
However, the study by DeLone and McLean focuses on the use of mainframe in the 1980s; thus, it ignores the service-related aspects of an IS. Since the development of ISs, they have been playing an increasing role in firms. Consequently, the success of an IS does not only increasingly depend on its ability to perform effectively, but also on its ability to provide a satisfactory service to its users. Accordingly, Pitt et al. (1995) suggested that Service Quality be additionally applied to the IS success model of DeLone and McLean. They also conducted a longitudinal study for a year and found that Service Quality serves as an effective tool for measuring the success of an IS and has a significant effect on User Satisfaction. In addition, other researchers (Li 1997; Meyers et al. 1997) derived empirical results to verify that Service Quality is a crucial factor in measuring the effectiveness of an IS and has a significant effect on User Satisfaction. Subsequently, DeLone and McLean proposed an improved IS success model based on the results other researchers obtained when evaluating and verifying their existing model. In this improved model, Service Quality is added as a new variable in accordance with the development of Web-based services. In addition, both Individual and Organizational Impact, collectively known as the Net Benefit, was added to analyze the relationship and mutual dependence among the seven areas (DeLone and McLean 2003). The arrows in the figure show the suggestion of relation among the features. The one system is evaluated by three different perspectives which are ‘information quality’, ‘system quality’, and ‘service quality’. These features can affect to 'use' or ‘intention to use’ & ‘user satisfaction’. The 'net benefits' can be derived by the use of system. The 'net benefits' can affect to the user satisfaction and use of information system.
Figure 2. DeLone and McLean Model of IS Success(2003; 24p)
(1) User Satisfaction and Loyalty
Satisfaction is the overall and subjective evaluation of consumers in respect of the acquisition of a certain product, service, or consumption experience. It also refers to a situation in which products and services are re-purchased and customer confidence is maintained as a result of the desire and expectation of customers being satisfied (Goodman 1989). Studies on
customers and marketing in terms of satisfaction have shown that satisfaction exerts an effect on both the attitudes after purchase and the purchase intention (Bearden and Teel 1983; Oliver 1980; Oliver and Linda 1981). Satisfaction affects loyalty, and the main indices for this influence include recommendation and re-purchase intentions. For example, when the expectations of visitors to a museum are identified and fulfilled, they become willing to re-visit the museum (Yalowitz 2002). Moreover, among the studies on satisfaction and loyalty in other fields, Bai et al. (2008) verified the effects of website quality (i.e., functionality and usability) on the satisfaction and purchase intention of users in the financial industry. Through SEM analysis, they found that the above-mentioned aspects relating to website quality have significant effects on User Satisfaction, which in turn has a sig-nificant effect on User Loyalty. Deng et al. (2010) conducted a study based on an SEM analysis to identify the determinants of User Satisfaction and User Loyalty. This study enabled them to confirm that the confidence, Service Quality, and perceived values, such as functional and emotional value, have significant effects on User Satisfaction, which was found to have a significant effect on User Loyalty. Afsar et al. (2010) focused on the banking industry in Pakistan as a study target to derive the determinants of User Loyalty. By conducting multiple regression analysis, they verified Service Quality is significantly affected by User Satisfaction, which they determined to significantly influence behavioral intention. Beerli et al. (2002) carried out an SEM analysis based on an empirical investigation of the banking industry. The analysis enabled them to confirm that User Satisfaction and individual conversion cost serve as the main determinants that have significant positive effects on User Loyalty. Chang et al. (2008) used the same analytical method to verify that User Satisfaction exerts significant effects on User Loyalty in the case of e-commerce.
(2) Ability to Use IT Application
Users’ IT application ability, which refers to the trust or confidence of an individual in his or her ability to perform a certain IT task, serves as a cognitive motivation factor that affects individual behavior or performance. Moreover, the individual characteristics of a user (i.e., their age, sex, position, level of education, and experience in terms of receiving computer training or using a computer) affect user attitude and satisfaction (Igbaria et al. 1990). Among the individual characteristics, situational variables including the user’s level of computer training, computer proficiency, ability to use IT applications, attitude, and participation were found to affect User Satisfaction with different degrees of importance (Nelson 1990). Compeau and Higgins (1995) verified that an individual’s ability to use an IT application has crucial effects on the outcome derived by using a computer. They also stated that the required IT proficiency should be developed to allow for successful operation of the IS and such that the desirable outcome is achieved in an organization by considering that individual’s ability to use an IT application is an important characteristic factor that connects an organization with an
individual using a computer. Santhanm and Hartono (2003) indicated that an organization capable of effectively applying and supporting IT by boosting the enhancement of employees’ IT application abilities achieves more efficient task performance. Preliminary studies that implemented individual characteristic variables as exogenous variables confirmed that situational variables, particularly among the individual characteristics, such as a user’s educational training, computer proficiency, IT application ability, attitude, and participation, had positive or negative effects on User Satisfaction with different degrees of importance (Shin and Sohn, 2011).
(3) Extrinsic Motivation
Motivation factors refer to an inner status for triggering, ordering, and maintaining a certain behavior and are defined by the desire and need that simulate goal-oriented behavior (Woolfolk 2012; Huit, 2001). These factors are largely classified into those relating to intrinsic motivation, including pleasure, curiosity, and individual desire and interest, and those relating to Extrinsic Motivation, which include incentive, punishment, and social pressure (Woolfolk 2012). The development and operation of an IS requires long-term commitment and a considerable investment in IT and human resources. It also calls for the cooperation of different divisions in an organization, and for managers to actively support the development of the IS to ensure its success (Sanders et al. 1985). Support from sen-ior managers, relevant training, and the attitudes of computing personnel affect the satisfaction of IS users, and the significance of IS in the organization varies according to the level of support shown by top managers. Lawrence and Low (1993) argued that the support of top managers is necessary to establish an environment in which resistance to organizational change is minimized and members of the organization adapt to these changes. Only when IS users are provided with sufficient motivation, will they encounter fewer operational and cultural problems upon implementation of the new IS and be able to adapt to the relevant conditions.
(4) Evaluation of PMIS Quality
PMIS for construction is a new project and construction management method that allows clients, representatives on the client side, and contractors to integrate and exchange all information relating to the construction work to achieve effective management such as a reduction in the construction period, prime cost, and work efficiency through swift and accurate communication (Lee and Yu 2011). The meaning of 'clients' in the dissertation can be an individual, organization or party that places in a project order. 'Representatives on the client side' means a proxy(agent) that is in charge of managing the project as a specialist on behalf of the client. Generally it's called as project manager(PM). Lee and Yu (2012) proposed a PMIS success model applicable to the field of construction based on the IS success model of DeLone & McLean (2003) and verified that the quality (i.e., System Quality, Information Quality, and Service Quality) of PMIS has significant effects on User
Satisfaction and construction management efficiency. Moreover, Sung et al. (2012) analyzed the effects of success factors of Web-based PMIS on the User Satisfaction and user intention by conducting multiple regression analysis based on the same IS success model above. They also confirmed that Information Quality and Service Quality have significant positive effects on user intention and satisfaction under the circumstances under which the system should be used regardless of the System Quality and that the environment in which the system is intended to be used should be sufficiently considered. Chung et al. (2008, 2009) verified success and failure factors in implementing an ERP system based on the IS success model of DeLone & McLean (2003). They also proposed a technology acceptance model (TAM) and a model to measure the success of an ERP system for construction by carrying out an empirical analysis based on a wide range of data. Raymond and Bergeron (2008) used the IS success model of DeLone & McLean (2003) and the TAM to propose a model to evaluate the effectiveness of a PMIS by deriving the quality of the PMIS and the information it contains as factors that affect its success.
3. PMIS EVALUATION MODEL (1) Research Model
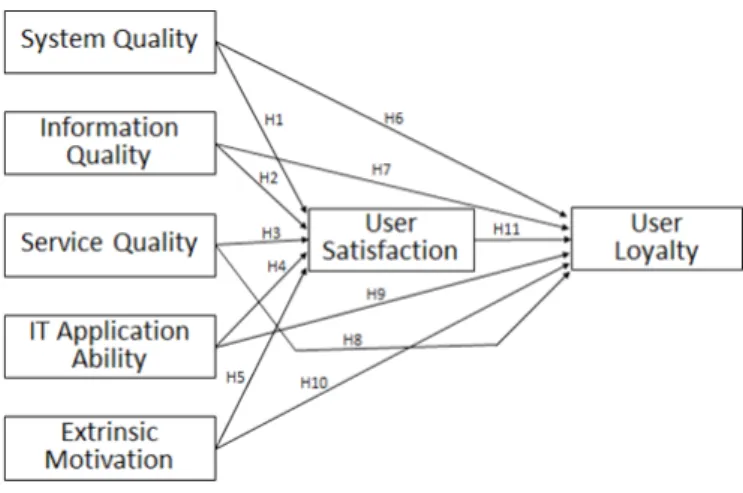
The purpose of this study is to verify the effects of the quality of the PMIS as well as the user’s ability to use an IT application, and their Extrinsic Motivation on User Satisfaction and Loyalty (Figure. 4). In other words, the study aims to identify the direct and indirect effects of the above-mentioned variables on User Satisfaction and Loyalty as well as the direct effects of User Satisfaction on User Loyalty
Figure 3. Research model for evaluating User Satisfaction and Loyalty
(2) Exogenous Variable
System Quality refers to the performance of an IS as perceived by its users and is assessed by measuring the processing speed and the degree of system stability and failure (DeLone & McLean 1992; Pitt et al. 1995; DeLone & McLean 2003; Edward et al. 2005).
Information Quality refers to the extent to which users’ needs are satisfied by the information provided by the system, which is an outcome of the IS, and is measured by the degree of accuracy, adequacy of screen composition, information diversity, and the timely supply of information (DeLone and McLean 1992; Pitt et al. 1995; DeLone & McLean 2003; Edward et al. 2005).
Service Quality refers to the extent to which users’ needs are met by the services provided by the IS and is measured by service speed, the extent to which employees are punctual, and the expertise of service providers (Pitt et al. 1995; DeLone & McLean 2003; Edward et al. 2005).
Users who are highly capable of using IT applications and are able to utilize and apply the system more effectively, can communicate with developers through enhanced mutual understanding, thereby reducing resistance to the application of the IS (Igbaria et al. 1990; Nelson 1990; Santhanm and Hartono 2003).
In addition, top managers should be aware of the concept of PMIS and its strategic importance and provide Extrinsic Motivation such as appropriate evaluation and compensation systems that encourage employees to actively use the PMIS and education and training systems that boost flexible work processing should be provided (Sanders et al. 1985; Woolfolk 2012).
(3) Endogenous Variables
User Satisfaction and User Loyalty differ from each other in terms of meaning because the former indicates the user’s attitude toward a product or service, whereas the latter indicates the user’s behavior toward the product or service. Many studies have been conducted verify the satisfaction of an IS user as a precedent factor of User Loyalty mainly in the fields of marketing and finance, whereas few studies have been carried out to verify User Satisfaction as a crucial determinant of the loyalty of a PMIS user (Chang et al. 2008; Bai, Law and Wen 2008; Deng et al. 2010; Afsar et al. 2010). As such, previous studies identified the satisfaction of an IS user as a precedent factor of User Loyalty and assumed that User Satisfaction and User Loyalty are highly correlated.
(4) Defining and Measuring Variables
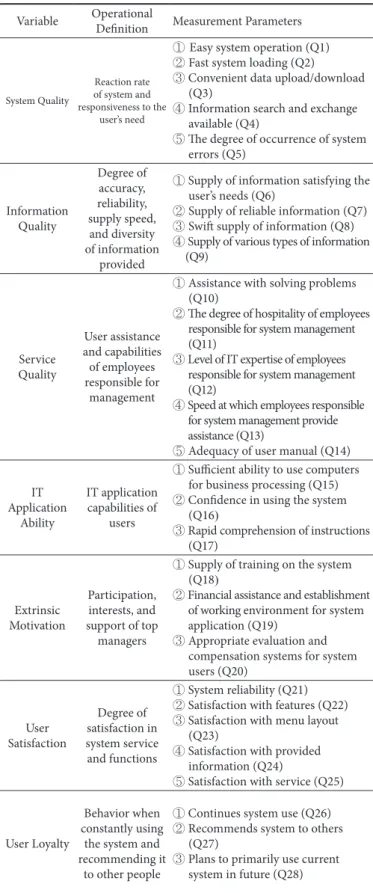
The operational definition of variables and relevant measurement items applied in this study are provided in Table 1. (5) Research Hypothesis
This study analyzes the effects of the PMIS quality variables (i.e., System Quality, Information Quality, and Service Quality), users’ ability to use IT applications, and their Extrinsic Motivation to achieve User Satisfaction and loyalty, and establishes research hypotheses based on the preliminary studies as follows.
H1 : The System Quality of PMIS will have a significant positive effect on User Satisfaction.
H2 : The quality of information provided by PMIS will have a significant positive effect on User Satisfaction.
Table 1. Operational Definition of Variables and Relevant Measurement Items Variable Operational Definition Measurement Parameters
System Quality
Reaction rate of system and responsiveness to the
user’s need
① Easy system operation (Q1) ② Fast system loading (Q2)
③ Convenient data upload/download (Q3)
④ Information search and exchange available (Q4)
⑤ The degree of occurrence of system errors (Q5) Information Quality Degree of accuracy, reliability, supply speed, and diversity of information provided
① Supply of information satisfying the user’s needs (Q6)
② Supply of reliable information (Q7) ③ Swift supply of information (Q8) ④ Supply of various types of information
(Q9) Service Quality User assistance and capabilities of employees responsible for management
① Assistance with solving problems (Q10)
② The degree of hospitality of employees responsible for system management (Q11)
③ Level of IT expertise of employees responsible for system management (Q12)
④ Speed at which employees responsible for system management provide assistance (Q13)
⑤ Adequacy of user manual (Q14)
IT Application Ability IT application capabilities of users
① Sufficient ability to use computers for business processing (Q15) ② Confidence in using the system
(Q16)
③ Rapid comprehension of instructions (Q17) Extrinsic Motivation Participation, interests, and support of top managers
① Supply of training on the system (Q18)
② Financial assistance and establishment of working environment for system application (Q19)
③ Appropriate evaluation and compensation systems for system users (Q20) User Satisfaction Degree of satisfaction in system service and functions ① System reliability (Q21) ② Satisfaction with features (Q22) ③ Satisfaction with menu layout
(Q23)
④ Satisfaction with provided information (Q24)
⑤ Satisfaction with service (Q25)
User Loyalty
Behavior when constantly using
the system and recommending it
to other people
① Continues system use (Q26) ② Recommends system to others
(Q27)
③ Plans to primarily use current system in future (Q28)
H3 : The Service Quality of PMIS will have a significant positive effect on User Satisfaction.
H4 : Users’ ability to use IT applications will have a significant positive effect on User Satisfaction.
H5 : Users’ Extrinsic Motivation will have a significant positive
effect on User Satisfaction.
H6 : The System Quality of PMIS will have a significant positive effect on User Loyalty.
H7 : The quality of information provided by PMIS will have a significant positive effect on User Loyalty.
H8 : The Service Quality of PMIS will have significant positive effect on User Loyalty.
H9 : Users’ ability to use IT applications will have a significant positive effect on User Loyalty.
H10 : Users’ Extrinsic Motivation will have a significant positive effect on User Loyalty.
H11 : User Satisfaction with the PMIS will have a significant positive effect on User Loyalty.
(6) Composition of the questionnaire Table 2. Composition of the Questinnaire
Category Questionnaire item Measurement method System
Quality Ⅰ. System Quality of PMIS: Items 1 to 5
5-point Likert scale Information
Quality Ⅱ.6 to 9 Information Quality of PMIS: Items Service
Quality Ⅲ.14 Service Quality of PMIS: Items 10 to IT
Application Ability
Ⅳ. Users’ ability to use IT applications: Items 15 to 17
Extrinsic
Motivation Ⅴ. Extrinsic Motivation: Items 18 to 20 User
Satisfaction Ⅵ.Items 21 to 25 User Satisfaction with the PMIS: User Loyalty Ⅶ.to 28 User Loyalty to the PMIS: Items 26
General Respondent
Items
Ⅷ. General items on respondents: Sex, age, firm classification, position, period of using the PMIS
The effects of the exogenous constructs, namely the PMIS quality (i.e., System Quality, Information Quality, and Service Quality), users’ ability to use IT applications, and their Extrinsic Motivation, on the endogenous constructs including User Satisfaction and loyalty, were analyzed by designing the questionnaire based on preliminary studies, as shown in Table 2. General items on the respondents include their sex, age, firm classification, position, and period of using the PMIS. A five-point Likert scale was used to assess the response to each question in the questionnaire. On this scale, 1, 2, 3, 4 and 5 represent “strongly disagree”, “disagree”, “neutral”, “agree” and “strongly agree” respectively.
4. DATA COLLECTION AND ANALYSIS
(1) Analytic result of questionnaire respondent statistics and descriptive statistics
In this study, participants from the following three groups were selected: clients, representatives on the client side, and contractors. These participants were asked to use the questionnaire to respond to the survey that was conducted to obtain data. The initial questionnaire was reviewed by three PMIS development experts regarding the redundancy of 28 items and adequacy of classification based on previous studies and then used in this study. This questionnaire was subsequently distributed to 201 PMIS users in the three categories mentioned above, who were participating in 11 construction projects(four apartment buildings, five efficiency apartments, two hotels) in Korea during October 2015. A total of 172 questionnaires were retrieved, which is a collection rate of 85.7 %. SPSS, which is a statistical package for the social sciences, and AMOS SEM were used to analyze the reliability and validity of the data obtained, examine the descriptive statistics, and verify the hypotheses.
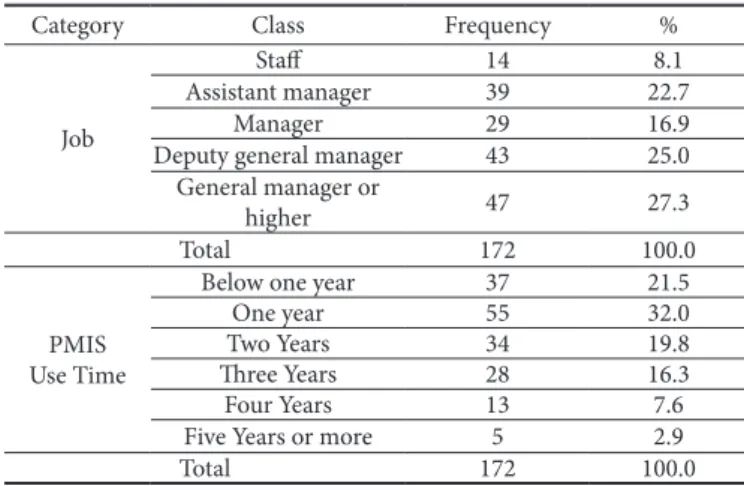
The respondent statistics that were obtained based on the 172 samples are indicated in Table 3. The result of analyzing the descriptive statistics on each question in the questionnaire through the five-point Likert scale indicates that the minimum values are 1 and 2 and that the maximum value is 5; the mean values of variables are higher than 3, which is the standard level. Responses do not vary according to the PMIS user groups (i.e., clients, representatives on the client side, and contractors) whereas they do vary according to individuals.
Table 3. Statistics on the Questionnaire Respondents-1
Category Class Frequency %
Sex FemaleMale 16111 93.66.4
Total 172 100.0 Age Under 30 20 11.6 30~39 58 33.7 40~49 47 27.3 50~59 40 23.3 Over 60 7 4.1 Total 172 100.0 Firm classification Client 35 20.3 Project management representative in the client side 49 28.5 Contractor 85 49.4 Other 3 1.7 Total 172 100.0
Table 4. Statistics on the Questionnaire Respondents-2
Category Class Frequency %
Job
Staff 14 8.1
Assistant manager 39 22.7
Manager 29 16.9
Deputy general manager 43 25.0
General manager or
higher 47 27.3
Total 172 100.0
PMIS Use Time
Below one year 37 21.5
One year 55 32.0
Two Years 34 19.8
Three Years 28 16.3
Four Years 13 7.6
Five Years or more 5 2.9
Total 172 100.0
(2) Verification of reliability and validity of the evaluation scale
The value of Cronbach’s α was calculated to examine the reliability of each scale, and confirmative factor analysis was carried out to verify the validity of latent variables through the scale.
Prior to the verification of SEM, the validity of variables that were to be applied to this research model was confirmed through reliability analysis and confirmative factor analysis, as indicated in Table 4. First, it was found that the entire set of values (Cronbach’s α) of reliability coefficients are 0.8 or higher, thus verifying the reliability of the measurement items. In the result of examining the absolute fit index among the goodness of fit, χ2=522.55 (df=329, p=0.001), thus being significant; χ2/ Q=1.59 (≤3 is desirable); RMR=0.02 (≤0.08 is desirable); GFI= 0.82 (≥0.90 is desirable); AGFI=0.78 (≥0.80 is desirable); and RMSEA= 0.06 (≤0.10 is desirable). Based on this result, this research model has been confirmed to be appropriate.
Table 5. Results of Conduction Reliability Analysis and Confirmatory Factor Analysis
Latent Variable Que-stion
Stan- dardiz-ing Coef-ficient Stand-ard Error CR AVE Con-struct Valid-ity Cronb ach’s α System Quality Q1 0.90 - -0.88 0.97 0.95 Q2 0.92 0.05 19.59 Q3 0.83 0.07 15.52 Q4 0.85 0.06 16.07 Q5 0.94 0.05 20.85 Infor-mation Quality Q6 0.89 - -0.82 0.95 0.90 Q7 0.93 0.06 17.36 Q8 0.79 0.06 13.22 Q9 0.72 0.06 11.30 Service Quality Q10 0.65 - -0.68 0.91 0.82 Q11 0.71 0.13 7.46 Q12 0.74 0.12 7.63 Q13 0.68 0.11 7.18 Q14 0.69 0.12 7.25 IT Appli-cation Ability Q15 0.83 - -0.81 0.93 0.90 Q16 0.93 0.07 15.09 Q17 0.84 0.07 13.22 Extrin-sic Motiva-tion Q18 0.96 - -0.90 0.96 0.94 Q19 0.90 0.05 20.59 Q20 0.89 0.05 20.00 User Satis-faction Q21 0.74 - -0.80 0.95 0.83 Q22 0.67 0.13 8.13 Q23 0.69 0.11 8.29 Q24 0.69 0.09 8.38 Q25 0.77 0.09 9.20 User Loyalty Q26 0.91 - -0.94 0.98 0.90 Q27 0.90 0.06 16.83 Q28 0.82 0.07 14.24
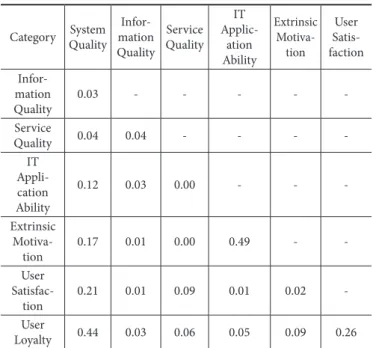
Table 6. Analytical Result of Discriminant Validity among Variables
Category System Quality mation Infor-Quality Service Quality IT Applic-ation Ability Extrinsic Motiva-tion User Satis-faction Infor-mation Quality 0.03 - - - - -Service Quality 0.04 0.04 - - - -IT Appli-cation Ability 0.12 0.03 0.00 - - -Extrinsic Motiva-tion 0.17 0.01 0.00 0.49 - -User Satisfac-tion 0.21 0.01 0.09 0.01 0.02 -User Loyalty 0.44 0.03 0.06 0.05 0.09 0.26
In addition, convergent validity, which indicates wheth-er obswheth-erved variables are well established to measure latent variables, was analyzed. The first condition for convergent validity is that each path from latent variables to observed variables should be significant, and it was found that the entire paths are significant at the level of p < 0.001. Second, a standardized coefficient of 0.5 or higher is desirable, and those of the entire set of latent variables satisfy the standard value. Third, a construct reliability of 0.7 or higher is desirable, and that of the entire set of latent variables fulfill the standard value. Subsequently, discriminant validity, which indicates whether the similarity between latent variables is excessively high, was verified by examining whether the square (r2) of the correlation coefficient between variables is lower than the value of the average variance extracted (AVE), as shown in Table 5. The analytical result shows that the values for all the cases are in accordance with discriminant validity.
As such, it has been confirmed through various methods that the latent variables applied in this study have high convergent validity and discriminant validity.
(3) Hypothesis verification
Table 6 contains the result of verifying the hypotheses by analyzing each path, and the breakdown is as follows.
H1 : The direct effect of the path from System Quality to User Satisfaction is 0.44; thus, it is positively significant (p<0.01).
H2 : The direct effect of the path from Information Quality to User Satisfaction is 0.44; thus, it is positively significant (p<0.01).
H3 : The direct effect of the path from Service Quality to User Satisfaction is 0.22; thus, it is positively significant (p<0.01).
H4 : The direct effect of the path from users’ IT application ability to User Satisfaction is insignificant.
H5 : The direct effect of the path from Extrinsic Motivation to User Satisfaction is insignificant.
Table 7. Result of SEM Analysis of the Research Model: Verification of <H1> to <H2>
Cat-egory Path De-parture ArrivalPath Direct Effect CR SMC valuep- Adop-tion H1 QualitySystem User Satisfac-tion 0.44 4.6 27% 0.000 Y H2 mation Infor-Quality 0.45 3.10 0.002 Y H3 QualityService 0.22 2.51 0.009 Y H4 IT Appli-cation Ability 0.08 0.61 0.543 N H5 MotivationExtrinsic -0.03 -0.21 0.836 N H6 QualitySystem User Loyalty 0.52 6.17 49% 0.000 Y H7 mation Infor-Quality 0.02 0.33 0.745 N H8 QualityService 0.07 0.90 0.925 N H9 IT Appli-cation Ability 0.77 2.05 0.041 Y H10 Extrinsic Motivation 0.49 2.85 0.004 Y H11 Satisfac-User tion 0.24 2.90 0.004 Y
Figure 4. Result of research model for evaluating User Satisfaction and Loyalty
H6 : The direct effect of the path from System Quality to User Loyalty is 0.52; thus, it is positively significant (p<0.01).
H7 : The direct effect of the path from Information Quality to User Loyalty is insignificant.
H8 : The direct effect of the path from Service Quality to User Loyalty is insignificant.
H9 : The direct effect of the path from users’ IT application ability to User Loyalty is 0.77; thus, it is positively significant (p<0.05).
H10 : The direct effect of the path from Extrinsic Motivation to User Loyalty is 0.49; thus, it is positively signifi-cant (p<0.01).
H11 : The direct effect of the path from User Satisfaction to User Loyalty is 0.24; thus, it is positively significant (p<0.01) (4) Discussion of the Results of Hypothesis Verification
The result of verifying the hypotheses indicated that ex-ogenous variables such as the PMIS quality, users’ ability to use IT applications, and their Extrinsic Motivation have positive, significant effects on User Satisfaction or loyalty although not all 11 hypotheses are adopted.
First, the System Quality exerts significant positive effects on both User Satisfaction and loyalty. This result shows that users found the PMIS easy to operate and found it convenient to execute and exchange complex tasks requiring data of the construction period and the project cost by simply inputting information. System Quality was found to have the most crucial effect on User Satisfaction and loyalty. In this regard, improved quality and convenience should be considered factors capable of enhancing the system.
Moreover, Information Quality and Service Quality have significant positive effects on User Satisfaction whereas they insignificantly affect User Loyalty. The loyalty of users towards utilizing the system in future and their recommending it to other people has been verified to be low because the stakeholders of construction projects, who tend to be conservative, mainly exchange information and perform tasks face to face in the field. However, the users are generally satisfied with the reliability, supply speed, and diversity of information as well as the service and problem-solving performance provided by the system. In addition, the effects of Service Quality are insufficient to directly influence User Loyalty.
The ability of users to use IT applications and their Extrinsic Motivation have insignificant effects on User Satisfaction, whereas they have positive, significant effects on User Loyalty. As shown in Table 3, more than a half of the questionnaire respondents either hold the position of deputy general manager or general manager and are either in their 40s or older. The results of the interviews that were conducted indicate that when these managers use the PMIS, they depend on younger employees who have lower positions. Furthermore, users’ IT application ability and Extrinsic Motivation were not found to have significant positive effects on User Satisfaction because the respondents filled in the questionnaires under conditions where Extrinsic Motivation such as financial support, establishment of a working environment, and appropriate evaluation and compensation for system application were not regularly provided, because of the characteristics of a one-off construction project.
Fourth, User Satisfaction has a significant positive effect on User Loyalty. Although not all of the forms of PMIS quality (i.e., System Quality, Information Quality, and Service Quality), users’ IT application ability, and their Extrinsic Motivation affect User Satisfaction and loyalty directly or indirectly, System Quality was found to have a significant positive effect on both
User Satisfaction and loyalty. In addition, User Loyalty is high as User Satisfaction is high.
5. CONCLUSION
PMIS is the main IS that is used in the construction industry to provide management support. However, contrary to IS in other fields, these systems are developed and operated based on one-off projects. Therefore, feedback on loyalty toward the system from clients, representatives on the client side, and contractors who intermittently use this system is not provided. Even contractors who use this system more regularly show different PMIS user performance and loyalty depending on the business report systems or political relationships established with clients for each project. However, a systematic investigation of users’ ability to use IT applications, Extrinsic Motivation, satisfaction, and loyalty of users and clients was limited because the clients, who play an important role in implementing the PMIS and encouraging its operation, change according to the projects.
This study aimed to verify the system factors capable of enhancing User Satisfaction and loyalty. This enabled us to establish the following individual characteristics affecting PMIS users that warranted analysis: System Quality, Information Quality, Service Quality, users’ IT application ability, and their Extrinsic Motivation. These factors were derived through typical analytical studies of ISs. An SEM analysis, which can be used to comprehensively examine the causal relationship between system-related variables and individual characteristic variables, was carried out, and the main results of the analysis that was conducted to verify the hypotheses are as follows.
1) System Quality has the most significant effect on User Satisfaction and loyalty. 2) Users’ ability to use IT applications and their Extrinsic Motivation do not affect User Satisfaction, whereas both of these factors have a significant positive effect on User Loyalty. 3) User Satisfaction has a significant positive effect on User Loyalty.
Additionally, it was verified that System Quality significantly affects User Satisfaction and loyalty, provided that the system is user friendly, i.e., the system allows users to easily execute and exchange complex processing tasks requiring data of the construction life cycle and project cost per construction project by simply inputting information. There was actual achievement in cost saving and minimizing use of labor resources by the PMIS. On the other hand, users’ IT application ability was found not to have a significant positive effect on User Satisfaction be-cause more than half of questionnaire respondents belong to an age group that was not provided with education on PMISs at university. Extrinsic Motivation does not have a significant positive effect on User Satisfaction either because respondents filled in the questionnaires under circumstances where Extrinsic Motivation such as the establishment of a working environment and appropriate evaluation and compensation for system application was not regularly provided due to the characteristics of one-off construction project organization. Finally, not all
the factors initially identified as being potentially capable of affecting PMIS users, namely System Quality, Information Quality, Service Quality, users’ IT application ability, and their Extrinsic Motivation were determined to have direct or indirect effects on both User Satisfaction and loyalty. However, System Quality was found to have a significant positive effect on both User Satisfaction and loyalty and User Loyalty is high as User Satisfaction is high.
The SEM analysis confirmed that the System Quality, Information Quality, Service Quality, users’ IT application ability, and their Extrinsic Motivation have significant effects on User Satisfaction or User Loyalty. The result of this study can be used as baseline for developing and operating a PMIS that leads to higher User Loyalty. However, in this study the characteristics of users were generalized based on three user groups (clients, representatives on the client side, and contractors); therefore, further studies should be conducted to identify the effects of individual tendencies of each of these user groups on User Satisfaction and loyalty.
REFERENCES
Afsar, B., Rehman, Z. U., Qureshi, J.A., & Shahjehan, A. (2010). “Determinants of customer loyalty in the banking sector: The case of Pakistan.” African Journal of Business Management,
4(6): 1040–1047.
Bai, B., Law, R., & Wen, I. (2008). “The impact of website quality on customer satisfaction and purchase intentions: Evidence from Chinese online visitors.” International Journal of Hospitality Management, 27: 391–402.
Bearden, W. O., & Teel, J. E. (1983). “Selected determinants of consumer satisfaction and complaint reports.” Journal of Marketing Research, 20(1): 21–28.
Beerli, A., Martin, J. D., & Quintana, A. (2002). “A model of customer loyalty in the retail banking market.” European Journal of Marketing, 38(1/2): 253–275.
Caniels, M. C., & Bakens, R. J. (2012). “The effects of Project Management Information systems on decision making in a multi project environment.” International Journal of Project Management, 30: 162–175.
Checkland, P., & Holwell, S. (1997). “Information, systems and information systems: Making sense of the field.”
Chung, B. Y., Skibniewski, M. J., Lucas Jr, H. C., & Kwak, Y. H. (2008). "Analyzing enterprise resource planning system implementation success factors in the engineering– construction industry.” Journal of Computing in Civil Engineering, 22(4): 373–83.
Chung, B. Y., Skibniewski, M. J., & Kwak Y. H. (2009). “Developing ERP systems success model for the construction industry.” Journal of Construction Engineering and Management, 135(3): 207–17.
Compeau, D. R., & Higgins, C. A. (1995). “Computer self-efficacy: Development of a measure and initial test.” MIS Quarterly, 19(2): 189–211.
DeLone, W. H., & McLean, E. R. (1992). “Information systems
success: The quest for the dependent variable.” Information Systems Research, 3(1): 60–95.
DeLone, W. H., & McLean, E. R. (2003). “The DeLone and McLean model of information systems success: A ten-year update.” Journal of Management Information Systems,
19(4): 9–30.
Deng, Z., Lu, Y., Wei, K. K., & Zhang, J. (2010). “Understanding customer satisfaction and loyalty: An empirical study of mobile instant messages in China”, International Journal of Information Management, 30: 289–300.
Ein-Dor, Segev. & Steinfeld (1981). “Organizational context and the success of management information systems.”
Management Science, 24(10): 1064-1077.
Garrity, E. J., Glassberg, B., Kim, Y. J., Sanders, G. L., & Shin, S. K. (2005). “An experimental investigation of web-based information systems success in the context of electronic commerce.” Decision Support Systems, 39(3): 485–503.
Goodman, J. (1989). “The nature of customer satisfaction.”
Quality Progress, 22(2): 37–40.
Huitt, W. (2001). “Motivation to learn: An overview.” Educational Psychology Interactive.
Igbaria, M., & Nachman, S. A. (1990). “Correlates of User Satisfaction with end user computing.” Information and Management, 19(2): 73–82.
Jang, H. (2010). “Analysis of pedestrian-streetscape image in commercial district using Structural Equation Model.” Department of Transportation Engineering Graduate School, Myongji University.
Kim, Y. (2012). “The Structural Equation Model validation of social anxiety, empathy, social skills, anger-expressive form, interpersonal relationships satisfaction affecting the euphoria of college students.” Department of Education Graduate School, Yeungnam University.
Lawrence, M., & Low, G. (1993). “Exploring individual User Satisfaction within user-led development.” MIS Quarterly,
17(2): 195–2.
Lee, S. K., & Yu, J. H. (2012). “Success model of project management information system in construction.”
Automation in Construction, 25: 82–93.
Lee, S. K., & Yu, J. H. (2011). “Critical Success Factors for Project Management Information System in Construction.” Journal of Construction Engineering and Project Management, 1:
25–30
Li, E. Y. (1997). “Perceived importance of information system success factors: A meta analysis of group differences.”
Information and Management, 32: 15–28.
Lucas(1982). The Impact of Office Automation on the Organization: Some Implications for Research and Practice,”
Communications of the ACM, 25(11): 838-847.
Meyers, B. L., Kappelrnan, L. A., & Prybutok, V. R. (1997). “A comprehensive model for assessing the quality and productivity of the information systems function: Toward a theory for information systems assessment.” Information Resources Management Journal: 6–26.
information-driven technologies: A critical review.” MIS Quarterly, 14(1):
79–100.
Oliver, R. L. (1980). “A cognitive model of the antecedents and consequences of satisfaction decisions.” Journal of Marketing Research, 17(4): 460–469.
Oliver, R. L, & Linda, G. (1981). “Effect of satisfaction and its antecedents on consumer preference and intention.”
Advances in Consumer Research, 8(1): 88–93.
Petter, S., Delone, W., & Mclean, E. R. (2013). “Information systems success: The quest for the independent variables.”
Journal of Management Information Systems, 29(4): 6–61.
Pitt, L. F., Watson, R. T., & Kavan, C. B. (1995). “Service Quality: A measure of information systems effectiveness.” MIS Quarterly, 19(2): 173–188.
Raymond, L., & Bergeron, F. (2008). “Project management information systems: An empirical study of their impact on project managers and project success.” International Journal of Project Management, 26(2): 213–21.
Santhanam, R., & Hartono, E. (2003). “Issues in linking information technology capability to firm performance." MIS Quarterly, 27(1): 125–153.
Shin, G. K., & Sohn, S. J. (2011). “The impact of innovation propensity and IT application ability on the adoption of the home trading system.” Korean Journal of Accounting Research, 16(1): 207–226.
Williams, L. J., Vandenberg, R. J., & Edwards, J. R. (2009). “Structural Equations Modeling in management research: A guide for improved analysis.” The Academy of Management Annals, 3(1): 543–604.
Woolfolk, A. (2012). Educational Psychology, Allyn and Bacon. Yalowitz, S. S. (2002). “Personality and motivation in visitor
satisfaction.” Visitor Studies Today, 5(1): 14–17.
Yang, Y. C., Park, C. J., Kim, J. H., & Kim, J. J. (2007). “Management of daily progress in a construction project of multiple apartment buildings.” Journal of Construction Engineering and Management, 133: 242–253.