SEISMIC STABILITY OF SATURATED REINFORCED SOIL WALLS
JIRO KUWANOi) and JUN IZAWAii)ABSTRACT
This paper studies the effect of saturation of backfill on the seismic stability of reinforced soil walls (RSWs) using centrifuge shaking table tests. For comparison, degradation of static stability and seismic stability of a RSW under unsaturated condition was also investigated. Test results showed that the RSW under saturated condition had enough static stability. However, seismic stability of saturated RSW significantly decreased as compared with that under unsaturated condition. The saturated model RSW did not collapse, though it showed large deformation. It maintained sufficient stability after shakings although a clear slip surface appeared in the backfill. Finally, it is discussed how to evaluate residual stability of RSWs damaged by earthquakes with test results and the simple evaluation method proposed by authors.
Key Words : Reinforced soil wall, Saturated, Seismic stability 1 INTRODUCTION
Many embankments and natural slopes were heavily damaged in 2004 Niigata-ken Chuetsu Earthquake probably due to high water content caused by Typhoon No. 23, which hit the shaken area a few days before the earthquake (JGS 2008). Reinforced soil walls (RSWs) were not exception and suffered large deformation, although it is well known that RSW can show very high seismic resistance. It is probably due to insufficient drainage works, which resulted in high water content in backfill. However, such damaged RSWs did not fully collapse, and maintained sufficient static stabilities. In such cases, it is necessary to evaluate residual seismic stability of the RSW and assess the necessity of repair work or reconstruction soon after the earthquake for quick recovery of infrastructures. Therefore, such assessment should be made usually based only on surface deformation, such as wall displacement or settlement at the crest without detailed investigation. This study investigated the effect of saturation in backfill of RSW on static and seismic stability of RSW with centrifuge model tests at first. Then, it is discussed how to evaluate residual seismic stability of RSW damaged by earthquake.
2 CENTRIFUGE MODEL TESTS
2.1 Model setup
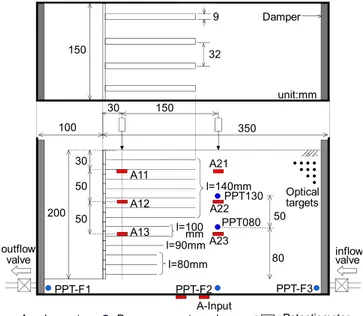
Centrifuge tests were conducted using Tokyo Tech Mark 3 Centrifuge and Horizontal-Vertical 2D shaker (Takemura et al. 2002). Figure 1 shows a schematic view of the model reinforced soil wall used in the tests.
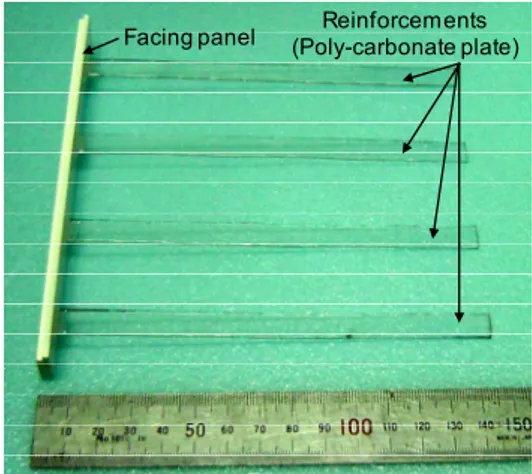
Backfill was made of dry Toyoura sand with relative density of 80%. Height of the RSW was 200 mm in model scale, which corresponded to 10 m in prototype in the operation centrifugal acceleration of 50 g. Similitude of RSW model test in centrifuge is described by Izawa and Kuwano (2010). The model RSW was reinforced with poly-carbonate plate with 0.5 mm thick and 9 mm wide, which modeled steel strip type reinforcement. The model RSW was designed based on Japanese standard (PWRC 2003). As shown in Figures 1 and 2, four reinforcements were attached to each divided facing wall panels, which was made of 3mm
Figure 1. A schematic view of a model RSW. i) Professor, Geosphere Research Institute, Saitama University, Japan.
ii) Assistant senior researcher, Earthquake and Structural Engineering, Structures Technology Division, Railway Technical Research Institute, Japan. : Accelerometer : Pore pressure transducer
100 350 30 150 30 50 50 50 80 200 A11 A12 A13 A21 A22 A23 PPT130 A-Input outflow valve PPT080 PPT-F1 PPT-F2 PPT-F3 150 32 9 unit:mm Optical targets Damper inflow valve : Potentiometer l=100 mm l=90mm l=80mm l=140mm * l: Length of reinforcements
Figure 2. Model reinforcement and a facing panel. Table 1. Properties of Toyoura sand (Dr=80%). Average particle size
uniformity coefficient Permeability
Internal frictional angle Dry unit weight Saturated unit weight Submerged unit weight
: D50 : Uc : k : φ' : γd : γsat : γ’ 0.19 mm 1.56 2.0×10⁻⁴ m/sec 41.0 degree 15.4 kN/m3 19.4 kN/m3 9.59 kN/m3 Table 2. Properties of the model reinforcements. Tensile stiffness 506.8 (kN/m) Pullout frictional angle : φp 12.9 (deg.)
thick acrylic plate. Table 1 and 2 summarize properties of Toyoura sand and model reinforcements, respectively. Frictional angle between Toyoura sand and Poly-carbonate plate was determined from the direct shear tests. Some optical targets were set in the front surface of the model in order to observe deformation in detail through the CCD-Camera. Displacement vectors and strain distributions were obtained from the displacements of the targets.
2.2 Test Procedure
Three kinds of tests, i.e. saturation test, shaking table tests for unsaturated model and saturated model, were conducted according to the test procedure shown in Table 3 using one model RSW. Details are described as follows.
2.2.1 Saturation test
This test was conducted to investigate instability of RSWs due to change in stress in backfill as a result of saturation. In this test, the water level was raised up to 20 mm above the upper surface of the RSW through the rotary joint and solenoid valve at a 50 g centrifugal acceleration. Figure 3 shows a conceptual diagram of the saturation test. Note that the front side of the RSW was also filled with water which is observed in the case of the RSW at the reservoir but not realistic in the case
Table 3. Test procedure. 1. Increase of centrifugal acceleration up to 50G 2. i) Raising the water table
decrese the water table
ii) Shaking table test for unsaturated model 3. Decrease of centrifugal acceleration up to 1G 4. Saturation of backfill at 1G
5. Increase of centrifugal acceleration up to 50G 6. Shaking table test for saturated model 7. Decrease of centrifugal acceleration up to 1G
Figure 3. Model reinforcement and a facing panel.
(a) Dry conditions
(b) Saturated conditions
Figure 4. Vertical stress distributions in the RSW. of embankment after heavy rain. Vertical stresses under dry and saturated conditions are schematically drawn in Figures 4a and b, respectively. It is thought that safety of the RSW was higher than under the real situation with unsaturated backfill because water pressure acting on the front wall provides resistance against the movement in the active direction of the RSW.
Reinforcements (Poly-carbonate plate) Facing panel Air pressure Laboratory Centrifuge rotary joint z σv’=γd×z σv’=γ’×z σv=γsat×z+γw×0.02 γw×(z+0.02) z 0.02 m
Figure 5. Time histories of input accelerations.
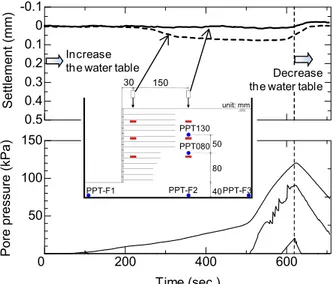
Figure 6. Time histories of settlement due to saturation. After raising the water table up to the prescribed level, water was drained away by opening the solenoid valve for outflow.
2.2.2 Shaking table test for the unsaturated model
After draining away water from the backfill, sinusoidal waves with frequency of 100 Hz were applied to the RSW at a centrifugal acceleration of 50 g. In this test, backfill of the RSW were under partly saturated condition as the water was not completely drained. Thus, shear stiffness and strength of backfill was expected to be higher than those under dry and saturated conditions. Figure 5 shows time histories of the sinusoidal waves applied to the model in the saturated test case. In the unsaturated case, only step 1~step 3 were applied. As described later, deformation of the model was little. Therefore, the same model
Figure 7. Time histories of settlement in the shaking table test with unsaturated backfill.
RSW was used in the shaking table test for the saturated model.
2.2.3 Shaking table test for the saturated model
After completing the shaking table test for the unsaturated model, centrifugal acceleration was decreased to 1 g once, and the model was filled with water in the 1 g field. Subsequently, shaking table tests were carried out under centrifugal acceleration of 50 g to know the effect of saturation on seismic stability of RSWs. Applied accelerations are indicated in Figure 5.
3 RESULTS AND DISCUSSIONS 3.1 Saturation test
Figure 6 shows time histories of settlement at the crest together with pore water pressure change at the base (PPT-F2) observed in the saturation test. Saturation of backfill led to degradation of stability of the RSW due to a decrease of effective stress. In this case, effective stress was reduced by about 38 % due to saturation, compared with dry conditions. This could cause decrease of frictional resistance between soil and reinforcement as well. However, the model RSW showed little deformation as shown in Figure 6, and maintained sufficient static stability.
3.2 Shaking table test for unsaturated model
Following the saturation test, the centrifuge shaking table test on the RSW under unsaturated condition was conducted. Time histories of settlements at the crest and input accelerations are shown in Figure 7. The settlements accumulated with shaking, but the RSW did not collapse and became stable again after shaking. In general, stiffness of soil decreases with increase in strain. However, settlement induced in step 3 was smaller than that in step 2, although almost the same input acceleration was applied to the model in both
200 400 600 50 100 150 0 Por e pre ssu re (k Pa) Time (sec.) -0.1 0 0.1 0.2 0.3 0.4 0.5 Se tt leme nt (mm ) 30 150 50 80 PPT130 PPT080 PPT-F2 PPT-F3 PPT-F1 40 unit: mm Decrease the water table Increase
the water table
-2 -1 0 S et tlem en t ( m m )
30mm from the wall
180mm from the wall
0 0.5 1 1.5 -10 0 10 A cc el era tio n (G) Time(sec) 0 0.1 0.2 0.3 0.4 0.5 -20 -10 0 10 20 Step4&5:12G 40waves Time (sec) -20 -10 0 10 20 Step3:12G 20waves -20 -10 0 10 20 A cc el era tio n (G) Step2:10G 20waves -20 -10 0 10 20 step1:5G 20waves
Figure 8. Deformation of saturated RSW after shaking.
Figure 9. Time histories of excess pore water pressure and settlement in saturated case.
steps. The possible reason is that decrease of stiffness of the backfill could be prevented by tensile stress generated in reinforcements due to deformation of the RSW.
3.3 Shaking table test for saturated model
Finally, the centrifuge shaking table test on the RSW in saturated condition was made. Figure 8 is a picture of the deformed RSW after the 5th shaking step. Time histories of excess pore water pressure ratio, ru = Δu/σv’,
are given in Figure 9, where Δu and σv’ indicate excess
pore water pressure during shaking and the initial
Figure 10. Time histories of settlement in saturated case.
Figure 11. Vertical distribution of horizontal displace- ments at the facing in saturated case.
effective vertical stress, respectively. Obviously, ru did
not reach 1.0, that is, liquefaction did not occur during shaking in all steps. However, as shown in Figure 10, which indicates the time histories of settlements at the crest together with input accelerations, very large settlements were observed in the saturated case as compared with those in the unsaturated case indicated in Figure 7. As shown in Figure 9, dynamic amplitude of ru was about 0.2, and it could lead to significant
decrease of stability of the saturated RSW.
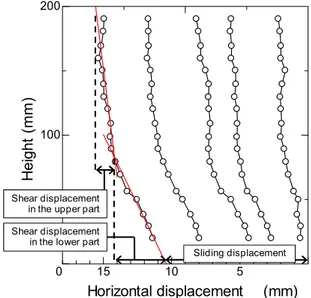
Vertical distributions of horizontal displacement of the wall are shown in Figure 11, which were obtained from the displacements of the optical targets set in the model. Horizontal displacement can be divided into three components, which are sliding displacement, shear displacements in the upper part and in the lower part, as shown in Figure 11. Each component after each shaking step is plotted in Figure 12.
Shear displacement in the upper part were smallest in all steps. Shear displacement in the lower part was -0.2 0 0.2 0.4 0.6 -10 -8 -6 -4 -2 0 Po re wa te r p re ss ure r atio : Δ u/ σ 'v Settlement :
Excess pore water pressure : 80mm 130mm from the base
step1 -0.2 0 0.2 0.4 0.6 -10 -8 -6 -4 -2 0 step2 -0.2 0 0.2 0.4 0.6 -10 -8 -6 -4 -2 0 step3 -0.2 0 0.2 0.4 0.6 -10 -8 -6 -4 -2 0 step4 0 0.1 0.2 0.3 0.4 0.5 -0.2 0 0.2 0.4 0.6 -10 -8 -6 -4 -2 0 Time (sec.) Settle m ent at 30mm distan ce from the wa ll (mm) step5 -20 -10 0 Settlem ent (mm )
30mm from the wall
180mm from the wall
0 0.5 1 1.5 -10 0 10 Acceleration (G) Time(sec) 5 10 15 100 200 0 Horizontal displacement (mm) H ei gh t (mm) Shear displacement in the upper part Shear displacement in the lower part
Figure 12. Components of horizontal displacement.
(a) After the 2nd shaking step.
(b) After the 3rd shaking step.
(c) After the 4th shaking step.
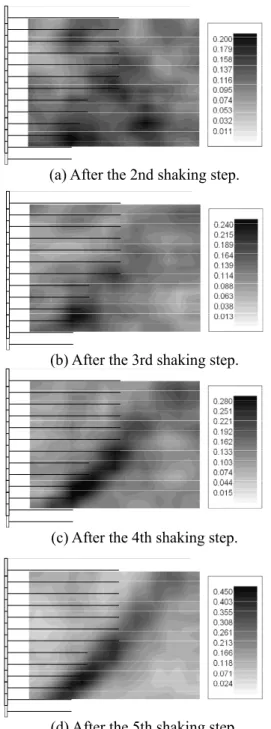
(d) After the 5th shaking step. Figure 13. Distribution of γmax in saturated case.
dominant until the 2nd shaking step, and then stayed almost constant. Horizontal displacements due to sliding became significant after the 3rd step, although these began to increase from the 2nd shaking step.
Figure 13 shows distributions of maximum shear strain, γmax, calculated from displacements of optical
targets. In these figures, concentrated area of γmax is
considered to show a slip surface. Viewed in this light, a clear slip surface can be seen in and behind the reinforced area after the 4th shaking step. However, concentration of γmax around the slip surface can be
detected also after the 2nd and the 3rd shaking step, although they are not so clear. This means that the slip surface already began to form during the 2nd shaking step. Formation of the slip surface might trigger rapid increase of sliding displacement of soil wedge above the slip surface. However, sliding displacement increased after the 2nd shaking step, as shown in Figure 12.
These test results lead us to the following summary. RSWs can maintain their sufficient static stability even if the backfill is saturated with water. Seismic stability, however, may significantly decrease, and a clear slip surface will finally appear. RSWs without a slip surface show large shear deformation especially at upper part during shaking. After formation of a slip surface, sliding displacement became dominant. That is, the deformation mode of RSWs will change due to the formation of a slip surface and deformation of RSWs may rapidly increase. Therefore, for assessment of residual seismic stability of RSWs damaged in an earthquake, it is important to decide whether a slip surface has appeared in RSWs or not.
3.4 Formation of slip surfaces
As described above, formation of a slip surface is the important factor indicating residual seismic stability of RSWs damaged in an earthquake. Authors have proposed a simple method for evaluating the formation of a slip surface in geogrid reinforced soil walls using only inclination of the facing wall (Izawa and Kuwano, 2009 and 2010), as summarized below.
Firstly, the maximum shear strain of backfill, γmax, is
calculated using the following equation.
max 2
γ
=θ
(1) where θ indicates inclination of the facing wall. This equation was originally derived by Bransby and Milligan (1975) with simple plastic theory. Note that the effect of dilatancy angle is neglected in this study because effect of that on the calculation results is very small. It is expected that backfill soil in RSWs fails and a slip surface appears when the maximum shear strain in backfill reaches its peak strength state. Thus, if the maximum shear strain calculated by the Equation 1 exceeds the peak value of backfill soils, it can be expected that a slip surface has already appeared, and0 1 2 3 4 5 6 0 5 10 Shaking step H or iz ont al di sp la ce m ent ( m m )
Shear disp. in the upper part Shear disp. in the lower part Sliding disp.
Figure 14. Results of triaxial tests on Toyoura sand.
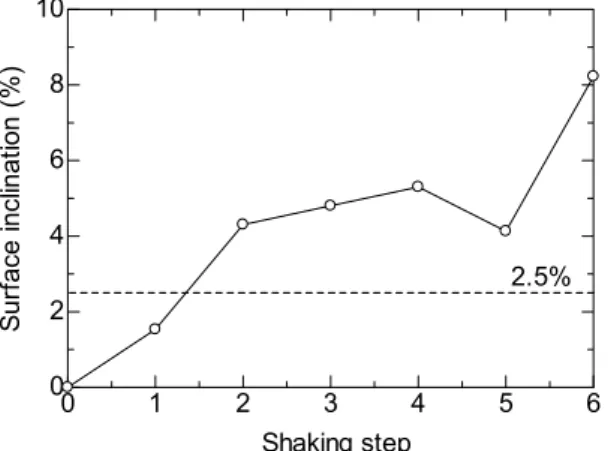
Figure 15. Facing inclination at the lower part after each shaking step.
large deformation may occur due to the coming earthquakes. Applicability of this method was confirmed with the results of centrifuge tilting and shaking table tests on geogrid reinforced soil walls having some kinds of dry backfill soils and geogrids (Izawa and Kuwano, 2009 and 2010). Applicability of this method to the RSW under saturated condition is discussed below.
Figure 14 shows relationships between deviator stress and maximum shear strain of Toyoura sand with relative density of 80%, which were obtained from drained triaxial tests under confining pressure of 49, 98 and 198 kPa. Note that the maximum shear strain was calculated. Toyoura sand develops a peak value of deviator stress at γmax = 5.10%, 6.19% and 6.36% for
confining pressures of 49, 98 and 198 kPa, respectively. In the model RSW used in this study, effective stress at the base was about 58.9 kPa under static conditions. During shaking, however, it was probably smaller due to the excess pore water pressure generated. Thus, it is considered that effective stress condition in the lower part of the model RSW was similar to those in triaxial test specimen under a confining pressure of 49 kPa, where soil fails at the maximum shear strain of 5.1 %.
Using the proposed method, the critical inclination of the facing of the model RSW is expected to be about 2.5% using Equation 1 when a slip surface appears.
Figure 15 shows inclination of the facing in the lower part of the model RSW against the shaking step. Inclination of the facing exceeded 2.5% during the 2nd shaking step. That is, it is considered that a slip surface began to form during the 2nd shaking step. This result gives good agreement with test results although a slip surface was not so clear, as shown in Figure 13a. In general, formation of a slip surface in soil is delayed under saturated conditions compared with dry conditions. This is a possible reason why a slip surface was not clear, although the backfill had already failed. This result indicates that the proposed method is applicable to RSWs in saturated conditions.
4 CONCLUSIONS
In this study, effect of saturation of backfill on the seismic stability of reinforced soil walls (RSWs) was investigated through centrifuge model tests. In addition, applicability of the proposed method for detecting the formation of a slip surface to RSWs under saturated condition was discussed. As a result, the following conclusions were obtained.
1) RSWs can maintain sufficient static stability even if the backfill is fully saturated with water. However, seismic stability may significantly decrease and very large deformation may occur.
2) Shear deformation in the lower part of RSWs is dominant if a slip surface does not appear in the backfill. After formation of a slip surface, sliding deformation becomes dominant, and displacement may increase rapidly.
3) Formation of a slip surface in RSWs can be evaluated by a simple method proposed by the authors with only inclination of the facing panel.
REFERENCES
1) Bransby, P. L. and Milligan, G. W. E. (1975): "Soil deformations near cantilever sheet pile walls", Geotechnique, Vol. 25, No. 2, pp. 175-195.
2) Izawa, J. and Kuwano, J. (2009): "Evaluation of damage in geogrid reinforced soil walls based on wall displacement",
Proc. of 17th International Conference on Soil Mechanics and Geotechnical Engineering, Alexandria, Egypt, Millpress,
pp. 1413-1416.
3) Izawa, J. and Kuwano, J. (2010): "Centrifuge modelling of geogrid reinforced soil walls subjected to pseudo-static loading", International Journal of Physical Modelling in Geotechnics, Vol. 10, No. 1, pp. 1-18.
4) Public works research center (2003): "Manual for design and construction of reinforced soil wall, 3rd edition" (in Japanese) 5) Takemura, J., Takahashi, A. and Aoki, Y. (2002):
"Development of horizontal-vertical 2D shaker in a centrifuge", Proc. of 5th International Conference on
Physical Modelling in Geotechnics, St. John’s, Canada,
Balkema. pp. 163-168. 5 10 15 200 400 600 800 0
Maximum shear strain, γmax(=ε1-ε3) (%)
D evi at or st re ss : σ 1 -σ3 (k P a) σc=49kPa σc=98kPa σc=196kPa 0 1 2 3 4 5 6 0 2 4 6 8 10 S ur face in cl in at io n (% ) Shaking step 2.5%