저작자표시 2.0 대한민국 이용자는 아래의 조건을 따르는 경우에 한하여 자유롭게 l 이 저작물을 복제, 배포, 전송, 전시, 공연 및 방송할 수 있습니다. l 이차적 저작물을 작성할 수 있습니다. l 이 저작물을 영리 목적으로 이용할 수 있습니다. 다음과 같은 조건을 따라야 합니다: l 귀하는, 이 저작물의 재이용이나 배포의 경우, 이 저작물에 적용된 이용허락조건 을 명확하게 나타내어야 합니다. l 저작권자로부터 별도의 허가를 받으면 이러한 조건들은 적용되지 않습니다. 저작권법에 따른 이용자의 권리는 위의 내용에 의하여 영향을 받지 않습니다. 이것은 이용허락규약(Legal Code)을 이해하기 쉽게 요약한 것입니다. Disclaimer 저작자표시. 귀하는 원저작자를 표시하여야 합니다.
Effects of Korean Red Ginseng against Ototoxic Drugs and
Age-related Cochleo-vestibular Dysfunction
by
Chunjie Tian
Major in Medicine
Department of Medical Sciences
The Graduate School, Ajou University
Effects of Korean Red Ginseng against Ototoxic Drugs and
Age-related Cochleo-vestibular Dysfunction
by
Chunjie Tian
A Dissertation Submitted to The Graduate School of
Ajou University in Partial Fulfillment of the Requirements
for the Degree of Ph. D. in Medicine
Supervised by
Yun-Hoon Choung, M.D., D.D.S., Ph.D.
Major in Medicine
Department of Medical Sciences
The Graduate School, Ajou University
This certifies that the dissertation
of Chunjie Tian
is approved.
SUPERVISORY COMMITTEE
Shi-Nae Park
The Graduate School, Ajou University
November, 4
th, 2014
Keehyun Park
Yun-Hoon Choung
Chul-Ho Kim
i - ABSTRACT-
Effects of Korean Red Ginseng against Ototoxic Drugs and
Age-related Cochleo-vestibular Dysfunction
Gentamicin (GM) is one of the most widely used aminoglycoside antibiotics. However, it can damage inner ear hair cells and cause both hearing loss and vestibular impairment. 3-Nitropropionic acid (3-NP), a mitochondrial toxin, has been reported to induce an acute cochlear damage. There are no therapeutic interventions have been developed for age related inner ear disorder which is one of the most common sensory deficits in the elderly. Korean red ginseng (KRG) with its ginsenosides has neuron beneficial effects and anti-ageing effects. In the present study, the authors evaluated (1) the protective effects of KRG against gentamicin (GM)-induced unilateral vestibular and hearing dysfunction and investigated its effective mechanism using in vitro cell cultures; (2) the protective effects of KRG in an ototoxic animal model BALB/c mice using 3-NP; (3) the effects of KRG on age-related hearing loss (AHL) and balance disturbance in C57BL/6 mouse.
In the first study, Sprague-Dawley rats were classified into GM group (n = 12) and KRG+GM group (n = 10). Head tilt, tail hanging, and swimming tests for balance function and auditory brainstem response test (ABR) for hearing function were performed for hearing and vestibular function evaluation. Cochleae and utricles/saccules were harvested for scanning electron microscope (SEM). The ventral otocyst-epithelial clone 36 (VOT-E36) cell was used to explore protective mechanism of Ginsenoside Rb1. In the second study, Dose-dependent toxic effects of 3-NP were investigated for an appropriate toxicity level of 3-NP, and then 23 mice were grouped into 3-NP (n = 12) and KRG + 3-NP (n = 11) groups for observation of the protective effects of KRG. ABR and cochlear morphological evaluations were performed before and after drug administration. In the third study, 22 mice were randomly distributed into control (n = 8), KRG (150 mg/kg, n = 7), and KRG (500 mg/kg, n = 7) groups. Hearing/vestibular function and related morphology were evaluation during ageing process.
ii
that ranged from 0 (normal) to 3 (worst) points, using head tilt, tail hanging, and swimming tests. The GM group showed significantly more deteriorated vestibular function (0 point – 5 rats, 1 point – 1 rat, 2 points – 3 rats, and 3 points – 3 rats) than the KRG + GM group (0 point – 9 rats and 1 point – 1 rat) (p < 0.01). The hearing thresholds were better in the KRG + GM group than in the GM group (p < 0.05). Quantitative analysis of hair cell damage in the scanning electron microscopy was closely related with vestibular and hearing functional results. In vitro study showed that ginsenoside Rb1 (gRb1) attenuated reactive oxygen species production, suppressed JNK activation, up-regulated Bcl-xL and down-regulated Bax, cytochrome c, caspase 3, and cleaved poly (ADP-ribose) polymerase in GM-treated VOT-E36 cells. In the second study, The ABR thresholds in the 800–5000 mM groups exceeded the maximum recording limit at 16 and 32 kHz 1 day after 3-NP administration. The ABR threshold in the 500 mM 3-NP + KRG group was significantly lower than that in the 500 mM 3-NP group from post 1 week to 1 month. The mean type II fibrocyte counts significantly differed between the control and 3-NP groups and between the 3-NP and 3-NP + KRG groups. Spiral ganglion cell degeneration in the 3-NP group was more severe than that in the 3-NP + KRG group. In the third study, No mice in the control and KRG1 groups died at the age of 12 month, however, 4 in 7 mice died in the KRG (500 mg/kg) group. ABR recording demonstrated high frequency hearing loss at 32 kHz (38.8 ± 5.6 dB) at 6 month of age, and 16 kHz (41.9 ± 6.0 dB) at 9 month of age, elevated to 52.2 ± 8.6 dB at 16 kHz and 55.6 ± 8.3 dB at 32 kHz at 12 month in the control group. However, the thresholds shift was delayed significantly (P < 0.05) in the KRG (150 mg/kg) group (from the age of 6 month (32.1 ± 5.7 dB) to 12 month (50.0 ± 16.6 dB) at 32 kHz, and 9 month (34.6 ± 8.2 dB) to 12 month (47.9 ± 18.1 dB) at 16 kHz). The hearing thresholds increased to 61.7 ± 20.7 dB at 16 kHz and 64.2 ± 16.9 dB at 32 kHz at 12 month in the 500 mg/kg fed mice. The age-associated vestibular dysfunction was observed with tail hanging and swimming tests, the severity score in the tail hanging test and swimming time in swimming test were significantly different between the KRG (150 mg/kg) group and the control group at 12 month (P < 0.05). Histological observation supported the hearing and vestibular function findings. The number of the Bcl-xL immunopositive SGCs and type II fibrocytes was markedly more in KRG (150 mg/kg) group than that in the control group (P < 0.05).
iii
These findings suggest that KRG including gRb1 component protects against vestibular/hearing dysfunction by inhibiting apoptotic pathways when ototoxicity is induced by unilateral intratympanic injection with GM in rats. Mice model of 3-NP-induced hearing loss exhibited a dose-dependent hearing loss with histological changes. KRG administration ameliorated the deterioration of hearing by 3-NP. C57BL/6J mouse showed early onset of hearing and vestibular dysfunction with ageing, which were delayed by KRG treatment in dose of 150 mg/kg by inhibiting mitochondrial apoptotic pathway; however, long-term treatment of 500 mg/kg KRG may induce aggressive behavior and aggravate age-related hearing and balance dysfunction.
In conclusion, Korean red ginseng might be an effective treatment for protecting hearing loss caused by various etiologies.
Key words: Korean red ginseng, Gentamicin, Ginsenoside Rb1, Hair cell, Fibrocyte,
iv
TABLE OF CONTENTS
ABSTRACT ··· i
TABLE OF CONTENTS ··· iv
LIST OF FIGURES ··· vii
LIST OF TABLES ··· ix
PART 1 Korean red ginseng protects against gentamicin-induced balance dysfunction and hearing loss in rats through antiapoptotic functions of ginsenoside Rb1 ··· 1 I. INTRODUCTION ··· 1 II. MATERIALS AND METHODS ··· 3 A. Preparation of animal study groups ... 3 B. Evaluation of vestibular function ... 5 C. Evaluation of hearing function ... 5 E. Cell culture and viability assays ... 6 F. Intracellular levels of reactive oxygen species (ROS) ... 6 G. Western blot assay ... 7 H. Statistical analysis ... 8 III. RESULTS ··· 9 A. Evaluation of vestibular/balance function ... 9 B. Otolith organ (saccule and utricle) morphology ... 13 C. Evaluation of hearing function ... 15 D. Cochlear morphology ... 15 E. gRb1 exerts a protective effect in vitro ... 17 IV. DISCUSSION ··· 23
v
V. CONCLUSION ··· 26
PART 2 Korean red ginseng ameliorates acute 3-nitropropionic acid-induced cochlear damage in mice ··· 27 I. INTRODUCTION ··· 27 II. MATERIALS AND METHODS ··· 30 A. Animals ... 30 B. Korean red ginseng ... 30 C. Study design ... 30 D. Intratympanic administration of 3-NP ... 31 E. Auditory brainstem response (ABR) measurement ... 31 F. Morphological evaluation ... 32 G. Statistical analysis ... 33 Ш. RESULTS ··· 34 A. 3-NP dose-dependent hearing threshold shift ... 34 B. Histological analysis after 3-NP administration ... 36 C. Protective effects of KRG on 3-NP-induced hearing threshold shift ... 40 D. Histological analysis after KRG treatment ... 42 IV. DISCUSSION ··· 48 V. CONCLUSION ··· 54
PART 3 Korean red ginseng delays age-related hearing loss and vestibular dysfunction in C57BL/6 mouse ··· 55 I. INTRODUCTION ··· 55
vi
II. MATERIALS AND METHODS ··· 58 A.Study design ... 58 B. Auditory and vestibular function assessment. ... 58 C. Morphological evaluation of hair cells... 59 D. Immunohistochemistry ... 59 E. Statistical analysis ... 59 III. RESULTS ··· 60 A. Mortality ... 60 B. KRG’s effect on age related hearing loss in C57BL/6J mouse ... 62 C. KRG’s effect on age related balance dysfunction ... 66 D. Detection of Bcl-xL and cytochrome c expression ... 70 IV. DISCUSSION ··· 72 V. CONCLUSION ··· 75
vii
LIST OF FIGURES
Part 1
FIG. 1. EVALUATION OF VESTIBULAR FUNCTION ... 11 FIG. 2. SCANNING ELECTRON MICROGRAPHS OF SACCULAR MACULAE AND
UTRICULAR MACULAE. ... 14 FIG. 3. FUNCTIONAL AND MORPHOLOGICAL MANIFESTATIONS OF THE INDUCED
HEARING LOSS. ... 16 FIG. 4. CELL VIABILITY. ... 18 FIG. 5. MEASUREMENT OF INTRACELLULAR ROS PRODUCTION. ... 20 FIG. 6. THE EFFECT OF GRB1 ON GM-INDUCED APOPTOSIS... 22
Part 2
FIG. 1. AUDITORY BRAINSTEM RESPONSE ... 35 FIG. 2. CONFOCAL MICROSCOPIC IMAGES ... 37 FIG. 3. LIGHT MICROSCOPIC IMAGES OF LATERAL WALLS ... 38 FIG. 4. LIGHT MICROSCOPIC IMAGES OF SPIRAL GANGLION CELLS ... 39 FIG. 5. CHANGES IN MEAN AUDITORY BRAINSTEM RESPONSE ... 41 FIG. 6. CONFOCAL MICROSCOPIC IMAGES OF THE ORGAN OF CORTI ... 43 FIG. 7. CELLULAR CHANGES IN THE COCHLEAR LATERAL WALLS... 45 FIG. 8. CELLULAR CHANGES IN THE SPIRAL GANGLION ... 47
Part 3
viii
FIG. 2. ASSESSMENT OF AGE-RELATED AUDITORY DYSFUNCTION. ... 63 FIG. 3. MORPHOLOGICAL CHANGES IN COCHLEAR. ... 65 FIG. 4. BALANCE FUNCTION EVALUATION. ... 67 FIG. 5. EVALUATION FOR HCS IN UTRICLE AND SACCULE. ... 68 FIG. 6. AGE-RELATED HAIR CELLS LOSS IN THE CRISTA AMPULLARIS ... 69 FIG. 7. EXPRESSION OF BCL-XL AND CYTOCHROM C ... 71
ix
LIST OF TABLES
TABLE 1. GINSENOSIDE COMPONENTS OF THE KOREAN RED GINSENG ... 4 TABLE 2. COMPREHENSIVE EVALUATION OF BALANCE IMPAIRMENT ... 12
1 PART 1
Korean red ginseng protects against gentamicin-induced balance
dysfunction and hearing loss in rats through antiapoptotic functions
of ginsenoside Rb1
I. INTRODUCTION
Aminoglycoside antibiotics were first introduced into clinical practice in the 1940s and have proved highly effective in the treatment of gram-negative infections such as tuberculosis (Warchol, 2010). Gentamicin (GM) is renowned for its effect against a wide variety of pathogens, including gram-negative organisms and methicillin-resistant staphylococci. Because of its specificity, availability, and low cost, GM is the aminoglycoside antibiotic used most commonly to treat gram-negative infections (Black et al., 2004). The ototoxic effects of aminoglycosides became evident shortly after their introduction into practice. The drug induced permanent hearing loss and/or vestibular deficits in numerous individuals. The reported incidence of hearing loss ranges from a few percent up to 33%. Vestibular toxicity occurs in about 15% of patients treated with aminoglycosides (Chen et al., 2007). Subsequent histological studies revealed that the administration of aminoglycosides can destroy sensory hair cells (Warchol, 2010). Aminoglycoside-induced hearing loss begins at high frequencies and is related to the progressive and irreversible damage of outer hair cells (OHCs) in the cochlea (Choung et al., 2009). A level of vestibulotoxicity that is sufficient to damage the vestibular sensory neuroepitheliums induces a whirling sensation and/or disequilibrium in affected patients (Rybak et al., 2006). This loss of vestibular hair cells represents a common cause of balance dysfunction (Staecker et al., 2007). Ginseng, the root of Panax ginseng C.A. Meyer (Aralianceae), has been used in herbal medicines for 2000 years. Ginseng root is widely prescribed in Asia for the treatment of numerous ailments. Recent accumulating evidence has shown that treatment with ginseng saponins, which are active ingredients isolated from Panax ginseng, inhibit the increase of intracellular Ca2+ (Rhim et al., 2002). The protective
2
effects of ginseng saponins against 3-nitropropionic acid (3-NP)-induced neurotoxicity in vivo manifests at the molecular level as the inhibition of 3-NP-induced increases of intracellular Ca2+, which reduces the compound’s cytotoxicity in striatal neurons. This maintenance of homeostatic intracellular Ca2+ levels could be the basis for protection against excitatory amino acid- or neurotoxin-induced neuronal cell damage (Kim et al., 2005). Ginsenoside Rb1 (gRb1) deregulates Bcl-xL expression, which is known to suppress procaspase-9 activation by forming a complex with Apaf-1. This, in turn, prevents the release of cytochrome c from mitochondria, thereby maintaining cell viability and cell survival (Zhang et al., 2006). Post ischemic administration of gRb1 may suppress apoptotic cell death in spiral ganglion cells by activating the Bcl-xL signaling pathway, and minimize injury resulting from cochlear ischemic. Therefore, gRb1 may be effective for treating sensorineural hearing loss that eventually follows transient ischemia of the cochlea (Fujita et al., 2007). Choung et al. (2011) demonstrated that Korean red ginseng (KRG) was effective in protecting against GM-induced hearing loss in rats (Choung et al., 2011). The effect of KRG treatment on vestibular dysfunction was not investigated because the animal models with intraperitoneal injection of GM did not exhibit any signs of vestibular dysfunction. We therefore induced unilateral vestibular dysfunction with intratympanic injection (ITI) of GM and evaluated the protective effect of KRG in rats. The active component of KRG and its mechanism was identified through in vitro experiments.
3
II. MATERIALS AND METHODS
The Ajou University School of Medicine – Institutional Animal Care and Use Committee approved the surgical procedures in accordance with the guidelines regarding the care and use of animals for experimental procedures (AUSM-IACUC). All efforts were made to minimize animal suffering as well as the number of animals. Twenty-two female Sprague– Dawley rats (8 weeks, 200–250 g) were housed in a temperature-controlled (23 ± 2 ℃) room with a 12 h light/dark cycle. The rats were provided with free access to standard laboratory food and tap water. They were allowed to acclimatize to their cages for at least 72 h after shipment.
A. Preparation of animal study groups
Twenty-two rats were divided into 2 groups, a GM only-treated group (GM) (12 rats) and a KRG plus GM-treated group (KRG + GM) (10 rats). Rats were intraperitoneally anesthetized with Zoletil 50 (Virbac Laboratoires, Carros, France) 0.1 cc/100 g and Rompun 2% (Bayer Korea, Ansan, Korea) 0.02 cc/100 g. KRG containing ginsenosides (Table 1) was provided from the Korea Ginseng Center (KGC@, Korea) and administrated orally (dissolved in tap water; 500 mg/kg; 1.5 ml/rat; once per day for 3 weeks including 1 week for pre-treatment) in the KRG + GM group. Both groups received ITI of GM in the left ear every other day for 2 weeks. The contralateral ears were used as controls. Under an operating microscope, GM (500 mg/ml) was slowly administered through the anterosuperior quadrant of the left tympanic membrane to fill the middle ear cavity (approximately 20 μl/rat). The rats were maintained in the same position with the left ear up for >30 min. Before, during, and after drug administration, the rats were carefully observed for any behavioral abnormalities. A complete battery of tests to assess hearing loss and vestibular toxicity was undertaken two days before and on days 1, 8, 15, 22, and 30 after drug administration. After day 30, all rats were sacrificed, and the cochlea, utricles, and saccules were harvested for morphological evaluation.
4 Table 1. Ginsenoside components of the Korean Red Ginseng
This 100% powderized ginsenosides comprise the roots (70%) and hair roots (30%) of ginseng at 6 years of plant age.
Ginsenoside components Rb1 Rg1 Rc Re Rb2 Rf Rh1 Rg2(s) Rg2(r) Rd Rg3(s) Rg3(r) Total
Content (mg/g) Component ratio (%) 5.16 (31.1) 2.89 (17.4) 2.22 (13.4) 2.16 (13.0) 1.82 (11.0) 0.93 (5.6) 0.13 (0.8) 0.37 (2.2) 0.21 (1.3) 0.47 (2.8) 0.14 (0.8) 0.08 (0.5) 16.58 (100)
5 B. Evaluation of vestibular function
Head tilt test: Rats were placed in a black plastic channel with its roof open. Pictures were taken when the rat’s head and body were aligned. The tilt angle from the vertical plane to the sagittal plane of the head was quantified with a protractor. The head tilt was performed six times; one time before and five times after drug administration on days 1, 8, 15, 22, and 30. Tail hanging test: The rat was lifted by the tail and kept hanging at a height of 30 cm. The number of head rotations was counted at 10 s intervals. This test was performed just after the head tilt test. Swimming test: Each rat was tested just after the tail hanging test. A stainless steel pool (length, 28 cm; width, 45 cm; depth, 25 cm) was filled with body-temperature water at a depth of 19 cm. A rat was lifted by its tail and dropped into the center of the pool from a height of 20 cm. The time in seconds between the rat’s contact with the water and climbing up to the top of the platform was noted by an independent observer.
C. Evaluation of hearing function
The auditory brainstem response (ABR) was tested with the Biosig 32 system (Tucker-Davis Technologies, Gainesville, FL, USA) as previously described (Choung et al., 2011). The threshold was defined as the lowest intensity level at which a clear waveform was visible in the evoked trace and was determined by visual inspection of the responses.
D. Morphological evaluation
Rats were decapitated quickly after being anesthetized, and the temporal bones were dissected out. The perilymphatic space was perfused with 4% gluteraldehyde. Each specimen was then placed in the same gluteraldehyde solution overnight. After rinsing 3 times with phosphate-buffered saline (PBS), the specimen was perfused with 1% osmium tetroxide and placed on a tissue rotator for 15 min. The bony capsule of the cochlea was then carefully removed after rinsing with PBS; the lateral wall was cut away to reveal the organ of Corti. The otolith was carefully removed to reveal hair cells on the saccule/utricle macula. Samples were serially dehydrated in 50%, 70%, 90%, 95%, and 100% acetone. Each specimen was exposed to hexamethyldisilazane and allowed to air dry, then placed on a stub for gold-sputter coating. Photographs were taken with a JSM-5410 LV SEM camera (Jeol, Tokyo,
6
Japan). The number of hair cells in the organ of Corti was analyzed in 2 different representative areas of the middle and basal turns corresponding to 16 and 32 kHz, respectively (Choung et al., 2011).
E. Cell culture and viability assays
The ventral otocyst-epithelial clone 36 (VOT-E36) cell line represents epithelial progenitors with potential to differentiate into sensory and non-sensory epithelial cells and express a number of specific molecular markers for hair cells (Liu et al., 2006). The cells were maintained in Dulbecco’s Modified Eagle’s Medium with 10% fetal bovine serum at 33℃ in a CO2 incubator. The cells (3000 cells/well in a 96-well plate) were incubated with 2 mM GM for 0, 24, 48, and 72 h. The timedependent effects were measured using 3-(4,5-dimethylthiazol-2-yl)-5-(3-carboxymethoxyphenyl)-2-(4-sulfophenyl)-2H-tetrazolium, inner salt (MTS) assay (Promega, Madison, WI, USA). GRb1 (Ambo Institute, Seoul, Korea) was dissolved in methanol (Merck KGaA, Darmstadt, Germany) to yield a 50 mM stock solution. To test the effects of gRb1 on cell viability and GM-mediated cytotoxicity, cells were treated with different concentrations of gRb1 (2.5, 5.0, 10, 20 μM) for 48 h. The cells were pretreated with gRb1 for 2 h and exposed to GM (2 mM) for 48 h, respectively. A 20 μl aliquot of MTS solution was added to 100 μl of medium, after which the cells were incubated for 4 h at 33 ℃ in 10% CO2. The absorbance of formazan at 490 nm was measured directly from the 96-well assay plates using a microplate reader (Model 680, Bio-Rad, Tokyo, Japan). All experiments were repeated 3 times.
F. Intracellular levels of reactive oxygen species (ROS)
Intracellular ROS levels were measured using a Total ROS Detection kit (Enzo Life Sciences, Plymouth Meeting PA, USA). After cell culture and treatment with GM in the presence or absence of gRb1 in 12-well plates on cover slips, the cells were loaded with ROS Detection solution and incubated for 1 h. After washing with 1× wash buffer, the samples were immediately observed under a confocal microscope (LSM710, Carl Zeiss, Jena, Germany). The cells were cultured and treated with GM in the presence or absence of gRb1 in 6-well plates for the quantitative flow cytometry analysis. Media were removed, and the cells were
7
washed twice with 1× wash buffer. The cells were detached with trypsin and centrifuged for 5 min at 400 g at room temperature. The supernatant was discarded, and the cell pellet was resuspended in 500 μl of ROS detection solution. The cells were stained for 30 min at 33 ℃ in the dark and analyzed by flow cytometry using a FACSAria™III device (BD Biosciences). The experiments were repeated 3 times.
G. Western blot assay
Western blots were performed to evaluate the involvement of the cell apoptotic pathway. The following primary antibodies were purchased from Cell Signaling Technology (Danvers, MA, USA): a-tubulin, poly-ADP-ribose polymerase (PARP), Bcl-xL, BAX, cytochrome c, caspase 3, and JNK. The treated cells were washed twice with PBS and then lysed in cold RIPA lysis buffer (Biosesang) by adding Xpert Protease Inhibitor Cocktail Solution (100) (GenDEPOT, Seoul, Korea). The reaction was allowed to proceed for 30 min on ice. The homogenates were centrifuged at 13,000 rpm for 30 min at 4 ℃, and the supernatant fraction was collected for further analysis. Protein concentrations were measured using the DC Protein Assay (Bio-Rad, Hercules, CA, USA). Samples containing protein (45 μg, 80 μg for caspase 3) were immediately heated for 10 min at 100 ℃, and then separated by sodium dodecyl sulfate–polyacrylamide gel electrophoresis. After electrophoresis, the proteins were transferred to a polyvinylidene fluoride membrane. The membranes were blocked with 5% skim milk in PBS containing 0.05% Tween (PBS-T) and subsequently incubated with primary polyclonal antibodies at a final dilution of 1:1000 at 4 ℃ overnight. After three washes in PBS-T, the membranes were incubated with peroxidase-conjugated secondary antibody (final dilution, 1:2000) in PBS-T at room temperature for 1 h. After washing the membranes, the protein bands were visualized using enhanced chemiluminescence on X-ray film according to the manufacturer’s instructions (West-Q Chemiluminescent Substrate kit, GenDEPOT). Band intensity was measured using NIH ImageJ software (National Institutes of Health, Bethesda, MD, USA). The experiments were repeated 3 times for statistical analysis.
8 H. Statistical analysis
All the data were presented as mean ± standard deviation (SD). The statistical analysis was carried out using the SPSS 12.0 statistical software package for Windows (SPSS, Inc., Chicago, IL, USA). Statistical analysis was performed with Mann-Whitney test or Fisher’s Exact Test to determine the significance. A p ≤ 0.05 was considered as statistically significant.
9 III. RESULTS
A. Evaluation of vestibular/balance function
In the head tilt test, the onset of head tilt (Fig. 1A) was observed around days 1 and 2 just after the seventh ITI of GM only in the GM group (7 of 12), not in the KRG + GM group. Four rats showed severe head tilt > 40°, and three rats showed tilts of <40°. The difference between groups was statistically significant (p < 0.05, Fig. 1C). The average degree of head tilt with time is shown in Fig. 1B. The differences between the groups were statistically significant (p < 0.05 at post-treatment days (P) 1, 8, 15, 22 and 30, respectively). In the tail hanging test, 4 of 12 rats in the GM group showed uncontrollable head turning, but no head turning was observed in the KRG + GM group. The difference between groups was not statistically significant (p > 0.05, Fig. 1F). The number of head-turns was significantly different at P8 and P15 (p < 0.05, Fig. 1E).
In the swimming test, the average swimming time for all 22 animals was 7.0 ± 5.0 s before drug administration. Rats with an average swimming time >12.0 s (mean + 1 SD) were considered as abnormal. Each rat, which could not get to the platform because of a severe balance deficit, was observed for 5 min. Swimming time was prolonged for 5 rats (41.7%) in the GM group but only one rat (10%) in the KRG + GM group (Fig. 1I). Among the five abnormal rats in the GM group, two exhibited swimming disabilities. The GM alone-treated animals had average swimming times of 61 ± 113.4 s, 57 ± 113.6 s, 57.5 ± 113.7 s, 32.2 ± 81.0 s, and 29.3 ± 85.3 s at post-treatment days 1, 8, 15, 22, and 30, respectively. In contrast, the KRG + GM group had times of 8.1 ± 6.5 s, 7.3 ± 8.9 s, 8.3 ± 6.4 s, 7.3 ± 6.5 s, and 6.1 ± 3.5 s (Fig. 1H). No significant difference in average swimming time was observed between the groups.
We performed a comprehensive evaluation of balance function by awarding one point each for failure on the head tilt test, tail hanging test and swimming test (Table 2). In the GM group, 5 rats earned zero points, 1 rat earned 1 point, 3 rats earned 2 points, and 3 rats earned 3 points. In the KRG + GM group, 9 rats earned 0 points and 1 rat earned 1 point. The
10
difference was statistically significant (p < 0.01). Since rat rated ≥ 1 point indicate the occurrence of balance impairment, the incidence of GM-induced balance impairment in the GM group was 7/12, and 1/10 in the KRG + GM group. The difference was statistically significant (p < 0.05).
11 Fig. 1. Evaluation of vestibular function
The head tilt (A) was observed in the head tilt test. The differences of the average degrees of the head tilt with time between GM and KRG + GM groups were statistically significant (B), and the difference of the incidences between two groups was significant (C). Head turning was observed in the tail hanging test (D). The number of head-turns and incidence were shown in E and F, respectively. The abnormal swimming was detected in the swimming test (G). The time and incidence of the abnormal swimming were shown in H and I, respectively. *p < 0.05.
12 Table 2. Comprehensive evaluation of balance impairment
Each rat’s behavioral change in head tilt, tail hanging and swimming test was given 1 point. Scores show the total points of the individual rat. Vestibular GM KRG + GM Function Tests R1 R2 R3 R4 R5 R6 R7 R8 R9 R10 R11 R12 R1 R2 R3 R4 R5 R6 R7 R8 R9 R10 Head Tilt 1 0 1 1 1 0 0 0 1 1 0 1 0 0 0 0 0 0 0 0 0 0 Tail Hanging 1 0 1 0 1 0 0 0 0 0 0 1 0 0 0 0 0 0 0 0 0 0 Swimming 1 0 1 0 1 0 0 0 1 1 0 0 1 0 0 0 0 0 0 0 0 0 Scores 3 0 3 1 3 0 0 0 2 2 0 2 1 0 0 0 0 0 0 0 0 0
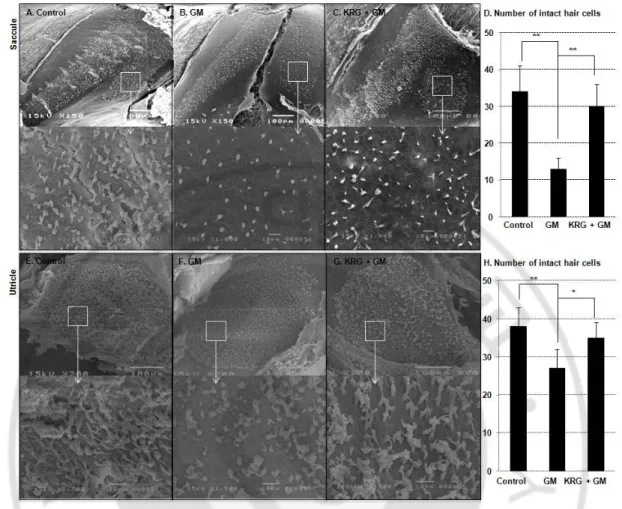
13 B. Otolith organ (saccule and utricle) morphology
The saccules and utricles in the GM group had an extremely reduced number of hair cells, which exhibited an uneven distribution and abnormal appearance (Fig. 2B and F) compared to those in the control ears (Fig. 2A and E). Hair cells in the KRG + GM group were well preserved in a high density of stereocilia with normal morphology (Fig. 2C and G). Five unit areas were chosen in a saccule macula and utricle macula of the control ear, GM treated ear, and KRG + GM treated ear, respectively. Hair cells were counted in each unit area. Quantitative analysis showed that the number of intact hair cells in the saccules was 34 ± 7 in the control group, 13 ± 3 in the GM group, and 30 ± 6 in the KRG + GM group (Fig. 2D). With respect to the utricles, the number of intact hair cells in the control group, GM group, and the KRG + GM group was 38 ± 5, 27 ± 5, and 35 ± 4, respectively (Fig. 2H). The hair cells in the saccule and utricle of the KRG + GM group were well preserved with their hair cell number significant more than that in the GM group (p < 0.01 and p < 0.05, respectively).
14
Fig. 2. Scanning electron micrographs of saccular maculae and utricular maculae.
The number of stereocilia in hair cells in the GM group (B and F) was extremely reduced in comparison to the numbers observed in normal controls (A and E). However, the KRG + GM groups (C and G) had dense, well-preserved stereocilia. The differences in hair cell number are depicted in panels D and H. *p < 0.05; **p < 0.01. Scale bars = 100 µm and 10 µm.
15 C. Evaluation of hearing function
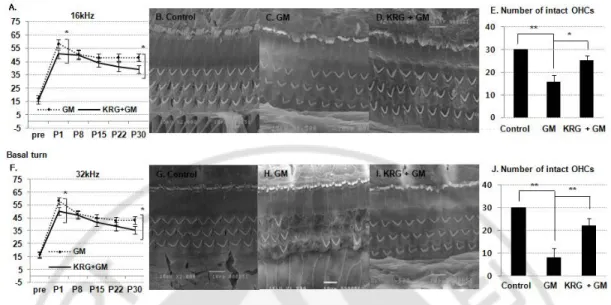
There was no change in hearing thresholds in the control side (right) ears in both the GM and KRG + GM groups (data not shown). The average hearing threshold at 16 kHz/32 kHz in pre-treatment ears in the GM and the KRG + GM groups was 17.1 ± 4.5 dB/ 16.7 ± 4.9 dB and 15.5 ± 5.0 dB/16.0 ± 5.2 dB, respectively. On the first day after drug treatment, marked hearing loss was noted in GM-treated ears at 16 kHz and 32 kHz in the GM and KRG + GM treated ears (Fig. 3). The ABR threshold at 16 and 32 kHz was 58.3 ± 5.8 dB/58.3 ± 9.8 dB in the GM group and 50.5 ± 10.1 dB/ 50.0 ± 8.8 dB in the KRG + GM group (p < 0.05). As shown in Fig. 3, from days 1–30, the hearing thresholds at 16 kHz and 32 kHz recovered significantly in both groups. On day 30, the ABR threshold at 16 and 32 kHz was 43.3 ± 8.3 dB/47.9 ± 7.5 dB in the GM group and 35.5 ± 9.0 dB/39.0 ± 9.7 dB in the KRG + GM group. There were significant differences between the groups (p < 0.05).
D. Cochlear morphology
SEM was used to determine that all hair bundles in the middle turns (16 kHz) and basal turns (32 kHz) of the control ears remained structurally unaffected (Fig. 3B and G). Each hair bundle was comprised of well-integrated stereocilia. In the GM group (Fig. 3C and H), the number of hair cell bundles and stereocilia within a bundle was extremely reduced (particularly for OHCs in basal turns), but relatively intact IHCs were evident. In contrast, in the KRG + GM group (Fig. 3D and I), the outer and inner hair cells in middle turns had stereocilia that were nearly intact and of a density similar to that observed in normal cells. Only a few stereocilia were lost in OHCs of basal turns, and the hair bundles were well shaped. The difference between the GM and KRG + GM groups in the number of hair cells was statistically significant at both 16 kHz (p < 0.05) and at 32 kHz (p < 0.01). The hair cell damage in the basal turn was more severe than that observed in the middle turn.
16
Fig. 3. Functional and morphological manifestations of the induced hearing loss.
Hearing thresholds (dB) were measured at 16 kHz (A) and 32 kHz (F) before and after (P1, P8, P15, P22 and P30) drug administration. Scanning electron micrographs of the organ of Corti obtained at 16 kHz (B–D) and 32 kHz (G–I). The number of the outer hair cells hair bundles and stereocilia within a bundle was extremely reduced in the GM group (C and H) and almost intact in the KRG + GM group (D and I). A statistical difference in the number of intact outer hair cells (OHC) was observed upon comparison of the GM and KRG + GM groups (E and J). *p < 0.05; **p < 0.01. Scale bars = 10 µm.
17 E. gRb1 exerts a protective effect in vitro
Cell viability test: GM decreased cell viability in a time-dependent manner as shown in Fig. 4A. 2 mM GM administered for 48 h was chosen for the following studies. The cells were exposed to 2 mM GM in the absence or presence of gRb1 for 48 h. Viability increased slightly in gRb1 (10 µM)-treated cells (111.2%) (Fig. 4B) and decreased in the GM-treated cells (78.9%). However, when the cells were exposed to GM (2 mM) with gRb1 (10 µM) including gRb1 pretreatment for 2 h, cell viability was 94.3%, which was significantly different from the level observed in GM-treated cells (p < 0.05) (Fig. 4C). Cell viability was similar in control cells incubated in medium containing the gRb1 vehicle, 2 µM methanol (data not shown).
18 Fig. 4. Cell viability.
(A) GM-induced VOT-E36 cell toxicity. (B) dependent effect of gRb1. (C) Dose-dependent effect of gRb1 on GM-induced toxicity. *p < 0.05.
19
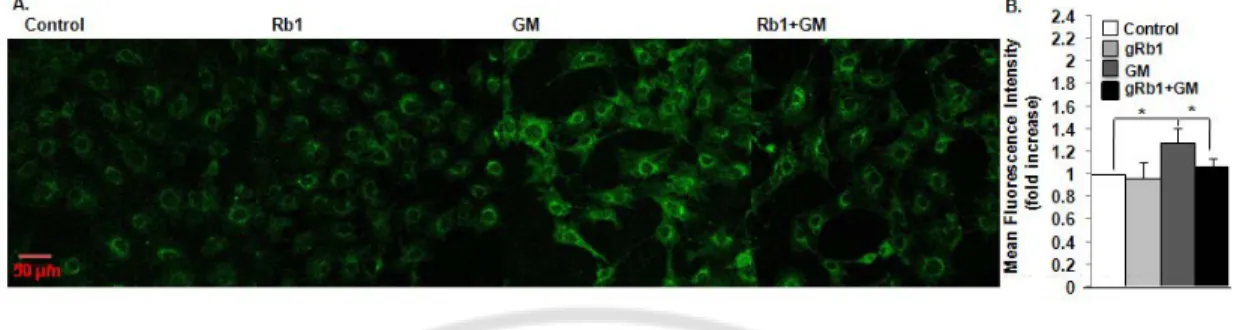
ROS generation: GM induced an increase in ROS production but not when cells were exposed to GM after pretreatment with gRb1 (Fig. 5A). Flow cytometry analysis was performed to quantify the level of intracellular ROS generation (Fig. 5B). The difference between the normal control and the GM only treated-group was significant (p < 0.05). However, pretreatment with gRb1 significantly attenuated GM-induced ROS production in gRb1 + GM treated cells than the GM-only treated cells (p < 0.05).
20
Fig. 5. Measurement of intracellular ROS production.
(A) A higher density of green florescence was observed in the GM group as compared to the gRb1-treated cells. (B) Flow cytometry revealed significant difference between the gRb1 + GM and gRb1 groups. *p < 0.05. Scale bars = 10 µm.
21
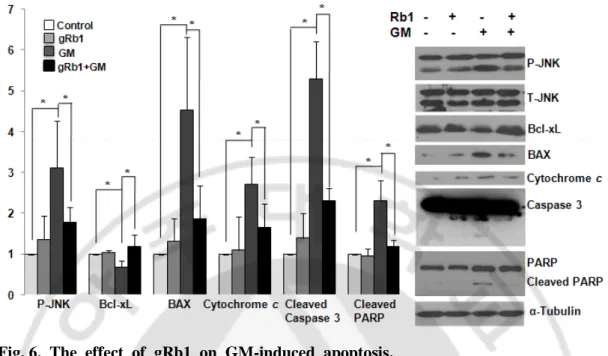
Western blot: Western blot analysis was performed to elucidate the mechanism underlying the protective effects of gRb1 in VOT-E36 cells. A representative western blot is shown in Fig. 6. GM-induced JNK activation was significantly suppressed in gRb1-treated cells (p < 0.05); gRb1 deregulated the expression of Bcl-xL and down-regulated BAX expression (p < 0.05). This, in turn, prevented the release of cytochrome c from mitochondria and therefore reduced caspase 3 activation (p < 0.05). This chain of events maintained cell viability, as represented by reduced levels of cleaved PARP (p < 0.05).
22
Fig. 6. The effect of gRb1 on GM-induced apoptosis.
Representative western blots are shown on the right. Each ratio indicates the level of phosphor-protein (after normalization to a-tubulin levels) in comparison to the control. *p < 0.05.
23 IV. DISCUSSION
Vestibular hair cell function is necessary to convert head acceleration into a neural discharge. The loss of these hair cells results in changes in the horizontal vestibulo-ocular reflex (VOR) response (Rauch, 2001). Central compensation after a unilateral fixed vestibular loss can result in the partial recovery of VOR gain. Bilateral vestibular loss results in permanent chronic balance dysfunction and oscillopsia. Fifteen percent of patients taking GM show vestibular toxicity (Chen et al., 2007). However, the rate of occurrence may be even higher due to spontaneous compensation. To date, there are no effective prosthetic devices such as hearing aids or cochlear implants to treat patients who have vestibular dysfunction (Wall et al., 2002). Therefore, precautions against vestibular hair cell loss are an important issue.
In a previous study, we found that KRG protects against GM-induced hearing loss and hair cell death (Choung et al., 2011). However, no significant difference in walking ability was observed in treated animals. The systemic administration of low-dose GM might not induce detectable vestibular function impairments. Alternately, rats with bilateral vestibular dysfunction may nonetheless be able to walk relatively well on the rotarod treadmill used for testing. To solve these problems, ITI (500 mg/ml) of GM was performed to induce unilateral vestibular dysfunction and to explore the protective effects of KRG. In the present study, symptoms of vestibular dysfunction including head tilt, head rotation, and swimming dysfunction were observed in the GM group. Head tilt is the most sensitive of the four tests for the evaluation of vestibular function, because it directly reflects the ocular compensation to vestibular dysfunction. Head tilt was the most sensitive sign with the highest incidence rate. Head tilts were observed 1–2 days after seventh GM dose. A tilt angle of < 20° can be recovered slightly or completely within 1 month, but only one in four severe tilts (> 40°) recovered by 5° within 1 month. Rats in the KRG + GM group showed normal performance in the vestibular functional tests with only one rats had prolonged swimming time in the swimming test. Consistently, these behavioral findings were supported by the morphological results. KRG may be a promising agent that has significant potential for protection against
24
GM-induced toxicity in vestibular structures, and to our knowledge, the current study is the first time to explore KRG’s effects on GM-induce vestibular dysfunction. Aminoglycosides enter into the OHCs through the mechanoelectrical transducer channels and form an aminoglycoside-iron complex that reacts with electron donors, such as arachidonic acid to form ROS such as superoxide, hydroxyl radical, and hydrogen peroxide. ROS then activate c-Jun-NH2-terminal kinase, which translocates to the nucleus to activate genes in the cell death pathway. These genes then translocate to the mitochondria, causing the release of cytochrome c, which triggers apoptosis via caspases. Cell death may also result from caspase-independent mechanisms (Rybak and Ramkumar, 2007). The demonstration that hair cell death occurs via an active, multistep cellular process raised the possibility of blocking the progression of this pathway, thus rescuing hair cells from ototoxic injury. Iron-chelators lead to a dramatic reduction in aminoglycoside ototoxicity without interfering with aminoglycoside therapeutic efficacy (Rauch, 2001). Chen et al. (2007) showed that aspirin attenuates GM ototoxicity in double-blind trials (Chen et al., 2007). Antioxidants and antioxidant gene therapy also protect against aminoglycoside ototoxicity in experimental animals (Kawamoto et al., 2004; Lesniak et al., 2005). Delivery of the math1 gene results in the generation of vestibular hair cells in vitro after aminoglycoside-mediated hair cell loss (Staecker et al., 2007). CEP-11004 prevented hair cells death by inhibiting the neomycin-induced phosphorylation of JNK through the direct inhibition of JNK signaling (Sugahara et al., 2006). In the current study, KRG protected against GM-induced hearing loss. Ginseng root has two major classes of ingredients: saponin and nonsaponin components. The saponins are classified into three major groups according to their chemical structures: protopanaxadiol, protopanaxatriol, and oleanolic acid. Ginsenoside Rb1, ginsenoside Rg1, and ginsenoside Ro are representative substances (Shibata et al., 1994). GRb1 has been reported to have numerous biological effects. In H2O2-exposed cardiomyocytes,
pretreatment with gRb1 for 2 h and concurrent treatment with H2O2 for 2 h resulted in a
dose-dependent reduction in cell death. This cardioprotective effect of gRb1 was associated with attenuated intracellular ROS generation and therefore the preservation of mitochondrial membrane potential. Furthermore, the increased p-JNK levels in H2O2-exposed cells were
25
inhibited JNK activation in a mouse model of 2,4,6-trinitrobenzene sulfuric acid (TNBS)-induced colitis (Joh et al., 2011). The neuroprotective effect of gRb1 on cerebral ischemia– reperfusion injury is related to the inhibition of neuronal apoptosis increased the expression of Bcl-2, and reduced the expression of Bax (Yang et al., 2008). In the previous study, Rb1 and gRb2 showed definite protective effects against GM-induced apoptosis, more prominent than gRg1 and gRe (Choung et al., 2011). Since gRb1 has been reported to have numerous biological effects, the current in vitro study sought to explore the roles of gRb1 in signaling pathways regulating GM-induced apoptosis in VOT-E36 cells. Consistent with these published data, gRb1 attenuated ROS production, reduced JNK activation, up-regulated the expression of Bcl-xL, and down-regulated Bax levels. This in turn resulted in reduced levels of cytochrome c, cleaved caspase 3, and cleaved PARP. gRb1 may be an active component that protects against GM-induced vestibular and hearing dysfunction via anti-apoptotic effects. However KRG contains various ginsenoside components as shown in table 1. Ginsenoside Rg3 is one of ginsenosides that are the well-known bioactive principles of Panax ginseng. It is reported that 20(S)-Rg3, as one of the major stereoisomeric form of ginsenoside Rg3, is capable of suppressing the nitric oxide (NO), reactive oxygen species (ROS) and prostaglandin E2 (PGE2) productions induced by lipopolysaccharide (LPS) in RAW264.7 macrophage cells in a concentration-dependent manner (Shin et al., 2013). Rd has a significant neuroprotective effect on rats insulted by Ab1–40 by anti-inflammation, anti-oxidation and anti-apoptotic (Liu et al., 2012). In the central nervous system, ginsenoside has been reported to be effective in decreasing ROS formation in cultured astrocytes (Lopez et al., 2007). Consistently, a study has demonstrated that ginsenoside Rd can protect PC12 cells from H2O2-induced oxidative stress (Ye et al., 2008). Other than
apoptosis, a study about of gRb1 suggested that inhibition of autophagy could be responsible for neuroprotective effects in glutamate-induced injury (Chen et al., 2010). According to these reports, KRG’s preventive effects against GM-induced vestibular and hearing dysfunction in rats may involve in direct actions on other targets, such as inflammation or autophagy. The therapeutic effects are probably based on a multi-target mechanism and synergistic effects of different ginsenosides. More effective components of KRG and their mechanism should be further explored.
26 V. CONCLUSION
In conclusion, the present study indicates that KRG protects against vestibular dysfunction as well as hearing loss when ototoxicity is induced by unilateral ITI with GM in rats. Ginsenoside gRb1 may mediate this effect on cochleo-vestibular function by inhibiting apoptotic pathway.
27 PART 2
Korean red ginseng ameliorates acute 3-nitropropionic acid-induced
cochlear damage in mice
I. INTRODUCTION
Mitochondria play an important role in the life and death of cells. They are the intracellular organelles mainly responsible for cellular adenosine triphosphate (ATP) production by oxidative phosphorylation, and also have a series of specific functions, including apoptosis and oxidative stress control (Kokotas et al., 2007). Mitochondrial dysfunctions are critically involved in cellular processes underlying necrotic and apoptotic cell deaths, which are thought to have a major role in the pathogenesis of neurodegenerative diseases (Beal et al., 2000). Apoptosis and formation of reactive oxygen species (ROS) have been reported to be involved in pathophysiological mechanisms of cochlear damage by ischemia, ototoxins, and noise (Huang et al., 2000; Yamane et al., 1995). Mitochondrial dysfunction in the cochlea is thought to be an important cause of sensorineural hearing loss (SNHL). The frequency of mitochondrial hearing loss is unknown. It has been estimated that 1% of prelingual deafness cases result from constitutional mutations in mtDNA (Marazita et al., 1993). As it is for postlingual hearing loss, it has been estimated that 20% may be caused by mutations in the mitochondrial genome (Estivill et al., 1998). 3-Nitropropionic acid (3-NP) is an irreversible inhibitor of succinate dehydrogenase (Ludolph et al., 1991a) and complex II respiratory enzyme required for mitochondrial energy production (Nony et al., 1999). It is a compound found in crops contaminated with a naturally occurring neurotoxin produced by legumes of the genus Astragalus and Arthrium fungi (Ming, 1995) that causes neurotoxicity in animals and humans (Ludolph et al., 1991b), inducing ATP exhaustion by mitochondrial dysfunction (Pang and Geddes, 1997). Mitochondrial Ca2+ homeostasis is impaired along with these serial cascades and results in elevation of intracellular Ca2+ levels and impaired buffering capacity of intracellular Ca2+ in astrocytes and neurons (Calabresi et al., 2001; Nasr et al.,
28
2003).
An animal model of acute cochlear energy failure induced by administering 3-NP, the mitochondrial toxin, into the round window niche of the rat cochlea was established (Hoya et al., 2004). In one study using the permanent auditory threshold shift model induced by 3-NP, a remarkable degeneration was detected in type II fibrocytes in the spiral ligament and marginal/intermediate cells in the stria vascularis after 3-NP administration (Mizutari et al., 2008). These results indicate that a permanent auditory threshold shift caused by acute cochlear mitochondrial dysfunction is primarily mediated by cellular degeneration in the cochlear lateral wall and suggest that therapy for hearing loss due to acute energy failure may be achieved through protection or regeneration of the cochlear lateral wall. Ginseng refers to the root of some species of the genus Panax (C.A. Meyer Araliaceae). Among these species, Panax ginseng is mainly cultivated in Korea and China and is the most widely used ginseng. It has a cultural and medical history of more than 5000 years. The active ingredients in ginseng are called ginsenosides or ginseng saponins (Liu and Xiao, 1992; Back et al., 1996). According to their structural differences, they were classified into 3 major groups: the panaxadiol (Rb1, Rb2, Rb3, Rc, Rd, Rg3, Rh2, and Rs1), panaxatriol (Re, Rf, Rg1, Rg2, and Rh1), and oleanolic acid groups (Ro) (Wen et al., 1996; Tackikawa et al., 1999). To date, more than 40 ginsenosides, the major components of ginseng extract, have been isolated from several species of ginseng (Lee et al., 2008). Red ginseng refers to the type that is dried after being steamed, which may have healthful elements not found in fresh ginseng. Korean red ginseng (KRG) has various health-promoting effects on the human body, such as reducing the incidence of cancers, protective effects on gastric ulcer, anti-inflammatory and antioxidative effects, enhancing the mind, stimulating libido, and positive effects on patients with Alzheimer disease (Calabresi et al., 2001; Nasr et al., 2003; Yun et al., 2010; Oyagi et al., 2010; Hong and Lyu, 2011; Im et al., 2010a). In addition, KRG containing 42 natural minerals offers a wide variety of beneficial nutrients to the body. Accumulative studies showed that KRG had protective effects on hearing loss induced by cisplatin, gentamicin, and noise through the protection of outer hair cells; pretreatment with ginseng extract significantly attenuated the cisplatin-induced increase in ROS and also inhibited the
29
expression of caspase-3 and poly-adenosine diphosphate-ribose polymerase related to cisplatin-induced apoptosis in HEI-OC1 auditory cells (Lee et al., 2008; Choung et al., 2011a; Kang and Chung, 2010). Given the results of the previous studies, some forms of hearing loss may be prevented through preservation of sensory hair cells, spiral ganglion cells, and nonsensory cells like fibrocytes in the cochlear lateral wall. However, there is no current report on the protective role of red ginseng against 3-NP-induced cochlear damage. We speculated that KRG could protect from hearing loss due to 3-NP-induced acute cochlear damage. In the present study, the animal model of acute cochlear damage using intratympanic injection of 3-NP was established and the preventive effect of KRG against cochlear damage induced by 3-NP was investigated
30
II. MATERIALS AND METHODS
A. Animals
Male BALB/c mice (6 weeks, 25–30g) involved in this study were housed in the temperature-controlled (23 ± 28 ℃) room with 12-h light/dark cycles and provided with free access to standard laboratory food and tap water. Institutional Animal Care and Use Committee approved the surgical procedures in accordance with the guidelines regarding the care and use of animals for experimental procedures. All efforts were made to minimize the number of animals and their suffering.
B. Korean red ginseng
KRG was provided from Korea Ginsengs Center (KGC@, Korea). This 100% powderized ginsenosides comprise the roots (70%) and hair roots (30%) of ginseng at 6 years of plant age. The whole ginsenoside components of KRG was melt with tap water, and given to animals at a dose of 300 mg/kg for 7 days before and after 3-NP administration.
C. Study design
This study was performed in 2 phases as follows:
Phase I: investigation of 3-NP dose-dependent toxic effects on auditory function. The study was performed with 15 BALB/c mice, which were randomly assigned to 5 groups. For each animal, the intratympanic injection of 3-NP (7 ml, Sigma, St. Louis, MO, USA) in concentration of 300, 500, 800, 1000, and 5000 mM was performed on left ear and the right ear was used as control. Auditory brainstem response (ABR) test for the assessment of hearing loss was undertaken before and on post 1 day, 1 week, and 1 month after 300, 500, 800, 1000, and 5000 mM of 3-NP administration. Cochlear organs were harvested for morphological evaluation 1 month after 500, 800, and 1000 mM of 3-NP administration.
Phase II: determining the protective effect of KRG on 3-NPinduced hearing loss with animal model established in phase I. Twenty-three mice were classified into 3-NP group (n = 12) and KRG-treated 3-NP group (n = 11). For 7 days before 3-NP administration, mice in KRG-treated 3-NP group were pretreated with KRG (300 mg/kg; 0.8 ml/each animal;
31
once a day; per os). All mice in both groups were administrated with 3-NP (500 mM; 7 ml; intratympanic injection) and the contralateral ears remained as controls. After 3-NP administration, additional KRG treatment was performed for 7 days in the KRG-treated 3-NP group. Auditory function was evaluated 2 days before 3-3-NP treatment, then 1 day, 1 week, and 1 month after NP treatment. Cochleae in each group were harvested 1 month 3-NP treatment for morphological evaluation.
D. Intratympanic administration of 3-NP
Animals were anesthetized by intraperitoneal injection of a mixture of xylazine 10 mg/kg (Rompun1, Bayer-Korea, Korea) and Zolazepam–Tiletamine 30 mg/kg (Zoletile1, Virvac, France). Under an operating microscope, 3-NP solution (7 ml/each animal) was given slowly through the anterosuperior quadrant of the left tympanic membrane with a 0.45-gauge dental needle to fill the middle ear cavity. The mouse was then kept in the same position with the left ear facing up for more than 30 min.
E. Auditory brainstem response (ABR) measurement
The animals were anaesthetized with above agents. Their body temperature was maintained with a warm blanket. All experiments were performed in an acoustically isolated booth. Subcutaneous platinum needle electrodes were placed on vertex (positive), ipsilateral (negative), and contralateral (ground) ear. The stimulus consisted of a 15-ms two tone-burst sounds, with a rise-fall time of 1 ms at frequencies of 16 and 32 kHz. Two tone-burst sounds (16 and 32 kHz) programmed by SigGen software were delivered to the left external ear of the subjects using BioSig amplifier and transducer (RP2.1 and PA5; Tucker–Davis Technologies, Alachua, FL, USA), as previously described (Kim et al., 2010). The cosine window was applied to all tone-burst stimuli. The number of iterations was fixed 1024 during all experiments. The gain of the biological amplifier was 100,000 and band-pass filter (from 300 Hz to 3 kHz) was applied to obtain ABR data. Before acquiring an EEG signal, electrodes were adjusted, if necessary, so that the impedance was less than 2 kOhm. Responses for 1024 sweeps were averaged at each intensity level and the stimuli typically progressed from 75 dB SPL to 10 dB SPL with 5 dB steps. Hearing threshold was defined as
32
the lowest stimulus intensity level that showed a reliable waveform in the ABR trace by visual inspection. The interpretation of ABR data was done by one audiology specialist. ABR threshold beyond the maximum recording limit was defined as 100 dB SPL.
F. Morphological evaluation
Phalloidin staining in the surface preparation: Rhodamine phalloidin staining was taken to detect hair cell changes in the organ of Corti. Dissected cochleae were perfused with 4% paraformaldehyde in phosphate-buffered saline (PBS) and kept in the fixative overnight at 4 ℃. For preparation of PBS used in this study, 8 g NaCl, 0.2 g KCl, 1.44 g Na2HPO4 and
0.24 g KH2PO4 were dissolved in 800 ml distilled water and adjusted to pH 7.4, and then
made to 1 l with additional distilled water. They were washed with PBS three times, and then decalcified with Calci-Clear Rapid (National Diagnostics, Atlanta, GA, USA) for 7 days. The buffer for Calci-Clear Rapid was changed daily. Following decalcification, otic capsule was removed and followed by removal of the lateral wall, Reissner’s membrane, and tectorial membrane under a microscope. The remaining organ of Corti was stained with Texas Red1-X phalloidin (Invitrogen, Eugene, Oregon, USA) for an hour. Thereafter, the whole mount was rinsed in PBS and mounted on a glass slide. Hair cells in the organ of Corti were visualized under a confocal microscope (LSM710, Carl Zeiss, Jena, Germany). The number of hair cells in the organ of Corti was counted in two different representative areas of middle and basal turns corresponding to 16 and 32 kHz, respectively based on previous study (Viberg and Canlon, 2004). Hematoxylin and eosin staining: Cochleae were fixed with 4% paraformaldehyde in PBS. After immersion in the fixative overnight at 4 ℃, the bones were rinsed in PBS containing 10% sucrose for 1 h. After decalcification with Calci-Clear Rapid (National diagnostics, Atlanta, GA) for 6 h at room temperature and then PBS washing, they were rinsed in PBS containing 10% sucrose, 20% sucrose, and 30% sucrose for 1 h at room temperature, in regular order. Then, the tissues were embedded with OCT compound and frozen blocks were cut into 10 mm thick sections in the horizontal plane parallel to the modiolus, following staining with hematoxylin and eosin for histopathology. Fibrocytes in lateral wall and spiral ganglion cells were examined under light microscopy.
33 G. Statistical analysis
All the data were presented as mean standard deviation (SD). The statistical analysis was performed using the SPSS 12.0 statistical software package for Windows (SPSS, Inc., Chicago, IL, USA). The comparison of the hearing thresholds between the 2 groups was analyzed by Mann–Whitney test. The hair cell damage was analyzed by counting outer hair cells. Quantitative analysis was performed by evaluating 30 outer hair cells in a microscope field as follows: 3 microscope fields were randomly selected for evaluating outer hair cell loss in middle and basal turns per sample, using 5 samples per group, and the mean cell counts were determined. The fibrocyte cell counts in the spiral ligament and the ganglion cells in the spiral ganglion area were determined as follows: the unit area was determined as 30,000 mm2 in the spiral ligament area and 50,000 mm2 in the spiral ganglion area. The unit area (type II area) in the spiral ligament was made below the midline of the spiral prominence, and 2 unit areas were made in the spiral ligament, using 5 samples per group. One unit area was made in the spiral ganglion, using 5 samples per group. The cell count was performed using the Olympus BX51 microscope and DP2-BSW2 program. Statistical analysis was performed with a Mann–Whitney test to determine the significance of the main and interactive effects. A p ≤ 0.05 was considered as statistically significant.
34 Ш. RESULTS A. 3-NP dose-dependent hearing threshold shift
The ABR thresholds for both frequencies (16 and 32 kHz) were elevated 1 day after administration of 300, 500, 800, 1000, and 5000 mM 3-NP, whereas a threshold shift was not detected in contralateral ears (Fig. 1). The ABR thresholds in the 800–5000 mM groups exceeded the maximum recording limit for 16 and 32 kHz in post 1 day. The decrease in auditory threshold was observed in various extents over time in the 300–800 mM groups, whereas 1000 and 5000 mM groups beyond maximum recording limit showed no auditory threshold shift 1 month after 3-NP administration.
35 Fig. 1. Auditory brainstem response (ABR)
The ABR thresholds at both frequencies were elevated 1 day after administration of 300, 500, 800, 1000, and 5000 mM 3-NP compared with those of the control animals. The ABR thresholds in the 800–5000 mM groups exceeded the maximum recording limit for 16 and 32 kHz in post 1 day. The decrease in auditory threshold was observed in various extents over time in the 300–800 mM groups, whereas the 1000 and 5000 mM groups beyond maximum recording limit showed no auditory threshold shift 1 month after 3-NP administration. The mean ± SD values are presented (n = 3 in each group).
36 B. Histological analysis after 3-NP administration
Histological comparisons for the organ of Corti, lateral wall, and spiral ganglion area between both groups are shown in Figs. 2–4, respectively. In surface preparation using phalloidin staining, hair cells in the organ of Corti of the control ears showed normal features; however, the number of missing outer hair cells increased as the concentration of 3-NP increased from 300 to 1000 mM (Fig. 2). Light microscopy revealed that the 3-NP administration induced the loss of fibrocytes in cochlear lateral walls (Fig. 3). In contrast to the normal finding from the lateral walls of the control group, the fibrocytes in the 300, 500, and 800 mM groups were reduced remarkably and most fibrocytes in the ears treated with 1000 mM 3-NP were degenerated with the shrinkage of the spiral ligament and atrophy of the stria vascularis. Spiral ganglion cells were degenerated dose dependently in the 3-NP-treated ears, similar to the findings in the lateral walls (Fig. 4).
37 Fig. 2. Confocal microscopic images
Confocal microscopic images of phalloidin-stained organ of Corti in middle and basal turns of cochleae in control and NP groups (300, 500, 800, and 1000 mM NP) 1 month after 3-NP administration. In surface preparation, hair cells in the organ of Corti in the control group showed normal features in both turns, whereas the number of missing outer hair cells increased as the 3-NP concentration increased from 300 to 1000 mM. Scale bar = 50 mm.
38 Fig. 3. Light microscopic images of lateral walls
Light microscopic images of hematoxylin–eosin-stained lateral walls in the middle and basal turns of cochleae 1 month after 3-NP administration. In contrast to the normal findings in the lateral walls of the control group, the fibrocyte counts in the 300, 500, and 800 mM 3-NP groups were reduced remarkably and most fibrocytes in the ears treated with 1000 mM 3-NP were degenerated with the shrinkage of spiral ligament and atrophy of stria vascularis.
39
Fig. 4. Light microscopic images of spiral ganglion cells
Light microscopic images of hematoxylin–eosin-stained spiral ganglion cells in the middle turns of cochleae 1 month after 3-NP administration. The spiral ganglion cells were degenerated dose dependently in the 3-NP-treated ears, similar to the findings in the lateral walls.
40
C. Protective effects of KRG on 3-NP-induced hearing threshold shift
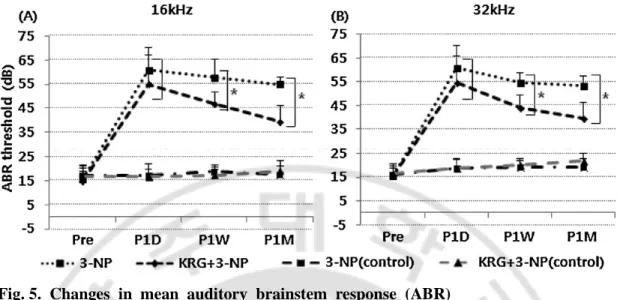
Based on the above-mentioned results, 500 mM 3-NP was selected in the study for the evaluation of the protective effect of KRG on a 3-NP-induced cochlear damage model. The ABR thresholds of the 3-NP and KRG-treated 3-NP groups are shown in Fig. 5. One day after 3-NP administration, 3-NP and KRG-treated 3-NP groups demonstrated a remarkable auditory threshold shift at 16 (45 and 40 dB, respectively) and 32 kHz (45 and 39 dB, respectively); however, thresholds at 16 and 32 kHz of the KRG treated 3-NP group were significantly lower than those of the 3-NP group post 1 week and post 1 month (p < 0.001, Mann–Whitney test). The threshold shifts for hearing recovery from 1 day after 3-NP administration in 3-NP group were 2.9 dB (1 week) and 5.8 dB (1 month) at 16 kHz, and 6.2 dB (1 week) and 7.5 dB (1 month) at 32 kHz. For the KRG-treated 3-NP group, threshold shifts of 8.2 dB (1 week) and 15.5 dB (1 month) at 16 kHz, and 10.4 dB (1 week) and 14 dB (1 month) at 32 kHz were observed. No change in threshold shift was seen in the contralateral ears of either group.
41
Fig. 5. Changes in mean auditory brainstem response (ABR)
Changes in mean auditory brainstem response (ABR) thresholds in the 3-NP and KRG-treated 3-NP groups before (Pre) and after drug administration (P1D, P1W, and P1M) at 16 kHz (A) and 32 kHz (B). Marked auditory threshold shifts at 16 and 32 kHz in both groups were noted 1 day after 3-NP administration; however, the auditory thresholds at both frequencies in the KRG-treated 3-NP group were significantly lower than those in the 3-NP group post 1 week and post 1 month (*p < 0.001, Mann–Whitney test). No change in threshold shift was seen in the contralateral ears of either group.
42 D. Histological analysis after KRG treatment
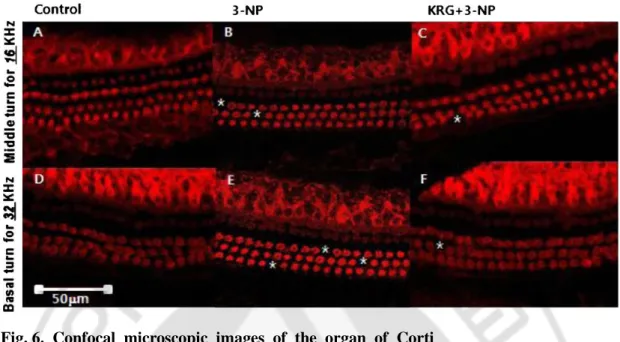
The hair cells in organ of Corti were observed in basal and middle turns of cochleae in the control, 3-NP, and KRG-treated 3-NP groups (Fig. 6). The loss of some outer hair cells was observed in the 3-NP group (Fig. 6B and E), whereas those in the control group showed normal appearance (Fig. 6A and D) and KRG-treated 3-NP group demonstrated minimal loss (Fig. 6C and F). The mean outer hair cell counts in organ of Corti at middle and basal turns were 30 ± 0.0 at both turns in the control group, 28.8 ± 0.8 and 28.6 ± 1.5 in the 3-NP group, 29.6 ± 0.5 and 29.4 ± 0.9 in the KRG-treated 3-NP group. The difference of mean counts of outer hair cells among the 3 groups and between basal and middle turns was not statistically significant.
43
Fig. 6. Confocal microscopic images of the organ of Corti
Confocal microscopic images of the phalloidin-stained organ of Corti in the middle and basal turns in the control, 3-NP, and KRG-treated 3-NP groups. The loss of some outer hair cells was observed in the 3-NP group (B, E), whereas those in the control group showed normal features (A, D) and those in the KRG-treated 3-NP group demonstrated a minimal loss (C, F). The difference of mean counts of outer hair cells among the 3 groups and between basal and middle turns was not statistically significant. Scale bar = 50 mm.
44
The cellular change of the cochlear lateral wall was observed under light microscopy (Fig. 7). Compared with the findings from the control group that showed normal morphological features of the type II fibrocytes (Fig. 7A and E), diffuse degeneration of fibrocytes and atrophy of stria vascularis were seen in the 3-NP group (Fig. 7B and F) and similar findings with that of the control group were obtained from the KRG-treated 3-NP group (Fig. 7C and G). Comparison of the mean cell counts in the type II area of the cochlear lateral wall revealed a statistically significant difference between the control and 3-NP groups (p < 0.001 at basal and middle turns, 15.6 ± 2.8 cells/30,000 mm2, 17.2 ± 2.4 cells/30,000 mm2, respectively in control group, 6.8 ± 1.5 cells/30,000 mm2, 6.4 ± 1.1 cells/30,000 mm2, respectively in NP group, Mann–Whitney test) and between the NP and KRG-treated 3-NP groups (p = 0.002 at basal turn and p = 0.027 at middle turn, 13.2 ± 2.8 cells/30,000 mm2, 12.8 ± 4.3 cells/30,000 mm2, respectively in KRG-treated 3-NP group, Mann–Whitney test), however not between the control and KRG-treated 3-NP groups (Fig. 7D and H).
45
Fig. 7. Cellular changes in the cochlear lateral walls
Cellular changes in the cochlear lateral walls under light microscopy in the control, 3-NP, and KRG-treated 3-NP groups. The control group showed normal morphological features of type II fibrocytes (A, E), and the KRG-treated 3-NP group displayed similar findings with that of the control group (C, G). In contrast, the diffuse degeneration of fibrocytes and atrophy of stria vascularis were seen in the 3-NP group (B, F). The comparison of the mean cell counts in the type II area of the cochlear lateral wall demonstrates the statistically significant difference between the 3-NP and KRG-treated 3-NP groups (*p < 0.027 at middle turn, †p < 0.002 at basal turn, Mann–Whitney test) and between the control and 3-NP groups
(‡p < 0.001, at both basal and middle turns, Mann–Whitney test), however not between the
46
The cellular change in the spiral ganglion was observed under light microscopy (Fig. 8). Compared with the findings from the control group, which shows normal spiral ganglion cell population (Fig. 8A), severe spiral ganglion cell degeneration was seen in the 3-NP group (Fig. 8B) and mild degeneration was observed in the KRG-treated 3-NP group (Fig. 8C). The mean cell counts in the spiral ganglion area in the control, 3-NP, and KRG-treated 3-NP groups were 37 ± 6.1 cells/50,000 mm2, 15.2 ± 3.4 cells/50,000 mm2, and 32.8 ± 2.8 cells/50,000 mm2, respectively. The mean cell counts in the spiral ganglion area did not show a statistically significant difference between the control and KRG-treated 3-NP groups; however, there were statistically significant differences between the control and 3-NP groups and between the 3-NP and KRG-treated 3-NP groups (Fig. 8D; p < 0.001, Mann–Whitney test).
47 Fig. 8. Cellular changes in the spiral ganglion
Cellular changes in the spiral ganglion under light microscopy in the control, 3-NP, and KRG-treated 3-NP groups. The control and KRG-treated 3-NP groups showed normal spiral ganglion cell population (A) and mild degeneration (C), respectively, whereas the 3-NP group showed severe spiral ganglion cell degeneration (B). The mean cell counts in the spiral ganglion area do not show a statistically significant difference between the control and KRG-treated 3-NP groups; however, there are statistical significant differences between the control and 3-NP groups and between the 3-NP and KRG-treated 3-NP groups (D; *p < 0.001, Mann–Whitney test).