INTRODUCTION
The pathogenesis of allergic diseases is multifactorial. Extsive evidence indicates that genetic susceptibility, as well as en-vironmental and demographic factors, affects allergen sensiti-zation and development of allergic diseases.1-4 Exposure to al-lergens is crucially important in inducing sensitization and de-veloping allergic diseases, and the environmental concentra-tion of allergens is critical. For example, the prevalence of pol-len sensitization and allergic diseases tends to be high for those living in an environment with high atmospheric concentration of pollen.5,6 Demographic factors, including sex, age, and obesi-ty, are significant contributing factors to the development of al-lergic diseases.7-9 In addition, in recent studies, the vitamin D level was suggested as a significant factor associated with the risk of allergic diseases.10 However, large-scale studies to detect significant factors related to the development of allergies are
lacking, especially in Korea.
The Korea National Health and Nutrition Examination Survey (KNHANES) is a large-scale cross-sectional survey, conducted
Prevalence of Self-reported Allergic Diseases and IgE Levels:
A 2010 KNHANES Analysis
Hye Jung Park,
1Eun-Jin Kim,
2Dankyu Yoon,
2Jeom Kyu Lee,
2Woo-Sung Chang,
2Yoen-Mi Lim,
2Jung-Won Park,
3*
Joo-Shil Lee
2*
1Department of Internal Medicine, Gangnam Severance Hospital, Yonsei University College of Medicine, Seoul, Korea
2 Division of Allergy and Chronic Respiratory Diseases, Center for Biomedical Sciences, Korea National Institute of Health, Korea Center for Diseases Control and Prevention, Osong, Korea
3Division of Allergy and Immunology, Department of Internal Medicine, Institute of Allergy, Yonsei University College of Medicine, Seoul, Korea
This is an Open Access article distributed under the terms of the Creative Commons Attribution Non-Commercial License (http://creativecommons.org/licenses/by-nc/4.0/) which permits unrestricted non-commercial use, distribution, and reproduction in any medium, provided the original work is properly cited.
Purpose: The prevalence of allergic diseases is known to be associated with both demographic and environmental factors. Herein, we aimed to de-termine significant factors associated with the prevalence of allergic diseases and with total immunoglobulin E (tIgE) and specific immunoglobulin E (sIgE) levels in Korea. Methods: We analyzed unweighted data collected by the 2010 Korea National Health and Nutrition Examination Survey for 2,342 subjects who underwent serum tests for tIgE and sIgE to Dermatophagoides farinae, dog, and Blattella germanica, representing a sample of 16,003,645 citizens, by considering the sample weight and stratification. Results: The overall prevalence of self-reported allergic diseases was 37.6%. The prevalence rates of allergic rhinitis and atopic dermatitis decreased with age, whereas the asthma prevalence was not affected by the age of the subjects. When analyzed according to the type of allergic diseases, the prevalence of self-reported allergic disease was significantly associated with various factors (e.g. age, occupation, living in urban areas, and depression). The tIgE level decreased with age, but later increased. Elevation of tIgE was significantly associated with male sex, type of occupation, obesity, and smoking status. However, the risk factors for the increased sIgE levels to each allergen were quite different. Sensitization to D. farinae was more likely in young subjects, whereas the prevalence of sensitization to B. german-ica was signifgerman-icantly higher in subjects with male sex, residing in a house (houses), and with glucose intolerance. Finally, young age and the smoking status were significantly associated with sensitization to dog. Conclusions: Various demographic and environmental factors were significantly asso-ciated with the prevalence of self-reported allergic diseases and the levels of tIgE and sIgE to D. farinae, B. germanica, and dog in Korea.
Key Words: Allergy; demographic factors; environment; immunoglobulin E
Correspondence to: Joo-Shil Lee, PhD, Division of Allergy and Chronic Respiratory Diseases, Center for Biomedical Sciences, Korea National Institute of Health, Korea Center for Diseases Control and Prevention, 187
Osongsaengmyeong 2-ro, Osong-eup, Heungdeok-gu, Cheongju 28159, Korea. Tel: +82-43-719-8451; Fax: +82-43-719-8909; E-mail: [email protected] Co-Correspondence to: Jung-Won Park, MD, PhD, Division of Allergy and Immunology, Department of Internal Medicine, Institute of Allergy, Yonsei University College of Medicine, Severance Hospital, 50 Yonsei-ro, Seodaemun-gu, Seoul 03722, Korea.
Tel: +82-2-2228-1987; Fax: +82-2-393-6884; E-mail: [email protected]
Received: November 22, 2016; Revised: February 23, 2017; Accepted: March 1, 2017
• Hye Jung Park and Eun-Jin Kim contributed equally to this article as co-first authors.
•There are no financial or other issues that might lead to conflict of interest.
Allergy Asthma Immunol Res. 2017 July;9(4):329-339.
https://doi.org/10.4168/aair.2017.9.4.329
by the Korea Centers for Disease Control and Prevention (KCDC), which collects a significant amount of demographic and environmental data. The survey sample represents the en-tire non-institutionalized general population of South Korea.11 In 2010, the survey included a questionnaire for allergic diseas-es and serologic tdiseas-ests for total immunoglobulin E (tIgE) and specific IgE (sIgE) to Dermatophagoides farinae (house dust mite), dog, and Blattella germanica (German cockroach). Thus, the KNHANES provides useful data to define and confirm sig-nificant factors associated with allergen sensitization and the prevalence of allergic diseases.
In this study, we aimed to define significant demographic and environmental factors associated with the tIgE and sIgE levels and the prevalence of allergic diseases using data from the fifth KNHANES, conducted in 2010.
MATERIALS AND METHODS
Study design and populations
This study analyzed the data from the fifth KNHANES, a na-tional survey performed in 2010-2012. In the fifth KNHANES, all subjects were tested for tIgE. The survey used complex prob-ability procedures to represent the entire Korean general popu-lation, including stratification and multiple stages of cluster se-lection using age, sex, location of residence, type of residence, education level, and other variables. In the present study, to ob-tain appropriate estimates, we followed the guidelines for re-porting sample weight (sampling weights) and stratification designated by the KCDC; this information is available on the KNHANES website (http://knhanes.cdc.go.kr).
Among all subjects registered in 2010, a total of 2,342 subjects aged ≥10 years responded to the health survey and underwent serum IgE tests between January and December 2010. These subjects represented 16,003,645 citizens of Korea (about one-third of the total population of Korea) as obtained by complex sample analysis. In terms of the variables assessed, glucose tol-erance status, body mass index (BMI), smoking history, and de-pression were assessed for 1,977 subjects aged ≥19 years, repre-senting 13,762,677 citizens. The subjects’ education level, mar-riage status, income level, and occupation were assessed for 1,577 subjects aged ≥30 years, representing 9,624,008 citizens.
All participants provided written informed consent prior to the survey. The KCDC Institutional Review Board approved the fifth KNHANES (#KCDC-2010-02CON-21-C).
Interview items
Responses to all questionnaire items were obtained by face-to-face interviews. Allergic disease was defined as the presence of at least 1 self-reported allergic disease, including allergic rhi-nitis, atopic dermatitis, and bronchial asthma. Responses of “negative” for 1 or 2 allergic diseases in addition to missing re-sponses for the remaining disease options were considered
missing values. The presence of depression was assessed as previously described.12-14 Each subject’s residential district was classified as urban (“Dong” in Korea) or suburban/rural (“Eup/ Myun”). The type of residence was classified as apartment or house. Income level was categorized into 4 quartiles: quartile 1, <$2,600/month; quartile 2, $2,600-$4,300/month; quartile 3, $4,300-$8,600/month; and quartile 4, >$8,600/month. Smok-ing history was classified as never-smoker, light smoker (<5 pack-years/entire life), or smoker (≥5 pack-years/entire life).
Measurements
BMI is measured as body weight (to the nearest 0.1 kg) divid-ed by the square of the body weight (nearest 0.1 cm), and ex-pressed in unit of kg/m2. Glucose tolerance was tested as previ-ously described.15 In brief, blood samples were obtained after ≥8 hours of fasting. Based on the fasting glucose levels, the glu-cose tolerance status was categorized as normal, impaired fast-ing glucose, or diabetes mellitus. The serum vitamin D level was categorized into 3 groups: quartile 1, <13.30 ng/mL; quar-tiles 2-3, 13.30-21.37 ng/mL; and quartile 4, ≥21.37 ng/mL. The 5th KNHANES included data on the tIgE and 3 types of sIgE. According to a previous Korean cohort study,16 the selec-tion of these 3 types of sIgE (D. farinae, B. germanica, and dog) does not lead to large discrepancies in revealing the atopy sta-tus in Korea. We used the ImmunoCAP® system (Thermo Sci-entific, Uppsala, Sweden) to measure the levels of tIgE and sIgE to D. farinae, B. germanica, and dog, following the manufactur-er’s instructions. Elevation of the tIgE level was defined as a tIgE level >100 kU/L. Positivity to sIgE was defined as an sIgE level >0.35 kU/L.
Statistical analysis
For data analysis of the survey, which involved a complex sample, we used the KNHANES stratification variables and sampling weight (weights). The missing data were dealt with using complete case analysis. Because the distribution of se-rum IgE was log-normal, the tIgE levels were logarithmically transformed for statistical analysis. Differences in the geometric mean of tIgE were tested using t tests, and differences in the prevalence of allergic diseases were tested using χ2 tests. Uni-variate and multiUni-variate logistic regression analyses were per-formed to identify factors associated with the prevalence of al-lergic diseases and positivity of sIgE to D. farinae, B. germanica, and dog. SPSS v. 18.0 (IBM Corp., Armonk, NY, USA) was used for all analyses, and P values <0.05 were considered statistically significant.
RESULTS
Univariate analysis of factors associated with the prevalence of any allergic disease
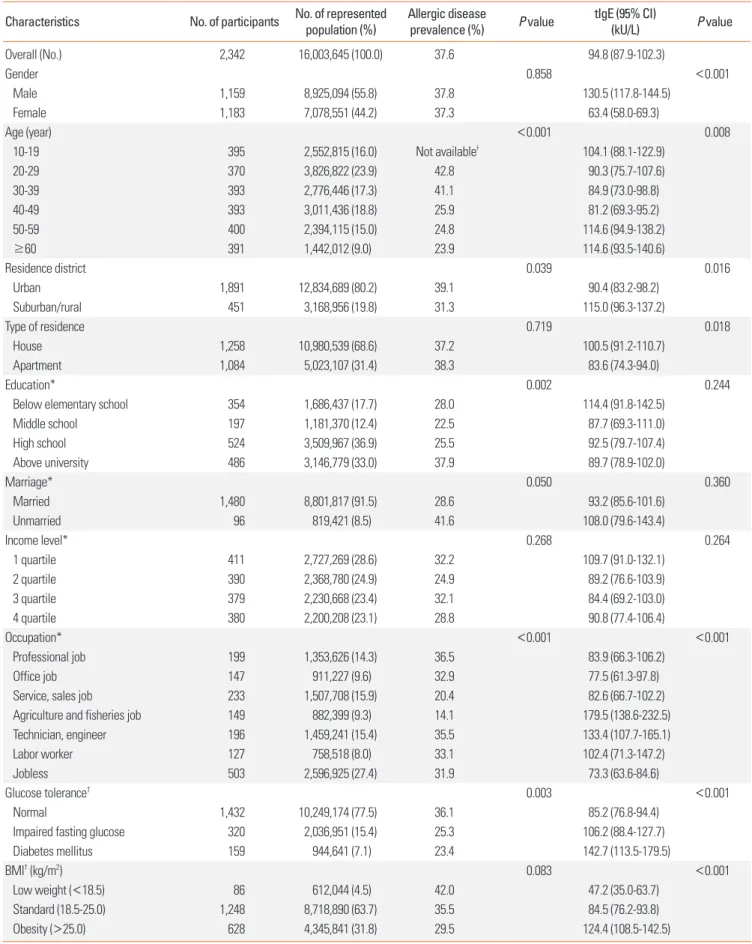
Table 1. Univariate analyses of factors associated with the total and specific immunoglobulin E levels and prevalence of any allergic diseases
Characteristics No. of participants No. of represented population (%) Allergic disease prevalence (%) P value tIgE (95% CI) (kU/L) P value
Overall (No.) 2,342 16,003,645 (100.0) 37.6 94.8 (87.9-102.3) Gender 0.858 <0.001 Male 1,159 8,925,094 (55.8) 37.8 130.5 (117.8-144.5) Female 1,183 7,078,551 (44.2) 37.3 63.4 (58.0-69.3) Age (year) <0.001 0.008 10-19 395 2,552,815 (16.0) Not availableǂ 104.1 (88.1-122.9) 20-29 370 3,826,822 (23.9) 42.8 90.3 (75.7-107.6) 30-39 393 2,776,446 (17.3) 41.1 84.9 (73.0-98.8) 40-49 393 3,011,436 (18.8) 25.9 81.2 (69.3-95.2) 50-59 400 2,394,115 (15.0) 24.8 114.6 (94.9-138.2) ≥60 391 1,442,012 (9.0) 23.9 114.6 (93.5-140.6) Residence district 0.039 0.016 Urban 1,891 12,834,689 (80.2) 39.1 90.4 (83.2-98.2) Suburban/rural 451 3,168,956 (19.8) 31.3 115.0 (96.3-137.2) Type of residence 0.719 0.018 House 1,258 10,980,539 (68.6) 37.2 100.5 (91.2-110.7) Apartment 1,084 5,023,107 (31.4) 38.3 83.6 (74.3-94.0) Education* 0.002 0.244
Below elementary school 354 1,686,437 (17.7) 28.0 114.4 (91.8-142.5)
Middle school 197 1,181,370 (12.4) 22.5 87.7 (69.3-111.0) High school 524 3,509,967 (36.9) 25.5 92.5 (79.7-107.4) Above university 486 3,146,779 (33.0) 37.9 89.7 (78.9-102.0) Marriage* 0.050 0.360 Married 1,480 8,801,817 (91.5) 28.6 93.2 (85.6-101.6) Unmarried 96 819,421 (8.5) 41.6 108.0 (79.6-143.4) Income level* 0.268 0.264 1 quartile 411 2,727,269 (28.6) 32.2 109.7 (91.0-132.1) 2 quartile 390 2,368,780 (24.9) 24.9 89.2 (76.6-103.9) 3 quartile 379 2,230,668 (23.4) 32.1 84.4 (69.2-103.0) 4 quartile 380 2,200,208 (23.1) 28.8 90.8 (77.4-106.4) Occupation* <0.001 <0.001 Professional job 199 1,353,626 (14.3) 36.5 83.9 (66.3-106.2) Office job 147 911,227 (9.6) 32.9 77.5 (61.3-97.8)
Service, sales job 233 1,507,708 (15.9) 20.4 82.6 (66.7-102.2)
Agriculture and fisheries job 149 882,399 (9.3) 14.1 179.5 (138.6-232.5)
Technician, engineer 196 1,459,241 (15.4) 35.5 133.4 (107.7-165.1)
Labor worker 127 758,518 (8.0) 33.1 102.4 (71.3-147.2)
Jobless 503 2,596,925 (27.4) 31.9 73.3 (63.6-84.6)
Glucose tolerance† 0.003 <0.001
Normal 1,432 10,249,174 (77.5) 36.1 85.2 (76.8-94.4)
Impaired fasting glucose 320 2,036,951 (15.4) 25.3 106.2 (88.4-127.7)
Diabetes mellitus 159 944,641 (7.1) 23.4 142.7 (113.5-179.5)
BMI† (kg/m2) 0.083 <0.001
Low weight (<18.5) 86 612,044 (4.5) 42.0 47.2 (35.0-63.7)
Standard (18.5-25.0) 1,248 8,718,890 (63.7) 35.5 84.5 (76.2-93.8)
Obesity (>25.0) 628 4,345,841 (31.8) 29.5 124.4 (108.5-142.5)
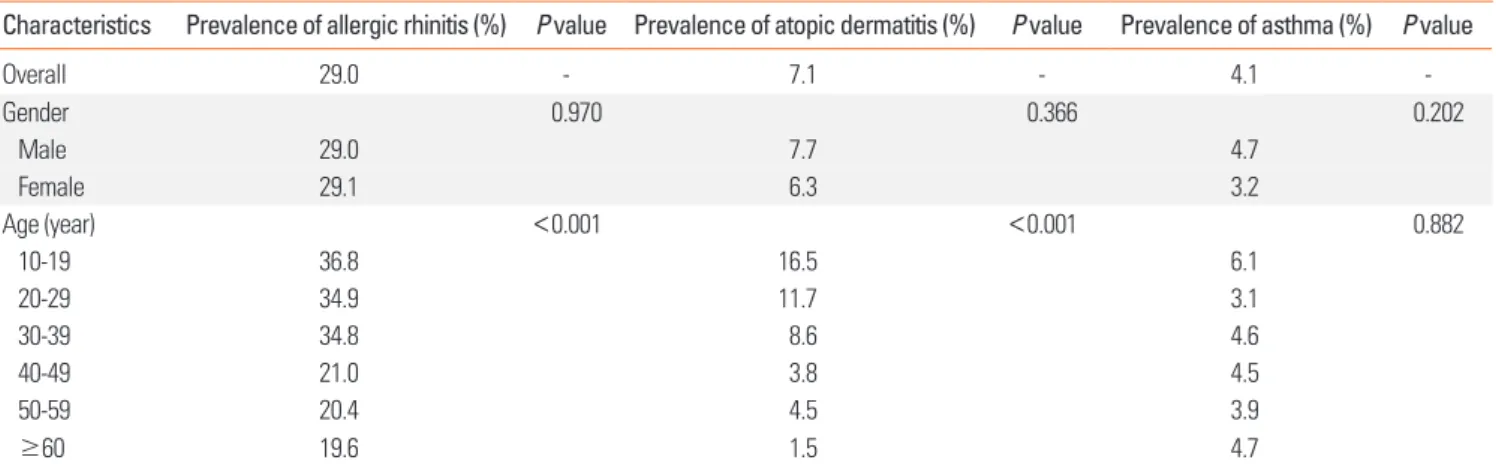
37.6% (Table 1). The prevalence rates of allergic rhinitis, atopic dermatitis, and asthma were 29.0%, 7.1%, and 4.1%, respective-ly (Table 2). The overall prevalence of allergic diseases was in-versely correlated with age (Table 1). Although the prevalence rates of allergic rhinitis (P<0.001) and atopic dermatitis (P<0.001) significantly correlated with young age, no
associa-tion between the prevalence of asthma and age was observed (P=0.882) (Table 2). The residence district, education level, oc-cupation, glucose tolerance, depression, elevation of tIgE, sIgE to D. farinae, and sIgE to dog were also identified as significant factors associated with allergic diseases in the univariate analy-ses (Table 1).
Table 1. Continued
Characteristics No. of participants No. of represented population (%) Allergic disease prevalence (%) P value tIgE (95% CI) (kU/L) P value
Smoking history† 0.226 <0.001
Never smoker 1,051 6,599,290 (48.2) 34.0 66.5 (60.6-72.9)
Light smoker (<5 pack/whole life) 68 585,990 (4.3) 43.6 103.8 (67.7-159.3)
Smoker (≥5 pack/life) 845 6,493,304 (47.5) 32.4 131.2 (114.4-150.4)
Depression† 0.015 0.001
No 1,688 11,885,162 (86.8) 32.4 99.0 (90.4-108.5)
Yes 279 1,807,876 (13.2) 42.5 64.3 (50.6-81.9)
Serum vitamin D level 0.199 0.018
1 quartile 584 4,074,877 (25.5) 40.4 84.9 (74.7-96.5)
2, 3 quartile 1,173 7,862,277 (49.1) 38.3 90.7 (81.7-100.7)
4 quartile 585 4,066,492 (25.4) 33.6 115.6 (97.8-136.5)
Elevation of tIgE (>100 kU/L) 0.002
Negative 1,373 9,154,543 (57.2) 33.7 23.1 (32.3-36.0)
Positive 969 6,849,102 (42.8) 42.8 372.1 (347.4-398.6)
Positivity to sIgE to D. farinae <0.001
Negative 1,403 9,235,722 (57.7) 32.4 45.9 (42.7-49.5)
Positive 939 6,767,923 (42.3) 44.6 255.0 (229.1-283.7)
Positivity to sIgE to B. germanica 12,562,395 (78.5) 0.387
Negative 1,878 3,441,250 (21.5) 36.9 67.4 (62.6-72.5)
Positive 464 39.9 330.4 (291.4-374.7)
Positivity to sIgE to dog§ 0.001
Negative 2,198 14,824,206 (92.6) 36.0 82.7 (76.5-89.5)
Positive 144 1,179,439 (7.4) 56.4 527.8 (398.0-700.0)
tIgE, total immunoglobulin E; sIgE, specific immunoglobulin E; CI, confidence interval; BMI, body mass index.
*Subjects aged ≥30 years (n=1,577, representing 9,624,008 citizens); †Subjects aged ≥19 years (n=1,977, representing 13,762,677 citizens); ǂData were missing
for 60.3% of the participants; §Positivity to sIgE was defined as a level >0.35 kU/L.
Table 2. Univariate analyses of the prevalence rates of allergic rhinitis, atopic dermatitis, and asthma according to age and sex
Characteristics Prevalence of allergic rhinitis (%) P value Prevalence of atopic dermatitis (%) P value Prevalence of asthma (%) P value
Overall 29.0 - 7.1 - 4.1 -Gender 0.970 0.366 0.202 Male 29.0 7.7 4.7 Female 29.1 6.3 3.2 Age (year) <0.001 <0.001 0.882 10-19 36.8 16.5 6.1 20-29 34.9 11.7 3.1 30-39 34.8 8.6 4.6 40-49 21.0 3.8 4.5 50-59 20.4 4.5 3.9 ≥60 19.6 1.5 4.7
Univariate analyses of factors associated with the tIgE level
The geometric mean tIgE level was 94.8 kU/L (95% confi-dence interval [CI], 87.9-102.3). The mean tIgE level was signifi-cantly higher in men than in women. The tIgE level decreased with age, but later increased. The residence district, type of resi-dence, occupation, glucose tolerance, BMI, smoking history, depression, and serum vitamin D level were significantly
asso-ciated with the tIgE level in the univariate analyses (Table 1).
Multivariate analyses for factors associated with self-reported allergic diseases
Multivariate analyses were conducted to assess the associa-tions of the factors analyzed with each type of self-reported al-lergic disease (Table 2). Young age (P=0.013), the subjects’ oc-Table 3. Multivariate analyses of potential independent risk factors for allergic rhinitis, atopic dermatitis, and asthma in subjects aged ≥30 years
Variables Allergic rhinitis Atopic dermatitis Asthma
OR 95% CI P value OR 95% CI P value OR 95% CI P value
Age (year) 0.013 0.015 0.540
30-39 Reference - Reference - Reference
40-49 0.592 0.404-0.868 0.472 0.206-1.083 0.996 0.412-2.410
50-59 0.656 0.434-0.992 0.608 0.281-1.314 0.523 0.176-1.552
≥60 0.561 0.352-0.894 0.162 0.048-0.553 0.637 0.266-1.522
Residence district 0.713 0.989 0.555
Urban Reference - Reference - Reference
Suburban/rural 0.912 0.557-1.493 1.006 0.413-2.453 0.757 0.299-1.916
Education 0.106 0.662 0.003
Below elementary school Reference - Reference - Reference
Middle school 0.743 0.405-1.365 0.547 0.097-3.095 0.873 0.303-2.518
High school 0.746 0.437-1.275 0.768 0.288-2.047 0.127 0.041-0.392
Above university 1.181 0.701-1.987 1.155 0.411-3.243 0.430 0.141-1.310
Occupation 0.008 0.037 0.122
Professional job in urban Reference - Reference - Reference
Office job 1.219 0.695-2.139 0.552 0.173-1.760 0.537 0.126-2.292
Service, sales job 0.680 0.396-1.168 0.656 0.223-1.935 0.579 0.168-1.999
Agriculture and fisheries job 0.565 0.251-1.271 0.108 0.016-0.746 0.234 0.046-1.203
Technician, engineer 1.498 0.863-2.598 1.030 0.395-2.686 0.842 0.280-2.533
Labor worker 1.073 0.487-2.364 1.700 0.367-7.867 0.247 0.058-1.048
Jobless 1.487 0.880-2.514 0.425 0.139-1.299 0.349 0.126-0.968
Glucose tolerance 0.023 0.964 0.298
Normal Reference - Reference - Reference
Impaired fasting glucose 0.733 0.476-1.128 1.100 0.514-2.355 0.696 0.297-1.633
Diabetes mellitus 0.463 0.259-0.830 1.103 0.222-5.470 1.999 0.666-5.999
Depression 0.273 0.029 0.009
No Reference - Reference - Reference
Yes 1.247 0.839-1.852 2.548 1.101-5.899 2.691 1.280-5.655
Elevation of tIgE 0.728 0.072 0.001
Negative Reference - Reference - Reference
Positive 0.934 0.633-1.377 0.505 0.239-1.064 0.264 0.123-0.567
Positivity to sIgE to D. farinae 0.064 0.170 0.078
Negative Reference - Reference - Reference
Positive 0.697 0.475-1.021 1.555 0.826-2.926 1.943 0.927-4.073
Positivity to sIgE to dog 0.007 0.729 0.001
Negative Reference - Reference - Reference
Positive 0.408 0.213-0.784 0.801 0.227-2.825 0.264 0.123-0.567
cupation (P=0.008), glucose intolerance (P=0.023), and sensiti-zation to dog (P=0.007) were found to be significant indepen-dent risk factors for allergic rhinitis. Young age (P=0.015), occu-pation (P=0.038), and depression (P=0.029) were significantly and independently associated with atopic dermatitis. Finally, a high education level (P=0.003), depression (P=0.009), elevation of tIgE (P=0.001), and sensitization to dog (P=0.001) were sig-nificantly and independently associated with asthma (Table 3).
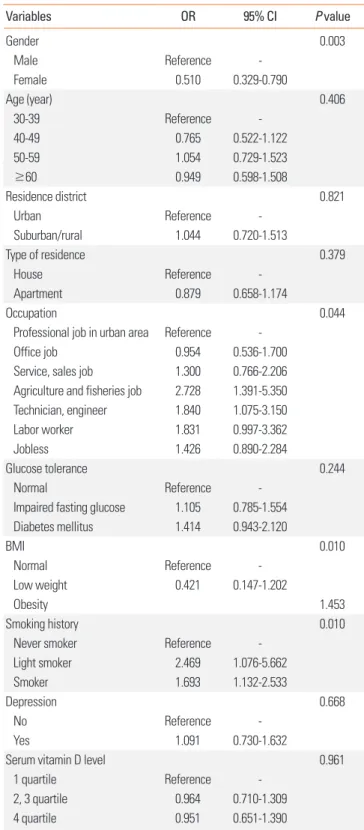
Risk factors for elevation of tIgE
Based on the results of the univariate analysis (Table 1), we conducted a multivariate analysis and found that sex, occupa-tion, BMI, and smoking history were independent risk factors for elevation of tIgE in subjects aged ≥30 years. Specifically, male sex (odds ratio [OR] in women, 0.510; 95% CI, 0.329-0.790;
P=0.003), occupations related to agriculture and fishery (OR,
2.728; 95% CI, 1.391-5.350; P=0.044), obesity (OR, 1.453; 95% CI, 1.061-1.989; P=0.010), and smokers (OR vs never-smokers, 1.693; 95% CI, 1.132-2.533; P=0.010) (Table 4) were indepen-dent risk factors for elevation of tIgE.
Risk factors for sensitization to D. farinae
In the univariate analysis (Table 1), male sex, age, occupation, smoking history, BMI, and the vitamin D level were significant risk factors for sensitization to D. farinae. In the multivariate analysis, old age was found to be negatively associated with al-lergic diseases, when compared with those aged 30-39 years as the reference group (OR, 0.611 in those aged 40-49 years; OR, 0.785 in those aged 50-59 years; OR, 0.644 in those aged ≥60 years; P=0.036). Although the vitamin D level was significantly associated with sensitization to D. farinae, the effects on the sensitization were not consistent (OR, 0.731 for quartiles 2-3,
P=0.030; OR, 1.072 for quartile 4) (Table 5).
Risk factors for sensitization to B. germanica
In the univariate analysis, male sex, residential district, type of residence, occupation, glucose tolerance status, BMI, and smoking history were significant risk factors for sensitization to
B. germanica. In the multivariate analysis, male sex was found
to be a significant independent risk factor of sensitization to B.
germanica (OR, 0.307 in women; 95% CI, 0.193-0.489; P<0.001),
whereas subjects living in apartments had a reduced risk (OR, 0.682; 95% CI, 0.484-0.959; P=0.028). Further, glucose intoler-ance was identified as another significant risk factor for sensiti-zation to B. germanica (OR, 1.413 in those with impaired fasting glucose; OR, 1.928 in those with diabetes mellitus; P=0.012) (Table 6).
Risk factors for sensitization to dog
In the univariate analysis, male sex, age, and smoking status were significant risk factors for sensitization to dog. In the mul-tivariate analysis, older age was found to be associated with a
low risk for sensitization to dog (P=0.014), whereas smokers were associated with a high risk, as compared with never smok-ers (OR, 2.423; 95% CI, 1.416-4.145; P=0.004) (Table 7).
Table 4. Multivariate analysis for positive total immunoglobulin E in subjects aged ≥30 years (n=1,577, representing 9,624,008 citizens ≥30 years)
Variables OR 95% CI P value Gender 0.003 Male Reference Female 0.510 0.329-0.790 Age (year) 0.406 30-39 Reference 40-49 0.765 0.522-1.122 50-59 1.054 0.729-1.523 ≥60 0.949 0.598-1.508 Residence district 0.821 Urban Reference Suburban/rural 1.044 0.720-1.513 Type of residence 0.379 House Reference Apartment 0.879 0.658-1.174 Occupation 0.044
Professional job in urban area Reference
Office job 0.954 0.536-1.700
Service, sales job 1.300 0.766-2.206 Agriculture and fisheries job 2.728 1.391-5.350 Technician, engineer 1.840 1.075-3.150
Labor worker 1.831 0.997-3.362
Jobless 1.426 0.890-2.284
Glucose tolerance 0.244
Normal Reference
Impaired fasting glucose 1.105 0.785-1.554 Diabetes mellitus 1.414 0.943-2.120 BMI 0.010 Normal Reference Low weight 0.421 0.147-1.202 Obesity 1.453 Smoking history 0.010
Never smoker Reference
Light smoker 2.469 1.076-5.662
Smoker 1.693 1.132-2.533
Depression 0.668
No Reference
Yes 1.091 0.730-1.632
Serum vitamin D level 0.961
1 quartile Reference
2, 3 quartile 0.964 0.710-1.309
4 quartile 0.951 0.651-1.390
Positive tIgE level was defined as tIgE levels >100 kU/L. OR, odds ratio; CI, confidence interval; BMI, body mass index.
DISCUSSION
This large cross-sectional study aimed to identify demograph-ic and environmental factors associated with the prevalence of allergic diseases and allergen sensitization in the non-institu-tionalized Korean general population. As a result, we found that allergic diseases and allergen sensitization were significantly associated with various demographic factors.
First, age was a significant risk factor for self-reported allergic diseases. Specifically, the prevalence of allergic rhinitis and atopic dermatitis decreased with increasing age, supporting the findings of previous studies.17,18 Aging-related
immunomodula-tion and immune tolerance induced by long-term exposure to allergens could be responsible for these associations.19 In con-trast, the asthma prevalence was not associated with age in this study. A previous large-scale cohort study also showed that age was not significantly associated with the prevalence of asth-ma.20 However, some previous Korean cohort studies converse-ly showed that the prevalence of asthma increased with age.21,22 Thus, further studies should be performed to confirm the asso-ciation between the prevalence of asthma and age in Korea.
Second, occupation was a significant contributing factor for allergic diseases. The prevalence of at least 1 allergic disease for subjects in agriculture and fishery occupations (14.1%) or ser-Table 5. Univariate and multivariate analyses for positivity of specific immunoglobulin E to D. farinae
Variables Univariate analysis Multivariate analysis*
OR 95% CI P value OR 95% CI P value Sex <0.001 0.141 Male 1.000 - 1.000 Female 0.535 0.437-0.654 0.720 0.465-1.116 Age (year) <0.001 0.036 10-19 1.000 - - 20-29 1.169 0.814-1.679 - 30-39 0.779 0.562-1.079 1.000 40-49 0.529 0.372-0.751 0.611 0.431-0.867 50-59 0.685 0.469-1.001 0.785 0.551-1.119 ≥60 0.591 0.391-0.892 0.644 0.432-0.960 Occupation* 0.003 0.104 Professional job 1.000 - 1.000 Office job 0.725 0.451-1.165 0.618 0.373-1.025
Service, sales job 0.655 0.413-1.038 0.718 0.426-1.210
Agriculture and fisheries job 1.666 0.996-2.785 1.663 0.919-3.008
Technician, engineer 1.075 0.713-1.621 0.828 0.526-1.302 Labor worker 0.836 0.498-1.404 0.957 0.545-1.681 Jobless 0.618 0.409-0.933 0.788 0.484-1.282 BMI† 0.016 0.056 Normal 1.000 - 1.000 Low weight 0.493 0.290-0.838 0.377 0.154-0.921 Obesity 1.182 0.926-1.509 1.146 0.855-1.537 Smoking history† <0.001 0.093 Never smoker 1.000 - 1.000 Light smoker 0.593 0.468-0.753 1.102 0.460-2.643 Smoker 0.594 0.315-1.120 1.576 1.045-2.377
Serum vitamin D level 0.029 0.030
Low level (Q1) 1.000 - 1.000
Mod level (Q2-Q3) 0.827 0.858-1.535 0.731 0.524-1.020
High level (Q4) 1.148 0.658-1.040 1.072 0.692-1.662
Positivity to sIgE was defined as sIgE levels >0.35 kU/L. OR, odds ratio; CI, confidence interval; BMI, body mass index.
*Analysis included subjects aged ≥30 years (n=1,577, representing 9,624,008 citizens ≥30 years); †Analysis included subjects aged ≥19 years (n=1,977,
vice and sales occupations (20.4%) was significantly lower than that for those in other occupations (31.9%-36.5%; data not shown). Especially, an occupation related to agriculture and fisheries was a protective factor for allergic rhinitis in the multi-variate analysis, whereas it was an independent risk factor for the elevation of tIgE. Exposure to a farm environment has been considered protective against allergic diseases,23-25 whereas ex-posure to chemical agents in some occupations, including among technicians and labor workers, is a risk factor for allergic diseases.26 Thus, different occupational environments may af-fect the development of allergic disease.
Third, depression was significantly associated with allergic diseases, especially self-reported asthma (OR, 2.691; 95% CI,
1.280-5.655; P=0.009) and self-reported atopic dermatitis (OR, 2.549; 95% CI, 1.101-5.899; P=0.029). However, in contrast to the other factors described above, depression may not be a di-rect cause of allergic disease. The adverse effect of self-reported allergic disease on depression has already been well demon-strated in previous studies,12-14 and it is likely that depression may be induced or aggravated by allergic diseases rather than being a cause.
Lastly, glucose intolerance was found to be a significant risk factor for allergic rhinitis, whereas a higher level of education was protective for self-reported asthma. Previous studies have reported a significant correlation between diabetes and allergic diseases.15 However, evidence to confirm a significant causal re-Table 6. Univariate and multivariate analyses for positivity of specific immunoglobulin E to B. germanica
Variables Univariate analysis Multivariate analysis*
OR 95% CI P value OR 95% CI P value Sex <0.001 <0.001 Male 1.000 - 1.000 Female 0.365 0.282-0.473 0.307 0.193-0.489 Residence district 0.040 0.230 Urban 1.000 - 1.000 Suburban/rural 1.458 1.017-2.090 1.293 0.849-1.970 Type of residence <0.001 0.028 House 1.000 - 1.000 Apartment 0.583 0.446-0.761 0.682 0.484-0.959 Occupation* <0.001 0.221 Professional job 1.000 - 1.000 Office job 1.340 0.758-2.369 1.317 0.693-2.501
Service, sales job 1.107 0.616-1.988 1.359 0.701-2.635
Agriculture and fisheries job 2.256 1.272-4.003 1.761 0.902-3.437
Technician, engineer 1.823 1.058-3.140 1.341 0.720-2.469
Labor worker 2.114 1.084-4.121 2.500 1.219-5.127
Jobless 0.843 0.512-1.389 1.297 0.763-2.205
Glucose tolerance† <0.001 0.012
Normal 1.000 - 1.000
Impaired fasting glucose 1.748 1.237-2.470 1.413 0.958-2.084
Diabetes mellitus 2.418 1.555-3.761 1.928 1.182-3.147 BMI† <0.001 0.225 Normal 1.000 - 1.000 Low weight 0.346 0.128-0.935 0.274 0.055-1.363 Obesity 1.611 1.224-2.122 1.126 0.804-1.577 Smoking history† <0.001 0.972 Smoker 1.000 - 1.000 Light smoker 0.869 0.413-1.828 0.958 0.387-2.374 Never smoker 0.496 0.364-0.676 0.945 0.589-1.517
Positivity to sIgE was defined as IgE levels >0.35 kU/L. OR, odds ratio; CI, confidence interval; BMI, body mass index.
*Analysis included subjects aged ≥30 years (n=1,577, representing 9,624,008 citizens ≥30 years); †Analysis included subjects aged ≥19 years (n=1,977,
lationship between these conditions is still lacking. Similarly, while data regarding the effects of education level on self-re-ported asthma have been accumulated, the evidence is still in-sufficient.27,28
Interestingly, in the present study, we observed significant gaps between the tIgE level and the prevalence of allergic dis-ease. Male sex, obesity, and smoking were identified as signifi-cant risk factors for tIgE. The higher frequency of elevated tIgE in men supports the findings of previous studies.29,30 This result may be secondary to the correlations of alcohol consumption and/or parasitic infections with IgE, as heavy alcoholics and as-ymptomatic parasite-infected subjects are frequently observed in Korea, especially among men.31-33 Although the data are not shown, the positivity rate of tIgE increased with increasing alco-hol consumption amount in this study (37.1%, 50.5%, and 70.5% for subjects with ≤1, 2-3, and ≥4 events of alcohol con-sumption/week, respectively P<0.001). However, male sex was still a significant risk factor for positivity of tIgE even after ad-justing for the alcohol consumption amount in the multivariate analysis, indicating that male sex is an independent risk factor for positivity of tIgE regardless of alcohol consumption. The ef-fects of obesity34,35 and smoking36,37 on the tIgE level are also widely accepted, based on sufficient evidence. Of note, recent studies have revealed that the sIgE/tIgE ratio is more accurate than sIgE alone in predicting outcomes in food allergy, suggest-ing a protective effect of tIgE against allergic symptoms.38 How-ever, this topic remains controversial, with varying opinions,39,40 and some studies have suggested that the serum tIgE level is positively correlated with allergic disease.41-43
The factors associated with positivity of sIgE differed accord-ing to the type of allergen. Male sex and house residence were significant factors associated with positivity of sIgE to B.
ger-manica. These factors are associated with household hygiene
and have been previously reported as significant factors for sensitization to B. germanica. In addition, smoking was signifi-cantly associated with positivity of sIgE to dog; this result is also supported by other studies.44,45
Some of the associated factors identified in the present study are modifiable, and exposure or avoidance of these factors may help prevent allergen sensitization and development of allergic diseases. For example, early exposure to a farm-like environ-ment may help prevent allergic diseases. Hygiene-related fac-tors, including residing in an apartment, and glucose intoler-ance should be improved to avoid sensitization to cockroaches. In addition, avoidance of smoking and obesity may help pre-vent the development of allergic diseases.
The major strength of this study is that the data were obtained from a well-designed national program with complex, multi-stage probability sample extraction, and that we used complex sample analysis, resulting in the representation of 16,003,645 citizens, which is one-third of the total population of Korea. Al-though the KNHANES provides specific guidelines to ensure appropriate estimates and results due to the inherent nature of a multiple complex survey design, almost all research articles published on the basis of the data from the KNHANES used standard statistical analyses.46 We followed the KNHANES guidelines concerning the statistical analysis; this provided valuable information that can be generalized to the entire Kore-Table 7. Univariate and multivariate analyses for positivity of specific immunoglobulin E to dog
Variables Univariate analysis Multivariate analysis*
OR 95% CI P value OR 95% CI P value Sex <0.001 0.249 Male 1.000 - 1.000 Female 0.407 0.278-0.596 0.750 0.459-1.226 Age (year) 0.013 0.014 10-19 1.000 - 1.000 20-29 1.038 0.563-1.912 0.492 0.150-1.617 30-39 0.575 0.316-1.045 0.237 0.069-0.814 40-49 0.373 0.184-0.757 0.162 0.043-0.610 50-59 0.644 0.335-1.236 0.271 0.076-0.971 ≥60 0.411 0.200-0.846 0.186 0.050-0.685 Smoking history* 0.001 0.004 Never smoker 1.000 - 1.000 Light smoker 0.491 0.157-1.533 1.024 0.293-3.576 Smoker 0.385 0.234-0.636 2.423 1.416-4.145
Positivity to sIgE was defined as sIgE levels >0.35 kU/L. OR, odds ratio; CI, confidence interval.
an general population.
However, an important limitation of the present study is its cross-sectional design; because it was not a longitudinal study, the temporal relationship of the associated factors could not be evaluated. For example, we could not determine if smoking was a significant risk factor for allergic diseases or if subjects with allergic disease were at risk for smoking. Another limita-tion of this study is that the data in the multivariate analysis were assessed only for subjects who were older than 30 years. This was because we considered that the assessment of the subjects’ education level, marriage status, income level, and oc-cupation at that age was reliable. Third, most parameters, in-cluding allergic disease, occupation, and income level, were obtained using a self-reported survey. The prevalence of physi-cian-diagnosed allergic disease may differ from that of self-re-ported allergic disease. Similarly, self-reself-re-ported occupation and income level may be affected by the respondent’s judgment. Moreover, the residence district and occupation may also be af-fected by various parameters. For example, people who moved to a rural area recently after living in an urban area or who had a recent change in occupation might result in confusion. Lastly, although we could not conduct further analysis due to limited provided information, dividing the subjects into those with al-lergic asthma and non-alal-lergic asthma might provide interest-ing results, as the pathogeneses and treatments differ between these entities.47
In conclusion, demographic and environmental risk factors associated with the tIgE and sIgE levels, as well as with self-re-ported allergic diseases, differ according to the type of allergens and allergic diseases. The results of the present study suggest that appropriate management of numerous modifiable factors might help prevent allergen sensitization and development of allergic diseases. Further studies are warranted to confirm our findings and identify any causal relationships.
ACKNOWLEDGMENTS
This study was supported by a grant from the Korea Health-care Technology R&D Project, Ministry of Health and Welfare (A092076), and fund (2014-NI56001-00) by Research of Korea Centers for Disease Control and Prevention, Republic of Korea. The raw data of the Korea National Health and Nutrition Exam-ination Survey (KNHANES) were provided by the Korea Cen-ters for Disease Control and Prevention.
REFERENCES
1. Larsen FS, Holm NV, Henningsen K. Atopic dermatitis. A genetic-epidemiologic study in a population-based twin sample. J Am Acad Dermatol 1986;15:487-94.
2. Sicherer SH, Furlong TJ, Maes HH, Desnick RJ, Sampson HA, Gelb BD. Genetics of peanut allergy: a twin study. J Allergy Clin Immu-nol 2000;106:53-6.
3. Liu X, Zhang S, Tsai HJ, Hong X, Wang B, Fang Y, et al. Genetic and environmental contributions to allergen sensitization in a Chinese twin study. Clin Exp Allergy 2009;39:991-8.
4. Campbell DE, Boyle RJ, Thornton CA, Prescott SL. Mechanisms of allergic disease - environmental and genetic determinants for the development of allergy. Clin Exp Allergy 2015;45:844-58.
5. Ariano R, Berra D, Chiodini E, Ortolani V, Cremonte LG, Mazzarel-lo MG, et al. Ragweed allergy: pollen count and sensitization and allergy prevalence in two Italian allergy centers. Allergy Rhinol (Providence) 2015;6:177-83.
6. Park HJ, Lee JH, Park KH, Kim KR, Han MJ, Choe H, et al. A six-year study on the changes in airborne pollen counts and skin positivity rates in Korea: 2008-2013. Yonsei Med J 2016;57:714-20.
7. Song Y, Wang M, Xie J, Li W, Zhang X, Wang T, et al. Prevalence of allergic rhinitis among elementary and middle school students in Changsha city and its impact on quality of life. J Laryngol Otol 2015; 129:1108-14.
8. Lusi EA, Di Ciommo VM, Patrissi T, Guarascio P. High prevalence of nickel allergy in an overweight female population: a pilot obser-vational analysis. PLoS One 2015;10:e0123265.
9. Han YY, Forno E, Gogna M, Celedón JC. Obesity and rhinitis in a nationwide study of children and adults in the United States. J Al-lergy Clin Immunol 2016;137:1460-5.
10. Niruban SJ, Alagiakrishnan K, Beach J, Senthilselvan A. Associa-tion between vitamin D and respiratory outcomes in Canadian ad-olescents and adults. J Asthma 2015;52:653-61.
11. Kim Y. The Korea National Health and Nutrition Examination Sur-vey (KNHANES): current status and challenges. Epidemiol Health 2014;36:e2014002.
12. Chun YH, Han K, Park YG, Yoon JS, Kim HH, Kim JT, et al. Examining impacts of allergic diseases on psychological problems and tobacco use in Korean adolescents: the 2008-2011 Korean National Health and Nutrition Examination Survey. PLoS One 2015;10: e0125172. 13. Lu Y, Mak KK, van Bever HP, Ng TP, Mak A, Ho RC. Prevalence of
anxiety and depressive symptoms in adolescents with asthma: a meta-analysis and meta-regression. Pediatr Allergy Immunol 2012; 23:707-15.
14. Kim DH, Han K, Kim SW. Relationship between allergic rhinitis and mental health in the general Korean adult population. Allergy Asthma Immunol Res 2016;8:49-54.
15. Fukui M, Tanaka M, Hamaguchi M, Senmaru T, Sakabe K, Shiraishi E, et al. Eosinophil count is positively correlated with albumin ex-cretion rate in men with type 2 diabetes. Clin J Am Soc Nephrol 2009; 4:1761-5.
16. Park HJ, Lim HS, Park KH, Lee JH, Park JW, Hong CS. Changes in allergen sensitization over the last 30 years in Korea respiratory al-lergic patients: a single-center. Allergy Asthma Immunol Res 2014; 6:434-43.
17. Salo PM, Arbes SJ Jr, Jaramillo R, Calatroni A, Weir CH, Sever ML, et al. Prevalence of allergic sensitization in the United States: re-sults from the National Health and Nutrition Examination Survey (NHANES) 2005-2006. J Allergy Clin Immunol 2014;134:350-9. 18. Hwang CY, Chen YJ, Lin MW, Chen TJ, Chu SY, Chen CC, et al.
Prevalence of atopic dermatitis, allergic rhinitis and asthma in Tai-wan: a national study 2000 to 2007. Acta Derm Venereol 2010;90: 589-94.
19. Vasto S, Malavolta M, Pawelec G. Age and immunity. Immun Age-ing 2006;3:2.
associated with a subsequent risk of peripheral artery disease: a longitudinal population-based study. Medicine (Baltimore) 2016; 95:e2546.
21. Kim S, Kim J, Kim K, Kim Y, Park Y, Baek S, et al. Healthcare use and prescription patterns associated with adult asthma in Korea: anal-ysis of the NHI claims database. Allergy 2013;68:1435-42.
22. Kim CY, Park HW, Ko SK, Chang SI, Moon HB, Kim YY, et al. The fi-nancial burden of asthma: a nationwide comprehensive survey conducted in the republic of Korea. Allergy Asthma Immunol Res 2011;3:34-8.
23. von Mutius E, Vercelli D. Farm living: effects on childhood asthma and allergy. Nat Rev Immunol 2010;10:861-8.
24. Smit LA, Heederik D, Doekes G, Lammers JW, Wouters IM. Occu-pational endotoxin exposure reduces the risk of atopic sensitiza-tion but increases the risk of bronchial hyperresponsiveness. Int Arch Allergy Immunol 2010;152:151-8.
25. Elholm G, Schlünssen V, Doekes G, Basinas I, Bibby BM, Hjort C, et al. Become a farmer and avoid new allergic sensitization: adult farming exposures protect against new-onset atopic sensitization. J Allergy Clin Immunol 2013;132:1239-41.
26. Prodi A, Rui F, Fortina AB, Corradin MT, Filon FL. Occupational sensitization to epoxy resins in Northeastern Italy (1996-2010). Int J Occup Environ Health 2015;21:82-7.
27. Zhao HJ, Cai SX, Tong WC, Li WJ, Fu L. Influence of education level on self-evaluation and control of patients with bronchial asthma. Nan Fang Yi Ke Da Xue Xue Bao 2008;28:715-7.
28. Lee KS, Rha YH, Oh IH, Choi YS, Choi SH. Socioeconomic and so-ciodemographic factors related to allergic diseases in Korean ado-lescents based on the Seventh Korea Youth Risk Behavior Web-based Survey: a cross-sectional study. BMC Pediatr 2016;16:19. 29. Ezeamuzie CI, Al-Ali SF, Al-Dowaisan A, Khan M, Hijazi Z,
Thom-son MS. Reference values of total serum IgE and their significance in the diagnosis of allergy among the young adult Kuwaiti popula-tion. Clin Exp Allergy 1999;29:375-81.
30. Paula Couto TA, Falsarella N, Mattos Cde C, Mattos LC. Total IgE plasma levels vary according to gender and age in Brazilian pa-tients with allergic rhinitis. Clinics (Sao Paulo) 2014;69:740-4. 31. Linneberg A, Petersen J, Nielsen NH, Madsen F, Frølund L, Dirksen
A, et al. The relationship of alcohol consumption to total immuno-globulin E and the development of immunoimmuno-globulin E sensitiza-tion: the Copenhagen Allergy Study. Clin Exp Allergy 2003;33:192-8.
32. Song WJ, Chang YS, Lim MK, Yun EH, Kim SH, Kang HR, et al. Staphylococcal enterotoxin sensitization in a community-based population: a potential role in adult-onset asthma. Clin Exp Allergy 2014;44:553-62.
33. Lee JY, Yang MH, Hwang JH, Kang M, Paeng JW, Yune S, et al. The prevalence of toxocariasis and diagnostic value of serologic tests in asymptomatic Korean adults. Allergy Asthma Immunol Res 2015;
7:467-75.
34. Visness CM, London SJ, Daniels JL, Kaufman JS, Yeatts KB, Siega-Riz AM, et al. Association of obesity with IgE levels and allergy symptoms in children and adolescents: results from the National Health and Nutrition Examination Survey 2005-2006. J Allergy Clin Immunol 2009;123:1163-9, 1169.e1-4
35. Schachter LM, Peat JK, Salome CM. Asthma and atopy in over-weight children. Thorax 2003;58:1031-5.
36. Holford-Strevens V, Warren P, Wong C, Manfreda J. Serum total im-munoglobulin E levels in Canadian adults. J Allergy Clin Immunol 1984;73:516-22.
37. Barbee RA, Halonen M, Kaltenborn W, Lebowitz M, Burrows B. A longitudinal study of serum IgE in a community cohort: correla-tions with age, sex, smoking, and atopic status. J Allergy Clin Im-munol 1987;79:919-27.
38. Gupta RS, Lau CH, Hamilton RG, Donnell A, Newhall KK. Predict-ing outcomes of oral food challenges by usPredict-ing the allergen-specific IgE-total IgE ratio. J Allergy Clin Immunol Pract 2014;2:300-5. 39. Grabenhenrich L, Lange L, Härtl M, Kalb B, Ziegert M, Finger A, et
al. The component-specific to total IgE ratios do not improve pea-nut and hazelpea-nut allergy diagnoses. J Allergy Clin Immunol 2016; 137:1751-1760.e8.
40. Daniluk U, Alifier M, Kaczmarski M, Stasiak-Barmuta A, Lebensz-tejn D. Longitudinal observation of children with enhanced total serum IgE. Ann Allergy Asthma Immunol 2015;114:404-410.e4. 41. Benício MH, Ferreira MU, Cardoso MR, Konno SC, Monteiro CA.
Wheezing conditions in early childhood: prevalence and risk fac-tors in the city of São Paulo, Brazil. Bull World Health Organ 2004; 82:516-22.
42. Satwani H, Rehman A, Ashraf S, Hassan A. Is serum total IgE levels a good predictor of allergies in children? J Pak Med Assoc 2009;59: 698-702.
43. Kim SH, Yang SY, You J, Lee SB, You J, Chang YS, et al. Association of specific immunoglobulin e to staphylococcal enterotoxin with airway hyperresponsiveness in asthma patients. Tuberc Respir Dis (Seoul) 2016;79:295-301.
44. Adisesh A, Gruszka L, Robinson E, Evans G. Smoking status and immunoglobulin E seropositivity to workplace allergens. Occup Med (Lond) 2011;61:62-4.
45. Shargorodsky J, Garcia-Esquinas E, Navas-Acien A, Lin SY. Allergic sensitization, rhinitis, and tobacco smoke exposure in U.S. children and adolescents. Int Forum Allergy Rhinol 2015;5:471-6.
46. Kim Y, Park S, Kim NS, Lee BK. Inappropriate survey design analy-sis of the Korean National Health and Nutrition Examination Sur-vey may produce biased results. J Prev Med Public Health 2013;46: 96-104.
47. Kim DK, Park YB, Oh YM, Jung KS, Yoo JH, Yoo KH, et al. Korean Asthma Guideline 2014: summary of major updates to the Korean Asthma Guideline 2014. Tuberc Respir Dis (Seoul) 2016;79:111-20.