Background: Hypotension is a common phenomenon after spinal anesthesia in hypertensive patients. We investigated
whether heart rate variability could predict the occurrence of hypotension after spinal anesthesia in hypertensive pa-tients.
Methods: Forty-one patients undergoing spinal anesthesia were included. Heart rate variability was measured at five
dif-ferent time points such as before fluid loading (baseline), after fluid loading as well as 5 min, 15 min and 30 min after spinal anesthesia. Fluid loading was performed using 5 ml/kg of a crystalloid solution. Baseline total power and low to high fre-quency ratio (LF/HF) in predicting hypotension after spinal anesthesia were analyzed by calculating the area under the receiver operating characteristic curves (AUC).
Results: Moderate hypotension, defined as a decrease of mean arterial pressure to below 20-30% of the baseline, occurred
in 13 patients and severe hypotension, defined as a decrease of mean arterial pressure greater than 30% below the baseline, occurred in 7 patients. LF/HF ratiosand total powers did not significantly change after spinal anesthesia. AUCs of LF/HF ratio for predicting moderate hypotension was 0.685 (P = 0.074), severe hypotension was 0.579 (P = 0.560) and moderate or severe hypotension was 0.652 (P = 0.101), respectively. AUCs of total power for predicting moderate hypotension was 0.571 (P = 0.490), severe hypotension was 0.672 (P = 0.351) and moderate or severe hypotension was 0.509 (P = 0.924), respectively.
Conclusions: Heart rate variability is not a reliable predictor of hypotension after spinal block in hypertensive patients
whose sympathetic activity is already depressed. (Korean J Anesthesiol 2013; 65: 317-321)
Key Words: Hypertension, Hypotension, Parasympathetic nervous system, Spinal anesthesia, Sympathetic nervous system.
Heart rate variability as a predictor of hypotension after
spinal anesthesia in hypertensive patients
Tae Dong Kweon
1, So Yeon Kim
1, Sung Ah Cho
2, Ji Hoon Kim
2, Young Ran Kang
2, and Yang-Sik Shin
11Department of Anesthesiology and Pain Medicine, Anesthesia and Pain Research Institute, Yonsei University College of Medicine, 2Department of Anesthesiology and Pain Medicine, Yonsei University College of Medicine, Seoul, Korea
Received: January 2, 2013. Revised: 1st, February 27, 2013; 2nd, March 18, 2013; 3rd, April 11, 2013. Accepted: April 24, 2012.
Corresponding author: Yang-Sik Shin, M.D., Department of Anesthesiology and Pain Medicine, Anesthesia and Pain Research Institute, Yonsei University College of Medicine, 50, Yonsei-ro, Seodaemun-gu, Seoul 120-752, Korea. Tel: 82-2-2227-3831, Fax: 82-2-2227-7897, E-mail: ysshin@ yuhs.ac
This is an open-access article distributed under the terms of the Creative Commons Attribution Non-Commercial License (http:// creativecommons.org/licenses/by-nc/3.0/), which permits unrestricted non-commercial use, distribution, and reproduction in any medium, provided the original work is properly cited.
Introduction
Hypotension, the most common side effect after spinal an-esthesia [1], occurs more frequently in geriatric patients with hypertension [2,3]. Decrease in systemic vascular resistance by sympathetic blockades is one of the major mechanism responsi-ble for hypotension after a spinal block [4]. The incidence of hy-potension after spinal anesthesia is 2.2 times higher in patients with hypertension and 2.9 times higher in patients taking beta-blockers than in patients without these conditions [2,3].
There have been many attempts to minimize the prevalence of hypotension in patients under spinal anesthesia [5,6]. In ad-dition, recent research has been carried out to predict the occur-rence of hypotension after spinal anesthesia [7-11]. Heart rate variability (HRV) has been validated as a predictor of hypoten-sion from several researchers [9-12]. However, there are no stud-ies on the use of HRV to predict hypotension in hypertensive patients after spinal anesthesia. Here, we evaluated the ability of using HRV parameters to predict the occurrence of hypotension after spinal anesthesia in hypertensive patients.
Materials and Methods
After obtaining approval from the Institutional Review Board and informed consent, 41 hypertensive patients undergoing spi-nal blockades for elective surgeries were included in this study. These patients received antihypertensive medication for at least six months. Patients with cardiac arrhythmias, coagulopathies and spinal surgery histories were excluded from this study. HRV measurement
HRV was performed according to the guideline of European Society of Cardiology and the North American Society of Pac-ing and Electrophysiology [13]. Five-minute recordPac-ings of the fast R waves on the electrocardiograms were detected with a sample rate of 1024 Hz. Power spectrum densities were calculat-ed for total power, low frequencies (LF: 0.04-0.15 Hz), and high frequencies (HF: 0.15-0.4 Hz) in normalized units. LF reflects sympathetic and parasympathetic control and HF reflects para-sympathetic control [14]. The ratio of absolute values of LF and HF (LF/HF) has been reported to correlate with sympathovagal balance [15]. Data was obtained using PowerLab (AD Instru-ments, Castle Hill, Australia) and automatically stored on the computer, with artifacts processed by computer-based detection.
HRV was measured at five different time points: before fluid loading (T0, baseline), after fluid loading (T1), 5 min after spinal anesthesia (T2), 15 min after spinal anesthesia (T3) and 30 min after spinal anesthesia (T4). All measurements were taken car-ried out when the patients were in supine position. Fluid loading
was performed with 5 ml/kg of a crystalloid solution. Spinal blockade
Spinal blockade was performed after fluid loading with no premedication. The puncture sites were either the intervertebral space L3-4 or L4-5 with reference to Tuffier’s line with the patients
in the lateral decubitus position. Injection of 12-13 mg of 0.5% hyperbaric bupivacaine was carried out through a 27 G Sporette needle for spinal-epidural blockades and with a 25 G Whitacre needle for spinal blockades. The patients were placed in a supine position immediately after regional blockade. The level of sen-sory blockade was tested with pinpricks at five-minute intervals. We categorized the severity of hypotension into three groups such as mild (a decrease of mean arterial pressure 20% below the baseline), moderate (a decrease of mean arterial pressure 20-30% below the baseline) and severe (a decrease of mean arterial greater than 30% below the baseline) [11]. In cases of moderate and severe hypotension, 8 mg ephedrine was administered in increments with 100 ml fluid loading.
Statistical analysis
Statistical analyses were performed using SPSS 12 for Win-dows (SPSS Inc, Chicago, IL, USA). A Shapiro-Wilk test was performed to verify the normality of the distribution. Sample size calculations were performed with the following data: two-sided α of 5% and power of 80%, and area under the receiver operating characteristic (ROC) curve (AUC) value = 0.7. This generated an estimate of 41 patients.
Parametric data are expressed as mean ± SD and nonpara-metric data are expressed median (range). Repeated measured analysis of variance with Bonferroni corrections were used to compare the blood pressure, heart rate and LF/HF ratios throughout the study period. Repeated measured total powers were analyzed using Kruskal-Wallis test. ROC curve analysis was used to clarify the validation of baseline LF/HF ratio and total power as a predictor for hypotension after spinal block-ade. The AUC of each value were compared with a value of 0.5, which means that the predictive performance of the indicator is no better than chance. P < 0.05 was considered statistically signi ficant.
Results
A total of 41 patients completed the study according to the study protocol. Among them, 33 patients received combined epidural spinal anesthesia for a total knee replacement and eight patients received spinal anesthesia for arthroscopy, total hip re-placementor osteotomy. Patient characteristics (preoperative
hy-pertensive medications and other combined disease) are shown in Table 1.
The median peak block level was T6 (range: T10-T1).
Moder-ate hypotension occurred in 13 patients and severe hypotension was in 7 patients. Blood pressure decreased significantly after spinal block, however, heart rate and LF/HF ratio and total power did not change during the study period (Table 2). LF/
HF ratio and total power during study period were not different among the patients who experienced no hypotension, moderate hypotension and severe hypotension.
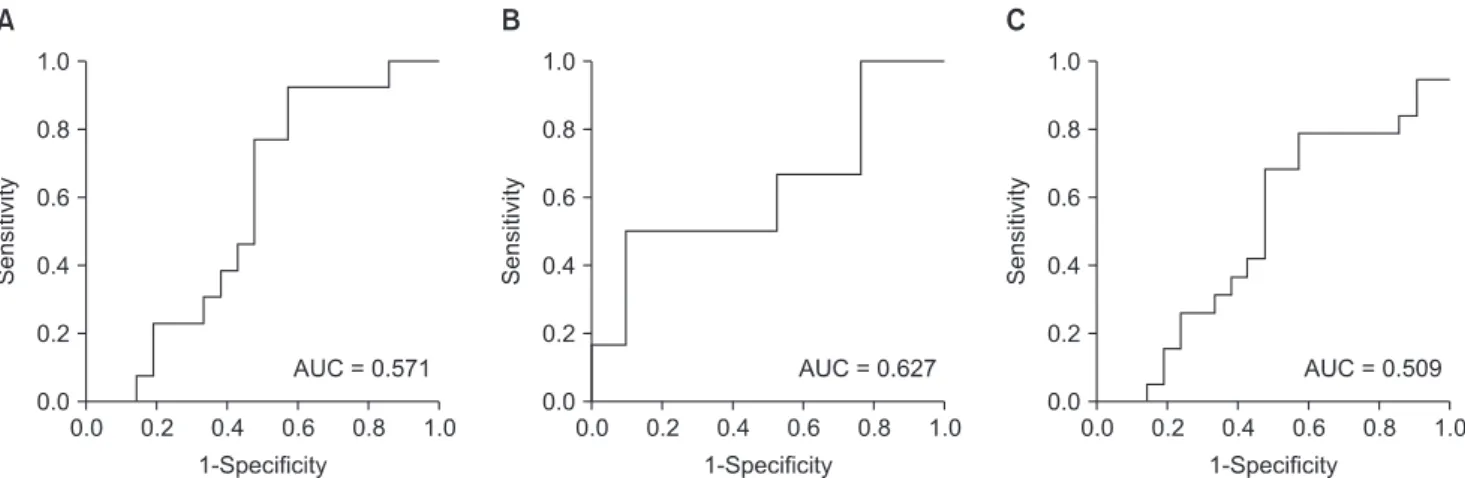
AUCs of LF/HF ratio for predicting moderate hypotension was 0.685 (P = 0.074), severe hypotension was 0.579 (P = 0.560) and moderate or severe hypotension was 0.652 (P = 0.101), re-spectively (Fig. 1). AUCs of total power for predicting moderate hypotension was 0.571 (P = 0.490), severe hypotension was 0.672 (P = 0.351) and moderate or severe hypotension was 0.509 (P = 0.924), respectively (Fig. 2).
Discussion
We found that total power and LF/HF ratio did not predict moderate or severe hypotension after spinal anesthesia in hyper-tensive patients. We also found that the incidence of hypoten-sion remains high despite volume loading was performed before the spinal blocks.
Several studies suggest that hypotension during spinal an-esthesia may cause several adverse events such as delirium and coronary ischemia [16,17], hence, there is an imperative need for more aggressive methods to prevent hypotension and a novel reliable predictor might be necessary for safe spinal anesthesia
Table 1. Patient Characteristics
Patients (n = 41) Age (yr)
Sex (M/F) Weight (kg) Height (cm)
Duration of hypertension (yr) Medications for hypertension Calcium channel blocker ACE inhibitor
Angiotensin receptor blocker Beta blocker
Diuretics Diabetes mellitus
Coronary artery occlusive disease
67 ± 9 2/39 64 ± 10 153 ± 6 8 ± 6 33 3 13 12 11 10 2
Data are expressed as mean ± SD or numbers of the patients. ACE: angio-tensin converting enzyme.
Table 2. Hemodynamic and LF/HF Ratio Changes
T0 T1 T2 T3 T4 MAP Heart rate LF/HF ratio Total power 96 ±14 69 ± 10 1.28 ± 1.32 1031 (597-5486) 100 ± 15 69 ± 9 1.22 ± 1.61 1049 (654-2154) 82 ± 12* 70 ± 13 1.10 ± 1.12 1511 (724-4908) 82 ±13* 68 ± 11 0.97 ± 0.73 1455 (774-4021) 84 ± 12* 66 ± 10 1.19 ± 0.98 1605 (684-4177) Values are expressed as mean ± SD or median (IQR). MAP: mean arterial pressure, LF/HF ratio: low to high frequency ratio, T0: before fluid loading, T1: after fluid loading, T2: 5 min after spinal anesthesia, T3: 15 min after spinal anesthesia, T4: 30 min after spinal anesthesia. *P < 0.01 compared with the T0 time point.
Fig. 1. Receiver operating characteristic curves of baseline low to high frequency ratio in predicting (A) moderate hypotension, (B) severe hypotension,
in hypertensive patients.
HRV as a predictor for hypotension after spinal anesthesia was introduced by Chamchad et al. [18] and it has been vali-dated as a predictor of hypotension after spinal anesthesia with high sensitivity and specificity [9-11]. In a previous report, a LF/ HF ratio above 2.5 predicted hypotension with an accuracy of around 85% [11]. In that study, 39 out of 70 patients had LF/HF ratios > 2.5 and in another study, 48 out of 100 patients had LF/ HF ratios > 2.5 [4,11]. These results are contrary to our findings, as only 5 out of 41 patients had LF/HF ratios > 2.5. This different result may be due to differences in patient samples. A possible explanation could be the suppression of sympathetic activity by anti-hypertensive medication in our patients.
It has been reported that spinal anesthesia decreases the LF/ HF ratio only in patients with baseline LF/HF > 2.5, not in pa-tients with baseline LF/HF < 2.5 [4]. Since most of the papa-tients in our study had baseline LF/HF < 2.5, the mean LF/HF ratio did not significantly change after spinal anesthesia. Therefore, HRV may be inappropriate for predicting hypotension in condi-tions in which sympathetic activity is already depressed, such as in hypertensive patients.
The use of total power as a parameter of HRV was also vali-dated as a reliable tool in identifying patients at high risk for a hemodynamic event during general anesthesia [12]. This study included patients who had a history of congestive heart failure, cardiovascular disorders, insulin use, which is similar to our study patients in some degree. However, we did not find total power to be a significant predictor of hypotension in our study. This discrepancy may be explained by the fact that total power of HRV is known to reflect overall autonomic status. Therefore, total power is markedly decreased during general anesthesia compared to spinal anesthesia [12]. Spinal anesthesia mainly af-fects sympathetic activity, which is dependent on the block level and compensatory sympathetic activity, in contrary to general
anesthesia, which may attenuate the activity of both sympathetic and parasympathetic activity and compensatory autonomic re-sponses in a consistent manner.
Generally, hypotension after spinal block is dependent on factors such as the pre-operative autonomic balance, history of hypertension, hydration, and spinal block level [2-4,11]. Based on our results, if patients are older and have cardiovascular con-ditions such as hypertension, the autonomic sympathetic activ-ity before the spinal blockade may have limited capabilactiv-ity for predicting hypotension. Therefore, other markers for predicting hypotension in hypertensive patients are needed.
In addition, more aggressive management to reduce the in-cidence of hypotension is required since more than 50% of the patients had moderate or severe hypotension, even though fluid was administered before the spinal block.
There are several limitations to this study. First, the degree of sympathetic blockade was diverse because of broad spinal block level (T10-T1). Second, many factors affecting HRV were
included in this study. Diabetes mellitus, ischemic heart disease, antihypertensive medications and spontaneous respiration have been reported to affect HRV [19-25]. In addition, preoperative anxiety could influence baseline HRV because psychological stress, depressive and anxiety disorders are associated with re-duced HRV [26,27].
In conclusion, HRV may be not used to predict the occur-rence of hypotension after spinal block in hypertensive patients. In addition, it is necessary to take further precautions to prevent hypotension before spinal block in hypertensive patients.
Acknowledgments
The authors would like to thank the biostatisticians in the Department of Research Affairs, Yonsei University College of Medicine, for their statistical comments and analysis.
Fig. 2. Receiver operating characteristic curves of baseline total power and in predicting (A) moderate hypotension, (B) severe hypotension, and (C)
References
1. Brown AG, Visram AR, Jones RD, Irwin MG, Bacon-Shone J. Preoperative and postoperative oxygen saturation in the elderly following spinal or general anaesthesia--an audit of current practice. Anaesth Intensive Care 1994; 22: 150-4.
2. Carpenter RL, Caplan RA, Brown DL, Stephenson C, Wu R. Incidence and risk factors for side effects of spinal anesthesia. Anesthesiology 1992; 76: 906-16.
3. Hartmann B, Junger A, Klasen J, Benson M, Jost A, Banzhaf A, et al. The incidence and risk factors for hypotension after spinal anesthesia induction: an analysis with automated data collection. Anesth Analg 2002; 94: 1521-9.
4. Hanss R, Ohnesorge H, Kaufmann M, Gaupp R, Ledowski T, Steinfath M, et al. Changes in heart rate variability may reflect sympatholysis during spinal anaesthesia. Acta Anaesthesiol Scand 2007; 51: 1297-304.
5. Critchley LA. Hypotension, subarachnoid block and the elderly patient. Anaesthesia 1996; 51: 1139-43.
6. McCrae AF, Wildsmith JA. Prevention and treatment of hypotension during central neural block. Br J Anaesth 1993; 70: 672-80.
7. Frolich MA, Caton D. Baseline heart rate may predict hypotension after spinal anesthesia in prehydrated obstetrical patients. Can J Anaesth 2002; 49: 185-9.
8. Fujiwara Y, Sato Y, Shibata Y, Asakura Y, Nishiwaki K, Komatsu T. A greater decrease in blood pressure after spinal anaesthesia in patients with low entropy of the RR interval. Acta Anaesthesiol Scand 2007; 51: 1161-5.
9. Hanss R, Bein B, Francksen H, Scherkl W, Bauer M, Doerges V, et al. Heart rate variability-guided prophylactic treatment of severe hypotension after subarachnoid block for elective cesarean delivery. Anesthesiology 2006; 104: 635-43.
10. Hanss R, Bein B, Ledowski T, Lehmkuhl M, Ohnesorge H, Scherkl W, et al. Heart rate variability predicts severe hypotension after spinal anesthesia for elective cesarean delivery. Anesthesiology 2005; 102: 1086-93.
11. Hanss R, Bein B, Weseloh H, Bauer M, Cavus E, Steinfath M, et al. Heart rate variability predicts severe hypotension after spinal anesthesia. Anesthesiology 2006; 104: 537-45.
12. Hanss R, Renner J, Ilies C, Moikow L, Buell O, Steinfath M, et al. Does heart rate variability predict hypotension and bradycardia after induction of general anaesthesia in high risk cardiovascular patients? Anaesthesia 2008; 63: 129-35.
13. Heart rate variability: standards of measurement, physiological interpretation and clinical use. Task Force of the European Society of Cardiology and the North American Society of Pacing and Electrophysiology. Circulation 1996; 93: 1043-65.
14. Kimura T, Komatsu T, Hirabayashi A, Sakuma I, Shimada Y. Autonomic imbalance of the heart during total spinal anesthesia evaluated by spectral analysis of heart rate variability. Anesthesiology 1994; 80: 694-8.
15. Pagani M, Lombardi F, Guzzetti S, Rimoldi O, Furlan R, Pizzinelli P, et al. Power spectral analysis of heart rate and arterial pressure variabilities as a marker of sympatho-vagal interaction in man and conscious dog. Circ Res 1986; 59: 178-93.
16. Monk TG, Saini V, Weldon BC, Sigl JC. Anesthetic management and one-year mortality after noncardiac surgery. Anesth Analg 2005; 100: 4-10.
17. Williams-Russo P, Sharrock NE, Mattis S, Liguori GA, Mancuso C, Peterson MG, et al. Randomized trial of hypotensive epidural anesthesia in older adults. Anesthesiology 1999; 91: 926-35.
18. Chamchad D, Arkoosh VA, Horrow JC, Buxbaum JL, Izrailtyan I, Nakhamchik L, et al. Using heart rate variability to stratify risk of obstetric patients undergoing spinal anesthesia. Anesth Analg 2004; 99: 1818-21.
19. Malpas SC, Maling TJ. Heart-rate variability and cardiac autonomic function in diabetes. Diabetes 1990; 39: 1177-81.
20. Bigger JT Jr, Fleiss JL, Steinman RC, Rolnitzky LM, Kleiger RE, Rottman JN. Correlations among time and frequency domain measures of heart period variability two weeks after acute myocardial infarction. Am J Cardiol 1992; 69: 891-8.
21. Bigger JT Jr, Kleiger RE, Fleiss JL, Rolnitzky LM, Steinman RC, Miller JP. Components of heart rate variability measured during healing of acute myocardial infarction. Am J Cardiol 1988; 61: 208-15.
22. Bonaduce D, Marciano F, Petretta M, Migaux ML, Morgano G, Bianchi V, et al. Effects of converting enzyme inhibition on heart period variability in patients with acute myocardial infarction. Circulation 1994; 90: 108-13.
23. Cook JR, Bigger JT Jr, Kleiger RE, Fleiss JL, Steinman RC, Rolnitzky LM. Effect of atenolol and diltiazem on heart period variability in normal persons. J Am Coll Cardiol 1991; 17: 480-4.
24. Pöyhönen M, Syväoja S, Hartikainen J, Ruokonen E, Takala J. The effect of carbon dioxide, respiratory rate and tidal volume on human heart rate variability. Acta Anaesthesiol Scand 2004; 48: 93-101.
25. Huang CJ, Kuok CH, Kuo TB, Hsu YW, Tsai PS. Pre-operative measurement of heart rate variability predicts hypotension during general anesthesia. Acta Anaesthesiol Scand 2006; 50: 542-8.
26. Gorman JM, Sloan RP. Heart rate variability in depressive and anxiety disorders. Am Heart J 2000; 140(4 Suppl): 77-83.
27. Shapiro PA, Sloan RP, Bigger JT Jr, Bagiella E, Gorman JM. Cardiac denervation and cardiovascular reactivity to psychological stress. Am J Psychiatry 1994; 151: 1140-7.