Fasting glucose level and the risk of
incident cardiovascular disease, stroke
and all-cause mortality among
nondiabetic Koreans
Chanshin Park
Department of Medicine
Fasting glucose level and the risk of
incident cardiovascular disease, stroke
and all-cause mortality among
nondiabetic Koreans
Directed by Professor Duk-Chul Lee
The Master's Thesis
submitted to the Department of Medicine,
the Graduate School of Yonsei University
in partial fulfillment of the requirements for the degree
of Master of Medical Science
Chanshin Park
This certifies that the Master's Thesis of
Chanshin Park is approved.
---
Thesis Supervisor: Duk-Chul Lee
---
Thesis Committee Member#1: Sun Ha Jee
---
Thesis Committee Member#2: Yangsoo Jang
The Graduate School
Yonsei University
ACKNOWLEDGEMENTS
After so many years of detour, I came back as a
medical student. I am so grateful to professor
Duk-Chul Lee for supervising me though this thesis.
I also express deep appreciation from the bottom of
my heart to professor Sun-Ha Jee, who provided me
this wonderful opportunity to research KCPS data.
Thanks also go to Heeyeon Lee who helped analysis
of data. Above all I attribute all my joy to my
devoted parents and loving husband who insisted
and supported me to continue graduate school.
i
<TABLE OF CONTENTS>
ABSTRACT --- 1
I. INTRODUCTION --- 2
1. Impaired fasting glucose and the risk of cardiovascular disease
and mortality --- 2
2. Low fasting glucose and the risk of cardiovascular disease and
mortality --- 3
3. The purpose of this study --- 4
II. MATERIALS AND METHODS --- 5
1. Study participants --- 5
2. Data collection --- 6
3. Statistical analysis --- 7
III. RESULTS --- 8
1. General characteristics of the study participants --- 8
2. Incidence and mortality of cardiovascular disease --- 10
3. Incidence and mortality of ischemic heart disease --- 13
4. Incidence and mortality of stroke --- 15
5. All-cause mortality --- 20
IV. DISCUSSION --- 21
1. Impaired fasting glucose and cardiovascular disease --- 21
2. Low fasting glucose and cardiovascular disease --- 24
3. Sex difference and ischemic stroke --- 25
4. Limitations of this study --- 26
V. CONCLUSION --- 27
REFERENCES --- 28
ii
LIST OF FIGURES
Figure 1. Fasting glucose level and incidence of cardiovascular disease
--- 11
Figure 2. Fasting glucose level and incidence of ischemic heart disease
--- 13
Figure 3. Fasting glucose level and incidence of stroke --- 17
Figure 4. Fasting glucose level and all-cause mortality --- 21
LIST OF TABLES
Table 1. Baseline characteristics of the study population --- 8
Table 2. General characteristics in categories of fasting serum glucose
level --- 9
Table 3. Incidence and mortality of cardiovascular disease in total
cohort --- 11
Table 4. Incidence and mortality of cardiovascular disease in men--- 12
Table 5. Incidence and mortality of cardiovascular disease in women
--- 12
Table 6. Incidence and mortality of ischemic heart disease in total
cohort --- 13
Table 7. Incidence and mortality of ischemic heart disease in men -- 14
Table 8. Incidence and mortality of ischemic heart disease in women
--- 14
Table 9. Incidence and mortality of stroke in total cohort --- 16
Table 10. Incidence and mortality of stroke in men --- 18
Table 11. Incidence and mortality of stroke in women --- 19
Table 12. Fasting glucose level and all-cause mortality in total cohort
--- 20
<ABSTRACT>
Fasting glucose level and the risk of incident cardiovascular disease,
stroke and all-cause mortality among nondiabetic Koreans
Chanshin Park
Department of Medicine
The Graduate School, Yonsei University
(Directed by Professor Duk-Chul Lee)
It is well established that diabetes increases the risk of cardiovascular disease and mortality. However, the relationships between mortality and both nondiabetic hyperglycemia and low fasting glucose level have been less clear. To assess this relationship, a prospective cohort study of more than one million Koreans was conducted over 10 years. A total of 1,213,829 Korean people who had not been diagnosed with specific medical conditions were grouped according to their baseline fasting serum glucose level. Each of the relationships between fasting glucose level and the risk of cardiovascular disease incidence and mortality, stroke incidence and mortality, and all-cause mortality exhibited J-shaped curves after multivariate adjustment for age, body mass index, systolic blood pressure, total cholesterol, ALT, alcohol drinking, smoking status and physical activity. There was no evidence of a J-shaped curve for ischemic heart disease. The incidence or mortality of ischemic heart disease increased from at fasting glucose level above 110 mg/dl, but no significant change was shown at the low blood sugar level. In conclusion, fasting sugar level below 70 mg/dl increases the risk of cardiovascular incidence (HR 1.06, 1.02-1.09) and mortality (HR 1.19, 1.10-1.27), thrombotic stroke incidence (HR 1.11, 1.05-1.18) and mortality (HR 1.26, 1.06-1.49), and all-cause mortality (HR 1.07, 1.04-1.10). Fasting glucose level between 100 to 109 mg/dl also increases the risk of cardiovascular disease, thrombotic stroke, and all-cause mortality, but the risk of 100 to 109 mg/dl is lower than the risk of 110 to 125 mg/dl. The HR was higher in women than men especially in ischemic stroke. Both low glucose level and impaired fasting glucose should be considered as a predictor of cardiovascular risk and more attention should be paid to women’s abnormal fasting glucose level than men’s.
---
Key words: glucose, cardiovascular disease, stroke, cerebral infarction, ischemic heart disease, mortality, risk factors
Fasting glucose level and the risk of incident cardiovascular disease,
stroke and all-cause mortality among nondiabetic Koreans
Chanshin Park
Department of Medicine
The Graduate School, Yonsei University
(Directed by Professor Duk-Chul Lee)
I. INTRODUCTION
1. Impaired fasting glucose and the risk of cardiovascular disease and mortality
In 1997 the American Diabetes Association (ADA) lowered diagnostic criteria of fasting plasma glucose (FPG) level for diabetes mellitus from 140 mg/dl to 126 mg/dl on the grounds that the prevalence and incidence of diabetic retinopathy begin to increase at approximately a FPG of 125 mg/dl.1 ADA also
recommended using a new category of impaired fasting glucose (IFG) for fasting plasma glucose level 110 to 125 mg/dl in 1997. Then, ADA lowered the criteria for IFG from 110 to 100 mg/dl in 2003 in an effort to better identify individuals at future diabetes
risk and also to improve selection of individuals at risk for coronary heart disease.1, 2
Diabetes mellitus is a well established risk factor of all-cause and cardiovascular disease mortality.3
Also, nondiabetic hyperglycemia has become increasingly recognized as a risk factor for cardiovascular disease.3, 4
However, the roles of impaired fasting glucose and impaired glucose tolerance in the elevation of cardiovascular disease risk or mortality have not been clear.5-8
Several studies showed that impaired glucose tolerance (IGT) is a risk factor for cardiovascular disease (CVD) mortality.9, 10
The Australian Diabetes, Obesity and Lifestyle Study (AusDiab) found known diabetes mellitus and impaired fasting glucose (IFG) to be independent predictors for CVD mortality after adjustment for age, sex and other traditional CVD risk factors, but IGT was not.3
The Atherosclerosis Risk in Communities (ARIC) Study showed neither isolated IFG nor isolated IGT was associated with a more adverse cardiovascular disease risk profile.7
2. Low fasting glucose and the risk of cardiovascular disease and mortality
Additional questions of interest examine 1) what constitutes a normal glucose value11
low fasting glucose.12 The large Israeli prospective study
revealed that higher fasting plasma glucose levels within the normoglycemic range (below 100 mg/dl) constitute an independent risk factor for type 2 diabetes among young men.13
Wei et al. documented a U-shaped relation between fasting plasma glucose and mortality.14
Participant of the study with low fasting plasma glucose levels had a high risk of cardiovascular disease and all-cause mortality.14 The study of
Taiwanese showed a J-shaped curve of relative risks for all-cause mortality by levels of fasting blood glucose on subjects with no history of diabetes.15
The DECODE study published in 2003 found a J-curved risk of long-term mortality with the lowest total mortality in subjects with a FPG 81 to 90 mg/dl.16
There are also another studies found the J-shaped relationship between glucose levels and mortality.12, 17
3. The purpose of this study
The aim of this study is to evaluate 1) the relationship between impaired fasting glucose and CVD and all-cause mortality and 2) the relationship between low fasting glucose level and CVD and all-cause mortality in the Korean population.
II. MATERIALS AND METHODS 1. Study participants
We used the data from the previously published Korean Cancer
Prevention Study (KCPS).18, 19
The KCPS is a prospective cohort investigation of over one million Koreans who were insured by Korean Medical Insurance Corporation, the former National Health Insurance Corporation. The cohort included governmental employees, public and private school teachers, and their dependents. The insured were required to have biennial medical examinations. The examination was conducted at designated hospitals or clinics nationwide by medical staff in accordance with the guideline provided by the Korean Medical Insurance Corporation. The exam included height, weight and blood pressure measurement, hearing test, visual acuity, chest x-ray, urinalysis, CBC and routine blood chemistry after overnight fasting. Those examined were also asked to provide their medical history and respond to questionnaires inquiring lifestyle. The cohort includes 1,329,525 Koreans (846,907 men and 482,618 women) aged 30 to 95 years. 784,870 (59%) subjects were enrolled in 1992 and 367,903 (27.7%) in 1993, 98,417 (7.4%) in 1994, and 78,335 (5.9%) in 1995. From these 1,329,525 participants, 27,192 subjects with missing information on anthropometric evaluation or with extremely low BMI (less than
16.0) or short stature (less than 130 cm) were excluded. Anyone who had ever been diagnosed with diabetes, hypertension, stoke, cancer, liver disease, respiratory disease, tuberculosis or any other specific diseases were also excluded from this study. A resultant 1,213,819 healthy Korean people were eligible for this study.
2. Data collection
The follow-up period was up to 10 years. The subjects’ in-hospital medical records during this period were analyzed for their morbidity and mortality. The principal outcome variables were 1) ischemic heart disease (International Classification of Diseases, tenth revision, ICD-10 codes, I20 to I25), 2) cerebrovascular disease or stroke (ICD 10, I60 to I69), 3) cardiovascular disease (CVD) which includes ischemic heart disease(I20-I25), cerebrovascular disease (I60-I69), hypertensive heart disease (I10-15), other forms of heart disease likely related to atherosclerotic CVD (I44-I52), disease of arteries (I70-I74), and other sudden death, cause unknown (R96), and 4) all-cause mortality. The cerebrovascular disease (I60-69) included hemorrhagic stroke (I60-I62) and ischemic stroke (I63-I66). For those who had more than one event, we used only the first event for this analysis.
These outcomes were ascertained from diagnoses on the discharge summaries and from causes of death on death certificates. In Korea there are certified medical chart recorders who review and abstract the medical chart and assign discharge diagnosis in a standardized form using World Health Organization codes. The recorders also complete death certificates based on the information provided by physicians. Computerized search of death certificate data from the National Statistical Office in Korea was performed for each enrollee.
3. Statistical Analysis
Fasting serum glucose levels were categorized as less than 70,
70 to 84, 85 to 99, 100 to 109, 110 to 125, 126 to 139, and 140 or more mg/dl (<3.88, 3.88-4.66, 4.72-5.5, 5.55-6.05, 6.11-6.94, 7-7.72, and ≥7.77 mmol/L). We used fasting glucose 85 to 99 mg/dl group as a reference. We computed hazard ratios (HRs; the hazard for incidence and mortality in a specific fasting glucose group divided by the corresponding hazard in the reference group) using Cox proportional hazards modeling to adjust for age and other potential confounding factors such as body mass index, systolic blood pressure, total cholesterol, ALT, alcohol drinking, smoking status and physical activity. All analyses were performed with SAS statistical software, version
9.2.
III. RESULTS
1. General characteristics of the study participants
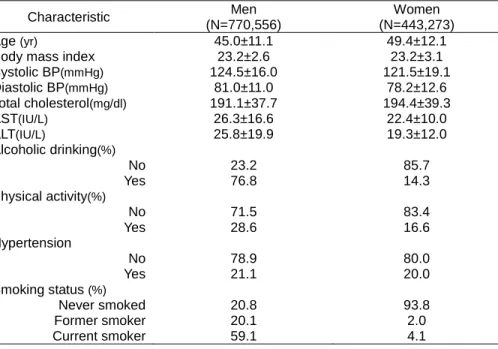
Of the total 1,213,829 healthy Koreans enrolled in the study, all of whom were over the age of 30, 770,556 were men and 443,273 were women. Their characteristics are described in Table 1.
Table 1. Baseline characteristics of the study population Characteristic Men
(N=770,556)
Women (N=443,273) Age (yr) 45.0±11.1 49.4±12.1 Body mass index 23.2±2.6 23.2±3.1 Systolic BP(mmHg) 124.5±16.0 121.5±19.1 Diastolic BP(mmHg) 81.0±11.0 78.2±12.6 Total cholesterol(mg/dl) 191.1±37.7 194.4±39.3 AST(IU/L) 26.3±16.6 22.4±10.0 ALT(IU/L) 25.8±19.9 19.3±12.0 Alcoholic drinking(%) No 23.2 85.7 Yes 76.8 14.3 Physical activity(%) No 71.5 83.4 Yes 28.6 16.6 Hypertension No 78.9 80.0 Yes 21.1 20.0 Smoking status (%) Never smoked 20.8 93.8 Former smoker 20.1 2.0 Current smoker 59.1 4.1
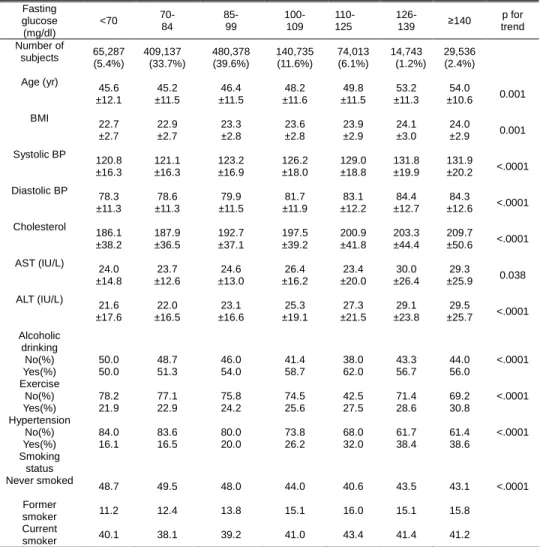
They are categorized into 7 groups according to their baseline fasting serum glucose level (table 2).
Table 2. General characteristics in categories of fasting serum glucose level Fasting glucose (mg/dl) <70 70- 84 85- 99 100- 109 110- 125 126- 139 ≥140 p for trend Number of subjects 65,287 (5.4%) 409,137 (33.7%) 480,378 (39.6%) 140,735 (11.6%) 74,013 (6.1%) 14,743 (1.2%) 29,536 (2.4%) Age (yr) 45.6 ±12.1 45.2 ±11.5 46.4 ±11.5 48.2 ±11.6 49.8 ±11.5 53.2 ±11.3 54.0 ±10.6 0.001 BMI 22.7 ±2.7 22.9 ±2.7 23.3 ±2.8 23.6 ±2.8 23.9 ±2.9 24.1 ±3.0 24.0 ±2.9 0.001 Systolic BP 120.8 ±16.3 121.1 ±16.3 123.2 ±16.9 126.2 ±18.0 129.0 ±18.8 131.8 ±19.9 131.9 ±20.2 <.0001 Diastolic BP 78.3 ±11.3 78.6 ±11.3 79.9 ±11.5 81.7 ±11.9 83.1 ±12.2 84.4 ±12.7 84.3 ±12.6 <.0001 Cholesterol 186.1 ±38.2 187.9 ±36.5 192.7 ±37.1 197.5 ±39.2 200.9 ±41.8 203.3 ±44.4 209.7 ±50.6 <.0001 AST (IU/L) 24.0 ±14.8 23.7 ±12.6 24.6 ±13.0 26.4 ±16.2 23.4 ±20.0 30.0 ±26.4 29.3 ±25.9 0.038 ALT (IU/L) 21.6 ±17.6 22.0 ±16.5 23.1 ±16.6 25.3 ±19.1 27.3 ±21.5 29.1 ±23.8 29.5 ±25.7 <.0001 Alcoholic drinking No(%) 50.0 48.7 46.0 41.4 38.0 43.3 44.0 <.0001 Yes(%) 50.0 51.3 54.0 58.7 62.0 56.7 56.0 Exercise No(%) 78.2 77.1 75.8 74.5 42.5 71.4 69.2 <.0001 Yes(%) 21.9 22.9 24.2 25.6 27.5 28.6 30.8 Hypertension No(%) 84.0 83.6 80.0 73.8 68.0 61.7 61.4 <.0001 Yes(%) 16.1 16.5 20.0 26.2 32.0 38.4 38.6 Smoking status Never smoked 48.7 49.5 48.0 44.0 40.6 43.5 43.1 <.0001 Former smoker 11.2 12.4 13.8 15.1 16.0 15.1 15.8 Current smoker 40.1 38.1 39.2 41.0 43.4 41.4 41.2
Most (78.7%) people’s sugar level was below 100 mg/dl. Participants with fasting glucose of 85 to 99 mg/dl were 39.6%. 214,748 subjects (17.8%) had impaired fasting glucose (IFG) by 2003 ADA criteria. These criteria increased the number of IFG three-fold compared with that (6.1%) of 1997 ADA criteria. Table 2 shows that people whose fasting glucose levels are higher tend to be older and to have higher body mass index, blood pressure, total cholesterol and ALT levels. These groups show greater incidence of smoking and drinking. They also report to exercise more, which is not easy to understand. We believe it may be because they have more features of metabolic syndrome, and they realize the need for exercise more than their young and slim counterparts.
2. Incidence and mortality of cardiovascular disease
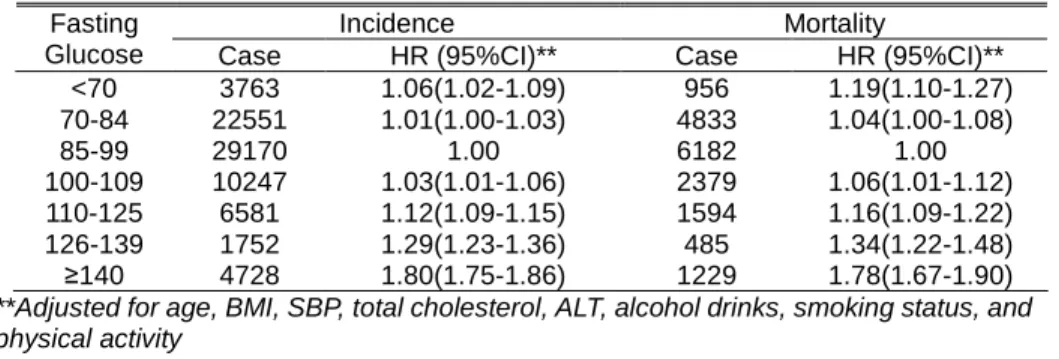
Cardiovascular disease (CVD) includes ischemic heart disease, hypertensive heart disease, other heart disease probably related with atherosclerosis, cerebrovascular disease, and disease of arteries. CVD also includes sudden death of unknown cause, which is usually of cardiac origin. The CVD incidence and mortality increased at low glucose level (CVD mortality for <70 mg/dl, HR 1.19 with 95% CI 1.10-1.27). The IFG also showed increased CVD incidence and mortality. The HR of glucose 100 to
109 mg/dl group for cardiovascular mortality was 1.06 with 95% CI 1.01 to 1.12, and that of glucose 110 to 125 mg/dl was 1.16 with 95% CI 1.09 to 1.22. The HR increases as the glucose level rises, which results in the J-shaped curve (Fig 1).
Table 3. Incidence and mortality of cardiovascular disease in total cohort Incidence Mortality Fasting
Glucose Case HR (95%CI)** Case HR (95%CI)** <70 3763 1.06(1.02-1.09) 956 1.19(1.10-1.27) 70-84 22551 1.01(1.00-1.03) 4833 1.04(1.00-1.08) 85-99 29170 1.00 6182 1.00 100-109 10247 1.03(1.01-1.06) 2379 1.06(1.01-1.12) 110-125 6581 1.12(1.09-1.15) 1594 1.16(1.09-1.22) 126-139 1752 1.29(1.23-1.36) 485 1.34(1.22-1.48) ≥140 4728 1.80(1.75-1.86) 1229 1.78(1.67-1.90)
**Adjusted for age, BMI, SBP, total cholesterol, ALT, alcohol drinks, smoking status, and physical activity
Fig 1. Fasting glucose and HR for cardiovascular disease incidence
1.06 1.01 1 1.03 1.12 1.29 1.8 0.6 0.8 1 1.2 1.4 1.6 1.8 2 <70 70-84 85-99 100-109 110-125 126-139 ≥140 FBS, mg/dl H a za rd r a ti o
When we analyzed men and women separately, both showed the same results except for the CVD incidence rate at low glucose level in women was not significantly high (Table 4, 5). In men the CVD incidence and mortality showed J-shaped curve. In women only CVD mortality showed J-shaped curve.
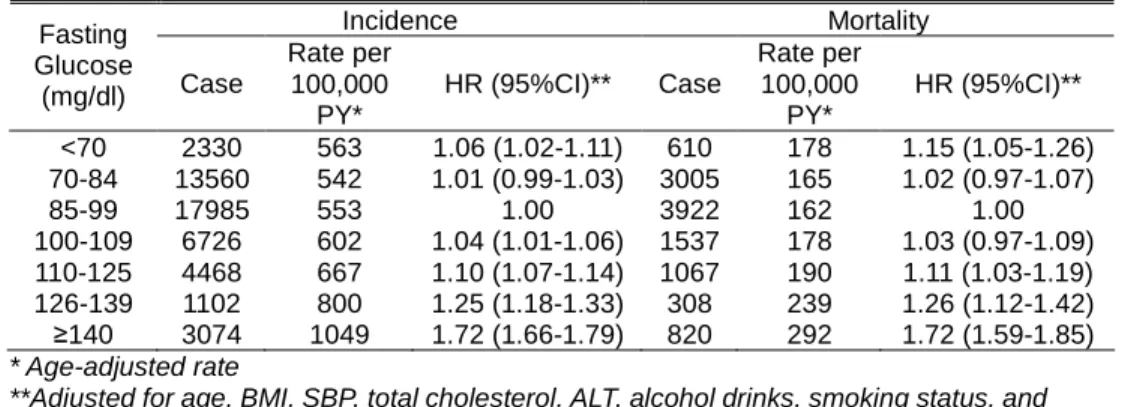
Table 4. Incidence and mortality of cardiovascular disease (CVD) in men Incidence Mortality Fasting Glucose (mg/dl) Case Rate per 100,000 PY* HR (95%CI)** Case Rate per 100,000 PY* HR (95%CI)** <70 2330 563 1.06 (1.02-1.11) 610 178 1.15 (1.05-1.26) 70-84 13560 542 1.01 (0.99-1.03) 3005 165 1.02 (0.97-1.07) 85-99 17985 553 1.00 3922 162 1.00 100-109 6726 602 1.04 (1.01-1.06) 1537 178 1.03 (0.97-1.09) 110-125 4468 667 1.10 (1.07-1.14) 1067 190 1.11 (1.03-1.19) 126-139 1102 800 1.25 (1.18-1.33) 308 239 1.26 (1.12-1.42) ≥140 3074 1049 1.72 (1.66-1.79) 820 292 1.72 (1.59-1.85) * Age-adjusted rate
**Adjusted for age, BMI, SBP, total cholesterol, ALT, alcohol drinks, smoking status, and physical activity
Table 5. Incidence and mortality of cardiovascular disease (CVD) in women Incidence Mortality Fasting Glucose (mg/dl) Case Rate per 100,000 PY* HR (95%CI)** Case Rate per 100,000 PY* HR (95%CI)** <70 1433 522 1.04 (0.98-1.10) 346 169 1.25(1.11-1.40) 70-84 8991 523 1.02 (0.99-1.05) 1828 155 1.09(1.02-1.16) 85-99 11185 637 1.00 2260 145 1.00 100-109 3521 553 1.02 (0.98-1.06) 842 166 1.11(1.02-1.20) 110-125 2113 645 1.13 (1.08-1.18) 527 180 1.22(1.10-1.34) 126-139 177 761 1.35 (1.24-1.46) 650 245 1.47(1.26-1.72) ≥140 409 1077 1.91 (1.81-2.01) 1654 286 1.87(1.68-2.09) * Age-adjusted rate
**Adjusted for age, BMI, SBP, total cholesterol, ALT, alcohol drinks, smoking status, and physical activity
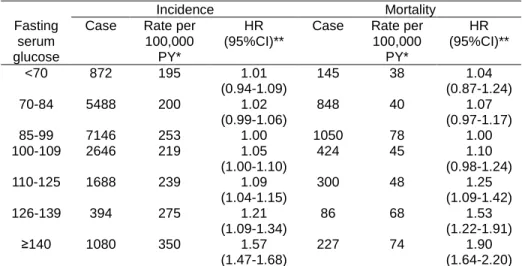
3. Incidence rate and mortality from ischemic heart disease Among CVD, ischemic heart disease was analyzed. The risk of
ischemic heart disease and its mortality went up from fasting glucose above 100 mg/dl. However, the ischemic heart disease incidence and mortality did not rise at the low fasting glucose level (Table 6).
Table 6. Incidence and mortality of ischemic heart disease in total cohort Incidence Mortality Fasting
glucose
(mg/dl) Case HR (95%CI)** Case HR (95%CI)** <70 1280 0.98(0.93-1.04) 206 1.09(0.94-1.27) 70-84 8212 1.00(0.97-1.03) 1160 1.07(0.99-1.15) 85-99 10710 1.00 1438 1.00 100-109 3659 1.02(0.98-1.06) 570 1.11(1.01-1.23) 110-125 2349 1.11(1.06-1.17) 397 1.28(1.15-1.44) 126-139 591 1.25(1.15-1.36) 118 1.55(1.28-1.87) ≥140 1629 1.73(1.64-1.82) 330 2.11(1.87-2.39)
**Adjusted for age, BMI, SBP, total cholesterol, ALT, alcohol drinks, smoking status, and physical activity
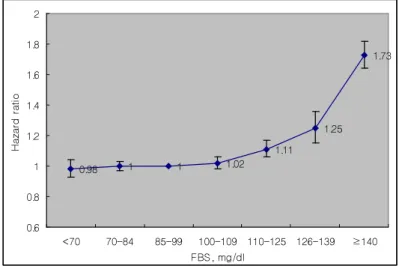
Fig 2. Fasting glucose level and HR for ischemic heart disease incidence
0.98 1 1 1.02 1.11 1.25 1.73 0.6 0.8 1 1.2 1.4 1.6 1.8 2 <70 70-84 85-99 100-109 110-125 126-139 ≥140 FBS, mg/dl H a za rd r a ti o
The results from men and women did not show significant difference in the incidence and mortality of ischemic heart disease (Table 7 and 8).
Table 7. Incidence and mortality of ischemic heart disease in men Incidence Mortality Fasting
serum glucose
Case Rate per 100,000
PY*
HR (95%CI)**
Case Rate per 100,000 PY* HR (95%CI)** <70 872 195 1.01 (0.94-1.09) 145 38 1.04 (0.87-1.24) 70-84 5488 200 1.02 (0.99-1.06) 848 40 1.07 (0.97-1.17) 85-99 7146 253 1.00 1050 78 1.00 100-109 2646 219 1.05 (1.00-1.10) 424 45 1.10 (0.98-1.24) 110-125 1688 239 1.09 (1.04-1.15) 300 48 1.25 (1.09-1.42) 126-139 394 275 1.21 (1.09-1.34) 86 68 1.53 (1.22-1.91) ≥140 1080 350 1.57 (1.47-1.68) 227 74 1.90 (1.64-2.20) * Age-adjusted rate
**Adjusted for age, BMI, SBP, total cholesterol, ALT, alcohol drinks, smoking status, and physical activity
Table 8.Incidence and mortality of ischemic heart disease in women Incidence Mortality Fasting
serum glucose
Case Rate per 100,000
PY*
HR (95%CI)**
Case Rate per 100,000 PY* HR (95%CI)** <70 408 134 0.91 (0.82-1.02) 61 27 1.24 (0.94-1.64) 70-84 2724 143 0.95 (0.90-1.00) 312 25 1.09 (0.94-1.27) 85-99 3564 152 1.00 388 24 1.00 100-109 1013 149 0.93 (0.87-1.00) 146 29 1.09 (0.90-1.32) 110-125 661 198 1.14 (1.04-1.24) 97 31 1.29 (1.03-1.61) 126-139 197 225 1.30 (1.13-1.51) 32 55 1.54 (1.07-2.21) ≥140 549 356 2.01 (1.83-2.20) 103 69 2.62 (2.09-3.29) * Age-adjusted rate
**Adjusted for age, BMI, SBP, total cholesterol, ALT, alcohol drinks, smoking status, and physical activity
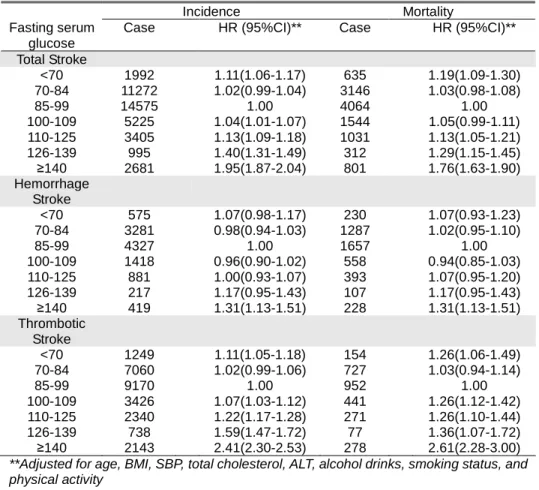
4. Cerebrovascular disease
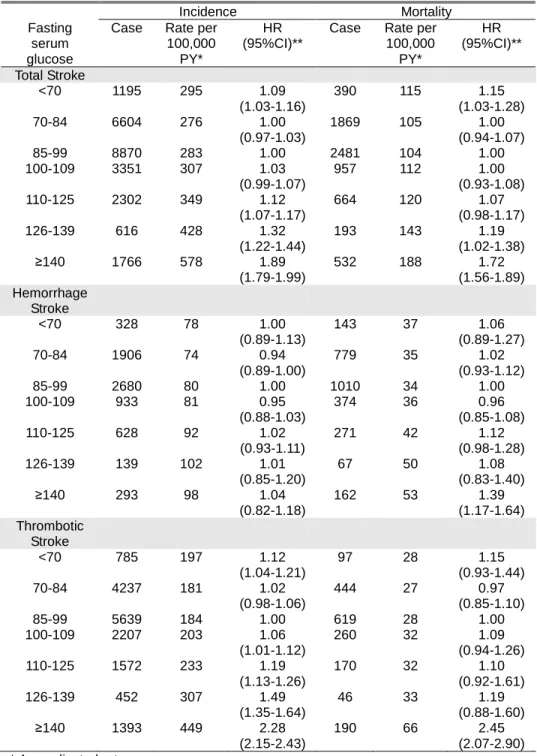
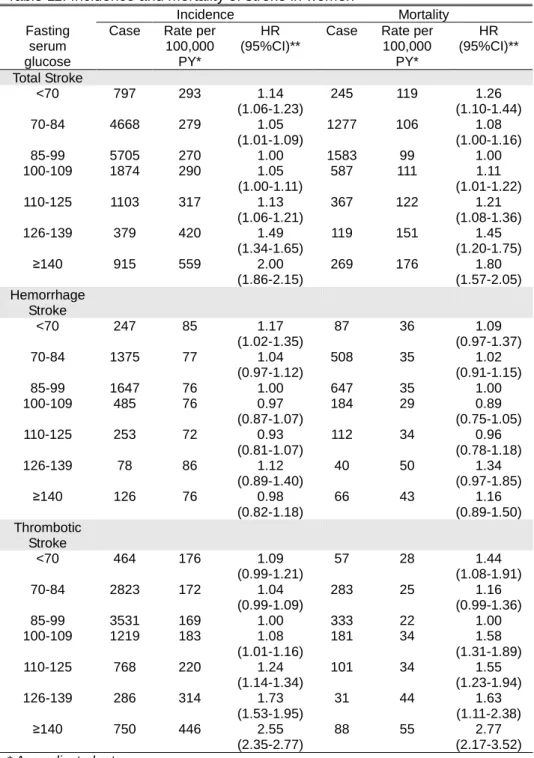
Total cerebrovascular disease, hemorrhagic stroke and ischemic stroke were analyzed with the same method. Total stoke mortality increased at low glucose group (<70 mg/dl) and hyperglycemic group (above 100 mg/dl). Stroke incidence increased at low glucose group (<70 mg/dl) and at a glucose level above 110 mg/dl. The incidence and mortality of ischemic stroke increased at low glucose group (<70 mg/dl) and hyperglycemic group above 100 mg/dl, showing J-shaped curve. The incidence and mortality of hemorrhagic stoke were increased only at glucose level above 140 mg/dl (Table 9). Men and Women showed differences in mortality of thrombotic stroke. The incidence of ischemic stroke increased at glucose below 70 mg/dl and above 100 mg/dl in men. But the mortality from ischemic stroke in men was high only at glucose above 140 mg/dl (Table 10). In women the incidence rate and mortality both increased at sugar above 100 mg/dl. Also low glucose level increased the risk of ischemic stroke mortality in women (Table 11).
Table 9. Incidence and mortality of stroke in total cohort
Incidence Mortality Fasting serum
glucose
Case HR (95%CI)** Case HR (95%CI)** Total Stroke <70 1992 1.11(1.06-1.17) 635 1.19(1.09-1.30) 70-84 11272 1.02(0.99-1.04) 3146 1.03(0.98-1.08) 85-99 14575 1.00 4064 1.00 100-109 5225 1.04(1.01-1.07) 1544 1.05(0.99-1.11) 110-125 3405 1.13(1.09-1.18) 1031 1.13(1.05-1.21) 126-139 995 1.40(1.31-1.49) 312 1.29(1.15-1.45) ≥140 2681 1.95(1.87-2.04) 801 1.76(1.63-1.90) Hemorrhage Stroke <70 575 1.07(0.98-1.17) 230 1.07(0.93-1.23) 70-84 3281 0.98(0.94-1.03) 1287 1.02(0.95-1.10) 85-99 4327 1.00 1657 1.00 100-109 1418 0.96(0.90-1.02) 558 0.94(0.85-1.03) 110-125 881 1.00(0.93-1.07) 393 1.07(0.95-1.20) 126-139 217 1.17(0.95-1.43) 107 1.17(0.95-1.43) ≥140 419 1.31(1.13-1.51) 228 1.31(1.13-1.51) Thrombotic Stroke <70 1249 1.11(1.05-1.18) 154 1.26(1.06-1.49) 70-84 7060 1.02(0.99-1.06) 727 1.03(0.94-1.14) 85-99 9170 1.00 952 1.00 100-109 3426 1.07(1.03-1.12) 441 1.26(1.12-1.42) 110-125 2340 1.22(1.17-1.28) 271 1.26(1.10-1.44) 126-139 738 1.59(1.47-1.72) 77 1.36(1.07-1.72) ≥140 2143 2.41(2.30-2.53) 278 2.61(2.28-3.00)
**Adjusted for age, BMI, SBP, total cholesterol, ALT, alcohol drinks, smoking status, and physical activity
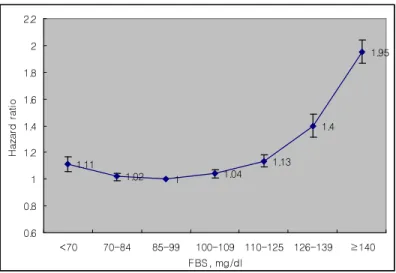
Fig 3. Fasting glucose level and HR for stroke incidence 1.11 1.02 1 1.04 1.13 1.4 1.95 0.6 0.8 1 1.2 1.4 1.6 1.8 2 2.2 <70 70-84 85-99 100-109 110-125 126-139 ≥140 FBS, mg/dl H a za rd r a ti o
Table 10. Incidence and mortality of stroke in men
Incidence Mortality Fasting
serum glucose
Case Rate per 100,000
PY*
HR (95%CI)**
Case Rate per 100,000 PY* HR (95%CI)** Total Stroke <70 1195 295 1.09 (1.03-1.16) 390 115 1.15 (1.03-1.28) 70-84 6604 276 1.00 (0.97-1.03) 1869 105 1.00 (0.94-1.07) 85-99 8870 283 1.00 2481 104 1.00 100-109 3351 307 1.03 (0.99-1.07) 957 112 1.00 (0.93-1.08) 110-125 2302 349 1.12 (1.07-1.17) 664 120 1.07 (0.98-1.17) 126-139 616 428 1.32 (1.22-1.44) 193 143 1.19 (1.02-1.38) ≥140 1766 578 1.89 (1.79-1.99) 532 188 1.72 (1.56-1.89) Hemorrhage Stroke <70 328 78 1.00 (0.89-1.13) 143 37 1.06 (0.89-1.27) 70-84 1906 74 0.94 (0.89-1.00) 779 35 1.02 (0.93-1.12) 85-99 2680 80 1.00 1010 34 1.00 100-109 933 81 0.95 (0.88-1.03) 374 36 0.96 (0.85-1.08) 110-125 628 92 1.02 (0.93-1.11) 271 42 1.12 (0.98-1.28) 126-139 139 102 1.01 (0.85-1.20) 67 50 1.08 (0.83-1.40) ≥140 293 98 1.04 (0.82-1.18) 162 53 1.39 (1.17-1.64) Thrombotic Stroke <70 785 197 1.12 (1.04-1.21) 97 28 1.15 (0.93-1.44) 70-84 4237 181 1.02 (0.98-1.06) 444 27 0.97 (0.85-1.10) 85-99 5639 184 1.00 619 28 1.00 100-109 2207 203 1.06 (1.01-1.12) 260 32 1.09 (0.94-1.26) 110-125 1572 233 1.19 (1.13-1.26) 170 32 1.10 (0.92-1.61) 126-139 452 307 1.49 (1.35-1.64) 46 33 1.19 (0.88-1.60) ≥140 1393 449 2.28 (2.15-2.43) 190 66 2.45 (2.07-2.90) * Age-adjusted rate
**Adjusted for age, BMI, SBP, total cholesterol, ALT, alcohol drinks, smoking status, and physical activity
Table 11. Incidence and mortality of stroke in women
Incidence Mortality Fasting
serum glucose
Case Rate per 100,000
PY*
HR (95%CI)**
Case Rate per 100,000 PY* HR (95%CI)** Total Stroke <70 797 293 1.14 (1.06-1.23) 245 119 1.26 (1.10-1.44) 70-84 4668 279 1.05 (1.01-1.09) 1277 106 1.08 (1.00-1.16) 85-99 5705 270 1.00 1583 99 1.00 100-109 1874 290 1.05 (1.00-1.11) 587 111 1.11 (1.01-1.22) 110-125 1103 317 1.13 (1.06-1.21) 367 122 1.21 (1.08-1.36) 126-139 379 420 1.49 (1.34-1.65) 119 151 1.45 (1.20-1.75) ≥140 915 559 2.00 (1.86-2.15) 269 176 1.80 (1.57-2.05) Hemorrhage Stroke <70 247 85 1.17 (1.02-1.35) 87 36 1.09 (0.97-1.37) 70-84 1375 77 1.04 (0.97-1.12) 508 35 1.02 (0.91-1.15) 85-99 1647 76 1.00 647 35 1.00 100-109 485 76 0.97 (0.87-1.07) 184 29 0.89 (0.75-1.05) 110-125 253 72 0.93 (0.81-1.07) 112 34 0.96 (0.78-1.18) 126-139 78 86 1.12 (0.89-1.40) 40 50 1.34 (0.97-1.85) ≥140 126 76 0.98 (0.82-1.18) 66 43 1.16 (0.89-1.50) Thrombotic Stroke <70 464 176 1.09 (0.99-1.21) 57 28 1.44 (1.08-1.91) 70-84 2823 172 1.04 (0.99-1.09) 283 25 1.16 (0.99-1.36) 85-99 3531 169 1.00 333 22 1.00 100-109 1219 183 1.08 (1.01-1.16) 181 34 1.58 (1.31-1.89) 110-125 768 220 1.24 (1.14-1.34) 101 34 1.55 (1.23-1.94) 126-139 286 314 1.73 (1.53-1.95) 31 44 1.63 (1.11-2.38) ≥140 750 446 2.55 (2.35-2.77) 88 55 2.77 (2.17-3.52) * Age-adjusted rate
**Adjusted for age, BMI, SBP, total cholesterol, ALT, alcohol drinks, smoking status, and physical activity
5. All-cause mortality
The relationship between all-cause mortality and fasting
glucose level also showed J-shaped curve (Table 12). HR increased at the low glucose level (<70 mg/dl, HR 1.07, 95% CI 1.04–1.10) and started to increase from at glucose 100-109 mg/dl (HR 1.08, 95% CI 1.06-1.11). For the group with glucose above 140 mg/dl, HR was 2.07 (95% CI 2.02-2.13). Because the low glucose level can be resulted from certain cancer, we re-analyzed the previous result, which showed no increase of HR at glucose below 90 mg/dl.19
Either glucose below 70 mg/dl (HR 1.02, 95% CI 0.97-1.07) or glucose 70-84 mg/dl (HR 0.99, 95% CI 0.96-1.02) group was not related with all-cancer mortality.
Table 12. All-cause mortality in total cohort
Mortality
Fasting glucose Case HR (95%CI)** <70 4953 1.07(1.04-1.10) 70-84 25988 1.00(0.98-1.02) 85-99 33099 1.00 100-109 12333 1.08(1.06-1.11) 110-125 8424 1.24(1.21-1.28) 126-139 2396 1.43(1.37-1.49) ≥140 6606 2.07(2.02-2.13)
**Adjusted for age, BMI, SBP, total cholesterol, ALT, alcohol drinks, smoking status, and physical activity
Fig 4. Fasting glucose level and HR for all-cause mortality 1.07 1 1 1.08 1.24 1.43 2.07 0.6 0.8 1 1.2 1.4 1.6 1.8 2 2.2 2.4 <70 70-84 85-99 100-109 110-125 126-139 ≥140 FBS, mg/dl H a za rd r a ti o IV. DISCUSSION
1. Impaired fasting glucose and CVD incidence and mortality
According to the findings reported by Nielson et al., nondiabetic hyperglycemic (fasting glucose 100 to 125 mg/dl) patients have a significantly greater risk for development of coronary artery disease.20
The European Diabetes Epidemiology Group examined published data to assess the magnitude of the association between different thresholds (100 or 110 mg/dl) for IFG and diabetes.16
They found that the magnitude of the association between diabetes and IFG is greater for IFG defined as fasting plasma glucose of 110 to 125 mg/dl (IFG110) than for the new category of fasting plasma glucose of 100 to 109 mg/dl (IFG100).16
by Levitan et al. showed that both fasting glucose level and post-challenge blood glucose level were risk markers for CVD among apparently healthy individuals without diabetes.4 This
meta-analysis also showed a linear relationship between CVD risk and post-challenge blood glucose level and a possible threshold effect with fasting blood glucose level to be around 100 mg/dl.4
Our findings are also consistent with Levitan’s meta-analysis results. The fasting glucose level worked as a risk factor after adjusting confounding factors such as age, BMI, BP, total cholesterol, ALT, smoking, and physical activity. From fasting glucose 100 mg/dl the risk started to increase, although the increase of HR in group with fasting glucose 100 to 109 mg/dl was smaller than group with fasting glucose above 110 mg/dl. Another study with nondiabetic Italian Caucasians showed that IFG110 is associated with a worse metabolic and cardiovascular risk profile as compared with IFG100.21
IFG110 was associated with higher risk of post-challenge glucose intolerance, lower levels of circulating IGF-1, and increased levels of inflammatory markers including white blood cell count and C-reactive protein.21
Andreozzi’s study implies that IFG110 was more related with the incidence of diabetes and inflammatory process of cardiovascular events than IFG100. In our result, the risk increased as the fasting glucose level increased. The change of
cutoff value for IFG has been challenged.16, 22 Diagnostic criteria
are beyond the scope of this study. Instead, we will discuss the clinical significance of the fasting glucose level 100 to 110 mg/dl. Recently, in the Chinese Multi-provincial Cohort Study23
, Liu et al. reported that the normal fasting glucose group, impaired fasting glucose group and diabetes group with metabolic syndrome had increased CVD risk compared to those groups without metabolic syndrome. Therefore, Liu et al. concluded that the increased CVD risk in individuals with IFG or diabetes was largely driven by the coexistence of multiple metabolic disorders rather than hyperglycemia per se.23
The Hoorn study also suggests high risk of cardiovascular mortality in individuals with impaired fasting glucose is explained by conversion to diabetes.22
However, glucose is clearly responsible for the microvascular complications of diabetes and has a significant impact on the pathogenesis of atherosclerotic macrovascular disease.24 The Rotterdam Study found IFG 110 to be associated
with increased arterial stiffness in elderly people without diabetes mellitus.25 The CATHAY study found that increased
levels of glycemia (102 to 124 mg/dl) is adversely associated with arterial endothelial dysfunction and intima-media thickening.26
With all of the results taken into consideration, non-diabetic hyperglycemia, i.e. impaired fasting glucose is an
independent risk factor of incident cardiovascular disease, ischemic heart disease, stroke and mortality and fasting glucose level 110 to 125 mg/dl tends to be more strongly related with the risk than fasting glucose level 100 to 109 mg/dl.
2. Low fasting glucose level and cardiovascular risk
Low fasting plasma glucose level was reported as a predictor of cardiovascular disease and all-cause mortality from a prospective cohort study of more than 40,000 people by Wei et al..14
The lowest total mortality of that study was found in the subjects with a FPG in the interval 79 to 109 mg/dl. In the study by Balkau et al. the interval of the lowest total mortality was 94 to 103 mg/dl17
and in the 2003 DECODE study was 81 to 90 mg/dl.16 The findings by Wändell et al. showed that the lowest
incidence mortality occurred in the interval of 113 to 121 mg/dl12
, higher than other studies. In our study, the lowest total mortality count occurred within the 85 to 99 mg/dl interval. Although the numbers are arbitrary and varied, the trend of J-shaped curve with increasing risk at the lower glucose level is consistent. Very low glucose level can be associated with CVD mortality in
diabetic patients. But the studies mentioned above excluded diabetes patients or had very few cases of classic hypoglycemia with fasting glucose less than 50 mg/dl. It is not known how the
low fasting glucose level can be associated with CVD and all-cause mortality in nondiabetic people. Wei et al. hypothesized that long-term exposure to low fasting plasma glucose may serve as a risk factor of CVD mortality, perhaps through abnormal cardiac activity and thrombosis, especially in patients with atherosclerosis.14
Tanne et al. reported a J-shaped relationship between fasting plasma glucose and incident ischemic cerebrovascular events in patients with pre-existing atherothrombotic disease.27
Tanne et al. explained that hypoglycemia and rapid changes in plasma glucose have been shown to increase counter-regulatory hormones such as epinephrine and norepinephrine, which may induce vasoconstriction, platelet aggregation, and, thereby, ischemia.27, 28
Further study will be needed to define the association of low fasting glucose level and CVD and all-cause mortality. Meanwhile, it would be worthwhile to pay more attention to low fasting glucose level in addition to nondiabetic hyperglycemia.
3. Sex differences and ischemic stroke
While elevated fasting glucose was associated with increase cardiovascular disease and mortality in both men and women, the hazard ratios were higher in women for all endpoints studied. The gender difference was particularly marked for ischemic stroke.
These findings are consistent with the well established interactoion between gender and diabetes (women with diabetes have higher increases in cardiovascular risk compared to men with diabetes) and with the findings of the DECODE study, which showed a significant sex difference for cardiovascular mortality. Since women’s nondiabetic hyperglycemia carries higher mortality risk then men’s, probably a more aggressive intervention should be given to women’s abnormal fasting glucose level.
4. Limitations of this study
This study did not factor in the conversion to diabetes during follow-up and could not define the association between IFG and the risk of mortality as independent of the conversion to diabetes during follow-up. This study also did not include other parameters for metabolic syndrome such as triglyceride, HDL-cholesterol, and waist circumference and thus could not completely rule out the confounding effect of metabolic syndrome.
The outcomes were obtained from admission records and death certificates. Since their outpatient records were not included, the incidence of morbidity would be lower than actual incidence. For example, transient ischemic attack or mild angina that was
evaluated and treated in outpatient department would have been missed.
The cardiovascular disease in other studies usually accounted for all diseases of the circulatory system (ICD-10, I00 to I99) and sudden death of unknown origin, but the cardiovascular disease in our study did not include some of the diseases of the circulatory system (I00-I09, I26-I52, I77-79, I80-99). This also could have lowered the incidence and mortality of cardiovascular disease.
V. CONCLUSION
A prospective cohort of more than one million Korean people for over the period of 10 years revealed that fasting glucose level is closely related with CVD incidence and mortality and all-cause mortality. The J-shaped curve was exhibited for each relationship, with the exception of the relationship between ischemic heart disease and fasting glucose level. The risk is high when fasting glucose level is below 70 mg/dl. The risk also starts to increase from a fasting glucose of 100 mg/dl. The increased risk for the fasting glucose interval of 100 to 109 mg/dl is smaller than that of 110 to 125 mg/dl. Both low glucose level and impaired fasting glucose should be considered as a predictor of cardiovascular disease risk.
REFERENCES
1. The Expert Committee on the D, Classification of Diabetes M. Follow-up Report on the Diagnosis of Diabetes Mellitus. Diabetes Care 2003 November 1, 2003;26(11):3160-7.
2. American Diabetes A. Diagnosis and Classification of Diabetes Mellitus. Diabetes Care 2005 January 1, 2005;28(suppl_1):S37-42.
3. Barr ELM, Zimmet PZ, Welborn TA, Jolley D, Magliano DJ, Dunstan DW, et al. Risk of Cardiovascular and All-Cause Mortality in Individuals With Diabetes Mellitus, Impaired Fasting Glucose, and Impaired Glucose Tolerance: The Australian Diabetes, Obesity, and Lifestyle Study (AusDiab). Circulation 2007 July 10, 2007;116(2):151-7.
4. Levitan EB, Song Y, Ford ES, Liu S. Is Nondiabetic Hyperglycemia a Risk Factor for Cardiovascular Disease?: A Meta-analysis of Prospective Studies. Arch Intern Med 2004 October 25, 2004;164(19):2147-55.
5. Unwin N, Shaw J, Zimmet P, Alberti KG. Impaired glucose tolerance and impaired fasting glycaemia: the current status on definition and intervention. Diabet Med 2002 Sep;19(9):708-23. 6. Tominaga M, Eguchi H, Manaka H, Igarashi K, Kato T, Sekikawa A. Impaired glucose tolerance is a risk factor for cardiovascular disease, but not impaired fasting glucose. The Funagata Diabetes Study. Diabetes Care 1999 June 1, 1999;22(6):920-4.
7. Pankow JS, Kwan DK, Duncan BB, Schmidt MI, Couper DJ, Golden S, et al. Cardiometabolic Risk in Impaired Fasting Glucose and Impaired Glucose Tolerance: The Atherosclerosis Risk in Communities Study. Diabetes Care 2007 February 1, 2007;30(2):325-31.
8. Sorkin JD, Muller DC, Fleg JL, Andres R. The relation of fasting and 2-h postchallenge plasma glucose concentrations to mortality: data from the Baltimore Longitudinal Study of Aging with a critical review of the literature. Diabetes Care 2005 Nov;28(11):2626-32.
9. Blake DR, Meigs JB, Muller DC, Najjar SS, Andres R, Nathan DM. Impaired Glucose Tolerance, but not Impaired Fasting Glucose, Is Associated With Increased Levels of Coronary Heart
Disease Risk Factors: Results From the Baltimore Longitudinal Study on Aging. Diabetes 2004 August 1, 2004;53(8):2095-100. 10. Qiao Q, Jousilahti P, Eriksson J, Tuomilehto J. Predictive Properties of Impaired Glucose Tolerance for Cardiovascular Risk Are Not Explained by the Development of Overt Diabetes During Follow-Up. Diabetes Care 2003 October 1, 2003;26(10):2910-4. 11. Piche M-E, Arcand-Bosse J-F, Despres J-P, Perusse L, Lemieux S, Weisnagel SJ. What is a Normal Glucose Value?: Differences in indexes of plasma glucose homeostasis in subjects with normal fasting glucose. Diabetes Care 2004 October 1, 2004;27(10):2470-7.
12. Wändell PE, Theobald H. The association between blood glucose value and long-term mortality. Diabetes & metabolism 2005;31(6):588-94.
13. Tirosh A, Shai I, Tekes-Manova D, Israeli E, Pereg D, Shochat T, et al. Normal Fasting Plasma Glucose Levels and Type 2 Diabetes in Young Men. N Engl J Med 2005 October 6, 2005;353(14):1454-62.
14. Wei M, Gibbons LW, Mitchell TL, Kampert JB, Stern MP, Blair SN. Low Fasting Plasma Glucose Level as a Predictor of Cardiovascular Disease and All-Cause Mortality. Circulation 2000 May 2, 2000;101(17):2047-52.
15. Wen CP, Cheng TYD, Tsai SP, Hsu HL, Wang SL. Increased Mortality Risks of Pre-Diabetes (Impaired Fasting Glucose) in Taiwan. Diabetes Care 2005 November 1, 2005;28(11):2756-61. 16. The DSG. Is the Current Definition for Diabetes Relevant to Mortality Risk From All Causes and Cardiovascular and Noncardiovascular Diseases? Diabetes Care 2003 March 1, 2003;26(3):688-96.
17. Balkau B, Bertrais S, Ducimetiere P, Eschwege E. Is there a glycemic threshold for mortality risk? Diabetes Care 1999 May 1, 1999;22(5):696-9.
18. Jee SH, Sull JW, Park J, Lee S-Y, Ohrr H, Guallar E, et al. Body-Mass Index and Mortality in Korean Men and Women. N Engl J Med 2006 August 24, 2006;355(8):779-87.
19. Jee SH, Ohrr H, Sull JW, Yun JE, Ji M, Samet JM. Fasting Serum Glucose Level and Cancer Risk in Korean Men and Women. JAMA 2005 January 12, 2005;293(2):194-202.
20. Nielson C, Lange T, Hadjokas N. Blood Glucose and Coronary Artery Disease in Nondiabetic Patients. Diabetes Care
2006 May 1, 2006;29(5):998-1001.
21. Francesco Andreozzi ESMRMMPASFPGS. Metabolic and cardiovascular risk factors in subjects with impaired fasting glucose: the 100 <I>versus</I> 110 mg/dL threshold. Diabetes/Metabolism Research and Reviews 2007;23(7):547-50. 22. Rijkelijkhuizen JM, Nijpels G, Heine RJ, Bouter LM, Stehouwer CDA, Dekker JM. High Risk of Cardiovascular Mortality in Individuals With Impaired Fasting Glucose Is Explained by Conversion to Diabetes: The Hoorn Study. Diabetes Care 2007 February 1, 2007;30(2):332-6.
23. Liu J, Grundy SM, Wang W, Smith JSC, Lena Vega G, Wu Z, et al. Ten-year risk of cardiovascular incidence related to diabetes, prediabetes, and the metabolic syndrome. American Heart Journal 2007;153(4):552-8.
24. Deedwania PC, Fonseca VA. Diabetes, prediabetes, and cardiovascular risk: Shifting the paradigm. The American Journal of Medicine 2005;118(9):939-47.
25. van Popele NM, Elizabeth Hak A, Mattace-Raso FUS, Bots ML, van der Kuip DAM, Reneman RS, et al. Impaired Fasting Glucose Is Associated with Increased Arterial Stiffness in Elderly People without Diabetes Mellitus: The Rotterdam Study. Journal of the American Geriatrics Society 2006;54(3):397-404.
26. Thomas GN, Chook P, Qiao M, Huang XS, Leong HC, Celermajer DS, et al. Deleterious impact of "high normal" glucose levels and other metabolic syndrome components on arterial endothelial function and intima-media thickness in apparently healthy Chinese subjects: the CATHAY study. Arteriosclerosis, thrombosis, and vascular biology 2004;24(4):739-43.
27. Tanne D, Koren-Morag N, Goldbourt U. Fasting Plasma Glucose and Risk of Incident Ischemic Stroke or Transient Ischemic Attacks: A Prospective Cohort Study. Stroke 2004 October 1, 2004;35(10):2351-5.
28. Galassetti P, Davis SN. Effects of insulin per se on neuroendocrine and metabolic counter-regulatory responses to hypoglycaemia. Clinical science 2000;99(5):351-62.