Copyright © 2021 Techno-Press, Ltd.
http://www.techno-press.com/journals/was&subpage=7 ISSN: 1226-6116 (Print), 1598-6225 (Online) 1. Introduction
Fossil fuels, which are limited resources, are used as a primary source of energy in many countries. These resources have raised various concerns about meeting the growing demand for energy in recent years. With the Kyoto protocol signed due to the global warming effect caused by fossil fuels, some countries have turned towards renewable energy sources and started to make serious investments. GWEC expects that over 300 GW of new capacity will be added. That is more than 55 GW of new installations each year until 2023 (GWEC, 2019).
The energy generation capacities of wind turbines have resulted in the use of more efficient mechanical vehicles, higher tower lengths, and longer blade spans. It is important that turbines operate in increasingly demanding conditions and spend service life as efficiently as possible. Due to operating conditions, turbines are continuously subject to stochastic and dynamic wind loads. Brings to the fore the concept of fatigue on the elements by the effect of cyclic dynamic loads. Fatigue can be explained by the spread of micro-cracks caused by repetitive load exposure with loading and causing unforeseen instability problems. Indicatively, 12% of the overall number of accidents is attributed to structural failure and 6.8% is due to material fatigue (Chou and Tu 2011).
Corresponding author, Ph.D. Student E-mail: [email protected]aPh.D. Student, Research Assistant
E-mail: [email protected]
bPh.D. Associate Professor
E-mail: [email protected]
The typical service life of a wind turbine is 20 years, primarily because of fatigue-related failure of the wind turbine components, such as the rotor or the blades (Manwell et al. 2010). Designing the tower to have the same lifespan as other components is clearly desirable for the optimization of the wind turbine system. Tower base fatigue analyzes, and fatigue life evaluations of wind turbines have been examined in many studies. Van der Tempel (Van der Tempel 2006) carried out fatigue analysis of offshore turbines using spectral methods. Yeter et al. (2015) modeled the critical hotspot locations of the tripod offshore wind turbine support structure using the finite element program. They evaluated the comparison of various fatigue damage approaches. Gao et al. (2019) calculated the stresses caused by the loads on the turbine using a finite element program and as a result of that evaluated the cumulative fatigue damage. In addition to that, in their study, they assessed probabilistic wind speeds and the direction of the impact of the wind and calculated the fatigue life of the turbine by taking these into account. Li et
al. (2018) achieved comparative fatigue values for the spar
type offshore wind turbine based on different direction wave parameters and different wind speeds using an aeroelastic simulator. This study focuses on the fatigue life of the tower base connection exposed to wind load. For each wind speed, the design load conditions given in the IEC wind design standard were modeled. It aimed to compare the possibility that the turbine could be in different operational conditions.
The FAST (Jonkman and Buhl 2005) code, a comprehensive aerodynamic simulator produced by NREL (National Renewable Energy Laboratory) as open source software, was used for wind turbines exposed to nonlinear wind load in the time domain. Annual wind data of the coast
Special cases in fatigue analysis of wind turbines
Onur Güneş
1,2,
Elif Altunsu
1,2aand Ali Sari
1b1Department of Civil Engineering, Istanbul Technical University, Istanbul, Turkey 2Department of Civil Engineering, İstanbul University-Cerrahpasa, İstanbul, Turkey
(Received November 12, 2020, Revised April 14, 2021, Accepted April 20, 2021)
Abstract. The turbine industry demands a reliable design with affordable cost. As technological advances begin to support
turbines of huge sizes, and the increasing importance of wind turbines from day to day make design safety conditions more important. Wind turbines are exposed to environmental conditions that can affect their installation, durability, and operation. International Electrotechnical Commission (IEC) 61400-1 design load cases consist of analyses involving wind turbine operating conditions. This design load cases (DLC) is important for determining fatigue loads (i.e., forces and moments) that occur as a result of expected conditions throughout the life of the machine. With the help of FAST (Fatigue, Aerodynamics, Structures, and Turbulence), an open source software, the NREL 5MW land base wind turbine model was used. IEC 61400-1 wind turbine design standard procedures assessed turbine behavior and fatigue damage to the tower base of dynamic loads in different design conditions. Real characteristic wind speed distribution and multi-directional effect specific to the site were taken into consideration. The effect of these conditions on the economic service life of the turbine has been studied.
of the Netherlands were produced and used for these analyses using the TurbSim (Jonkman and Buhl 2006) wind simulator for the known coordinate of wind distribution and turbulence intensity. The moments and forces formed at the base of the tower calculated by FAST simulator were calculated and the stresses were read at different points of the tower section with special MATLAB codes written. Variable stresses were collected as histograms using the rainflow counting method, and damage was determined by S-N curves determined by the standards for the examined detail. The Palmgren-Miner (Palmgrem 1924) (Miner 1945) method, a cumulative damage accumulation method, was used.
2. Fatigue methodology
Fatigue is a process in which damage accumulates on a component due to the implementation of repetitive load cycles that may be well below the material's yield (Gunes et
al. 2019). This is precisely the case of wind turbines since
their operating environment includes turbulent and rapidly changing wind flow conditions. Due to these repeated loads, small cracks will occur on the components. Over time, cracks grow and can cause unpredictable sudden fractures. The parent material of the tower very rarely suffers from fatigue failure, whereas details like local connections, welds, and bolts are more vulnerable to developing failures related to fatigue loading. Fatigue is the most important control criterion that determines the economic life of wind turbines.
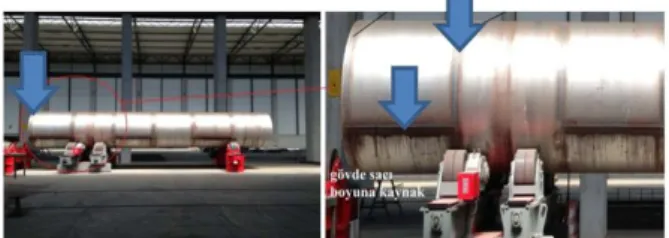
Basically, welding is applied on the tower in three main parts. These are welding for being cylinder, welding between two cans and welding between flange and section (Sahin 2009). Details are presented in Fig. 1.
Calculating the stresses that the detail is subjected to, taking into account possible load situations during the service life, results in a large number of stress series. For structures subjected to variable stresses, the flowchart of fatigue analysis conducted in the time domain is summarized in Fig. 2. The Miner rule states that the detail
will not fail due to fatigue if Dfat < 1.0.
2.1 Miner’s rule
In 1945, M. A. Miner and A. Palmgren developed the linear damage hypothesis as a practical design tool. According to this hypothesis, if the total life of the material for different stress magnitudes with constant amplitudes is known, the effect of each stress amplitude can be found:
𝐷𝑓𝑎𝑡 = ∑ 𝑛𝑖 𝑁𝑖 𝑘 𝑖=1 (1) where 𝑛𝑖 is the number of cycles the structural detail
endures at stress range 𝜎𝑖, 𝑁𝑖 is the number of cycles to
failure at stress range 𝜎𝑖.
2.2 Goodman mean stress correction
The S-N curves suggested by the standards do not take into account the mean stress effect. It has been calculated for a particular stress range. Goodman, Gerber or Soderberg corrections are commonly used to take into account the mean stress effect on the material fatigue behavior (Barrera
et al. 2020). These corrections relate the stress amplitude
(∆𝜎) for a mean stress (𝜎𝑚), with the stress that would
provide the same fatigue life with a mean stress equal to zero (∆𝜎0), by means of the following expression:
∆𝜎 = ∆𝜎0[1 − ( 𝜎𝑚 𝜎𝑅 ) 𝑛 ] (2)
where n = 1 for the Goodman and Soderberg corrections, n = 2 for the Gerber correction, 𝜎𝑅 is the yield strength for
the Soderberg correction and 𝜎𝑅 is the ultimate strength for
the Goodman and Gerber corrections.
2.3 S—N Curve
The S-N curves used in fatigue assessment are based on data obtained in fatigue tests. The S-N curves defined in DNV (DNV-RP-C203, 2010) by Eq. (3): where a, m and k are parameters of the S-N curve, N is the number of cycles Fig. 1 Welding connections in the tower (Kanbur 2014)
to failure at constant stress range ∆𝜎 were used to calculate the number of cycles to failure. The thickness effect is explained by a change in tension such that the design S-N curve is greater than the reference thickness. With this change in the S-N curve, it becomes as follows:
log(𝑁) = 𝑙𝑜𝑔𝑎̅ − 𝑚. 𝑙𝑜𝑔 (∆𝜎 ( 𝑡
𝑡𝑟𝑒𝑓
)
𝑘
) (3)
3. Site assessment and wind turbine model 3.1 Wind data
Throughout this study, structures are considered to be located at 520 27’ North latitude and 40 32’ East on the west
coast of The Netherlands, by side of North Sea. Ijmuiden was chosen as the site for consideration of fatigue analysis as it was close to the shore and wind speed distribution confirmed it to be a Class I (reference velocity, 𝑉𝑟𝑒𝑓 of 46.5
m/s) site. The operational wind speeds range from 3.4 m/s to 24.1 m/s and are subdivided into 16 wind speed (Gupta 2015).
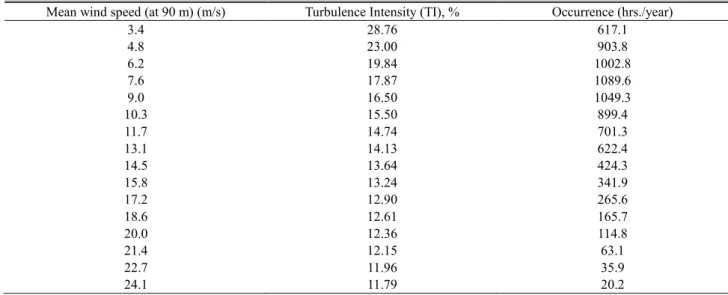
The scatter diagram table containing the duration of occurrence and the intensity of turbulence corresponding to the average wind speed is presented in Table 1.
The measuring instrument is an onshore station on the coast pier and is positioned at an elevation of 18.5 meters. To adjust the wind data measured at the reference altitude to the hub height of the turbine of 90 m, the roughness height was taken as 0.03 m and the logarithmic scaling law was used. The turbulent intensity calculation is based on Normal Turbulence Model, Class C ( lo wer turb ulence) characteristics due to flat terrain, no observable obstacles and near-sea location of site. Fatigue life increases rapidly with decreased turbulence intensity, as one might expect. Fatigue life also depends heavily on the annual mean wind velocity and the distribution of wind velocity at each site. In general, sites with higher annual mean wind velocities
Fig. 3 Wind frequency rose
experience lower fatigue life, which is intuitively obvious. However, depending on the variance of wind velocity in a year (shape parameter of the Weibull distribution), fatigue life may not be proportional to the annual mean wind velocity (Do et al. 2015). Knowing the prevailing wind direction (s) of the turbine location is essential in turbine analysis. The wind rose divides a compass into sectors (usually 8 or 16) and indicates the average wind speed, average percentage of time that the wind blows from each direction, and/or the percentage of energy in the wind by sector. (Olsen and Preus 2015). The wind rose shown in Fig. 3 represents the distribution of the wind direction at the selected site.
Development of the Kaimal model dates to the 70s (Kaimal et al. 1972, 1976); these studies led to the Kaimal spectrum with coherence, which considers the behavior of spectra and spectra of turbulence in the surface layer using wind velocity and temperature (Udoh and Zou 2019). A power law profile with an exponent of 0.12 is used to examine the wind-shear effect. Wind-induced fatigue depends to some extent on the spectral distribution of wind energy, it is imperative to understand whether the energy distributions vary with wind field resolution (Udoh and Zou 2019). Weibull distribution representing annual wind data is presented in Fig. 4.
Table 1 Lumped Scatter Diagram for Ijmuiden Site
Mean wind speed (at 90 m) (m/s) Turbulence Intensity (TI), % Occurrence (hrs./year)
3.4 28.76 617.1 4.8 23.00 903.8 6.2 19.84 1002.8 7.6 17.87 1089.6 9.0 16.50 1049.3 10.3 15.50 899.4 11.7 14.74 701.3 13.1 14.13 622.4 14.5 13.64 424.3 15.8 13.24 341.9 17.2 12.90 265.6 18.6 12.61 165.7 20.0 12.36 114.8 21.4 12.15 63.1 22.7 11.96 35.9 24.1 11.79 20.2
Fig. 4 Calculation of Weibull Parameters
Fig. 5 Tower configurations
The turbulent full-field three-component wind conditions were generated with TurbSim. The Kaimal wind spectrum was used because TurbSim does not have the capability of generating turbulent-wind inflow with the IEC-recommended Mann model (The IEC design standards also allow for the use of the Kaimal wind spectrum) (Jonkman, 2007).
3.2 NREL 5-MW onshore wind turbine
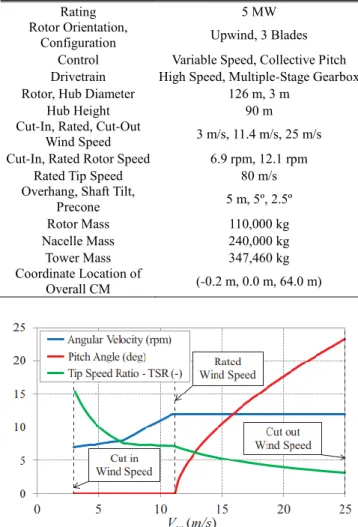
The wind turbine model used for the analysis in FAST is the NREL 5 MW wind turbine (Jonkman et al. 2009). The turbine is a three bladed, up-wind, variable speed, pitch-controlled turbine, with a 126 m rotor diameter and a 90 m hub height. This turbine model is widely used by many other researchers. It is assumed to be linear conical from tower base to top of the tower with 87.60 m elevation, base diameter 6.00 meters, and 0.027 meters thickness, top diameter 3.87 meters, and 0.019 meters thickness in terms
of turbine tower specifications. Detailed tower
configurations are shown in Fig. 5. The main properties of the 5 MW NREL reference turbine are shown in Table 2 and are hereinafter brief presented for completeness.
The addition of advanced controllers to wind turbines increases the power efficiency and reduces the structural loadings. Therefore, the turbines with advanced controllers can capture more energy from the wind and possess a
Table 2 Turbine properties/dimensions
Rating 5 MW
Rotor Orientation,
Configuration Upwind, 3 Blades Control Variable Speed, Collective Pitch Drivetrain High Speed, Multiple-Stage Gearbox Rotor, Hub Diameter 126 m, 3 m
Hub Height 90 m
Cut-In, Rated, Cut-Out
Wind Speed 3 m/s, 11.4 m/s, 25 m/s Cut-In, Rated Rotor Speed 6.9 rpm, 12.1 rpm
Rated Tip Speed 80 m/s
Overhang, Shaft Tilt,
Precone 5 m, 5º, 2.5º Rotor Mass 110,000 kg Nacelle Mass 240,000 kg Tower Mass 347,460 kg Coordinate Location of Overall CM (-0.2 m, 0.0 m, 64.0 m)
Fig. 6 Steady-state responses as a function of wind speed
longer life span (Sahin 2018). Due to the coupled model of rotating blades and tower under wind loading (Ilhan et al. 2018, Ke et al. 2019), and the control systems which ensures wind turbines operate within the design range (such as yaw the turbine, start or stop the turbine, and keep the rotational speed and the power output within a certain range), the dynamical behavior of wind turbines exhibits obvious nonlinearity (Zhu and Shuang 2020).
Steady-state response of the wind turbine is obtained by analysis performed under steady and uniform wind conditions. Blade pitch, trends of rotor speed, and blade tip speed versus cut-in and cut-out wind speeds of the turbine are given in Fig. 6.
4. Design load cases
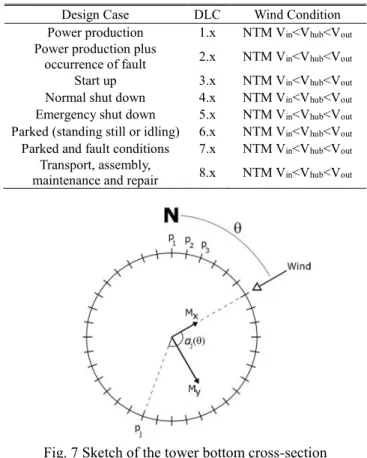
The IEC 61400 (International Electrotechnical Co mmi s s i o n, 2005) de si gn s ta nd ard se t s de s i gn requirements for wind turbines. The design standard is important for the analysis of the ultimate loads and structural integrity. It aims to determine the final and fatigue loads that will occur on the turbine. Determines the different modes the turbine may encounter during its service life. These operational situations represent eight different
Table 3 Analysis conditions
Design Case DLC Wind Condition
Power production 1.x NTM Vin<Vhub<Vout
Power production plus
occurrence of fault 2.x NTM Vin<Vhub<Vout Start up 3.x NTM Vin<Vhub<Vout
Normal shut down 4.x NTM Vin<Vhub<Vout
Emergency shut down 5.x NTM Vin<Vhub<Vout
Parked (standing still or idling) 6.x NTM Vin<Vhub<Vout
Parked and fault conditions 7.x NTM Vin<Vhub<Vout
Transport, assembly,
maintenance and repair 8.x NTM Vin<Vhub<Vout
Fig. 7 Sketch of the tower bottom cross-section
Fig. 8 Fatigue damages at different points of the cross section
situations that include normal operation, startup, shutdown, emergency shutdown, maintenance, parked situation, and conditions that may occur due to system failures of these conditions. In this study the 8.x case, which relate to transport, assembly, maintenance, and repair was ignored. The conditions applied in the analyses are given in Table 3.
For DLCs 2.x and 7.x, which involve fault conditions, the IEC design standards require choosing faults with the worst consequences. Common design-driving faults are chosen depending on land-based wind turbine loads analyses. For DLC 2.x, a fault in the rotor-collective blade-pitch control system was simulated where one blade ignores
its command and runs away to the minimum set point of 0º at the full pitch rate of 8º/s. For DLC 7.x, the fault condition where one blade is seized at the minimum set point (i.e., flat into the wind) was simulated while idling with the other two blades fully feathered (Jonkman 2007).
In DLC 3.x it can be enabled by pitching the blades from feather to the run position and let the wind accelerate the rotor until a certain speed is reached. For DLC 4.x, all blades are fully feathered to the maximum pitch setting of 90º with low pitch rate. For DLC 5.x, all blades are fully feathered to the maximum pitch setting of 90º with 80/s
pitch rate. The fully deployed high-speed shaft-brake torque system with 28116.2 Nm power applied alongside aerodynamic braking contributes to the emergency closure of the turbine.
5. Analysis results
Results of different wind conditions analyzed by wind turbine aerodynamic simulator FAST software the stresses at different points on the tower were calculated using Matlab code. The stress-time histories were converted to histograms of the number of cycles and stress ranges using rainflow counting method (Nunez-Casado et al. 2017). The partial damage was calculated for each stress range using the Palmgren-Miner rule. Stress range histograms refer to the cycle numbers for each stress level. The annual number of cycles of the histogram derives from the sum of the cycles of each 10 min wind multiplied by the relevant probability of occurrence, multiplied by the number of 10-minute durations in one year.
𝜎 =𝐹𝑧 𝐴+ 𝑀𝑦 𝐼𝑦 . 𝑟. cos 𝜃 −𝑀𝑥 𝐼𝑥 . 𝑟. cos 𝜃 (1)
Where σ is the stress at a given point in the cross section, My and Mx are fore-aft and the side-side bending
moments at the base of tower, Fz is the lateral load, A is the
cross-sectional area, Ix=Iy is moment of inertia of annulus, r
is cross section radius and q is the angle from point 1 to the calculated point in counterclockwise direction.
To include the wind direction in the analysis, the tower section is divided into 72 equal parts (Fig. 7). To obtain the simplicity, the door of the tower was not considered because this was not expected to affect the conclusion of this study.
As a result of the analysis for the parent material, the fatigue values at different points of the cross section are shown in the Fig. 8. The figure shows annual fatigue damage that occurs at different points of the circular cross section. Fatigue damage is observed at different angles of the cross section. It has proven that wind direction must be clearly taken into account in the fatigue analysis of wind turbine towers. In this study, spread wind rose was used to evaluate the full directional approach (Slot et al. 2018).
By using the FAST output data, a deterministic perspective was gained by multiplying the fatigue matrix obtained at different points around the cylinder and the matrix of the wind direction. As a result of the scalar multiplication with the occurrence time of the wind speed,
Fig 9 Accumulated fatigue damage in 10 min of each design load case
the fatigue values on the cylinder were obtained.
Maximum fatigue damage on the cross section for parent material occurred at an angle of 240 degrees. The turbine has been assumed as power production (DLC 1.x). The annual fatigue damage is calculated as 0.0033. As a result of the analysis conducted for Seam weld, annual fatigue damage was calculated as 0.0225. In this analysis, the S-N curve presented in the DNV standard was used and the thickness multiplier was applied as 0.05 and tref 0.025 for this components detail. The circular welding detail is assumed at 8.76 meters high. Tower thickness and diameter value of this coordinate were obtained by interpolation method. The stress concentration factor was neglected and the annual fatigue damage of the detail under these conditions was calculated as 0.0091.
Each time-domain simulations were run 10 min for the land-based turbine model and all simulations were run with all appropriate and available degrees-of-freedom (DOFs), including FAST’s two flapwise and one edgewise mode
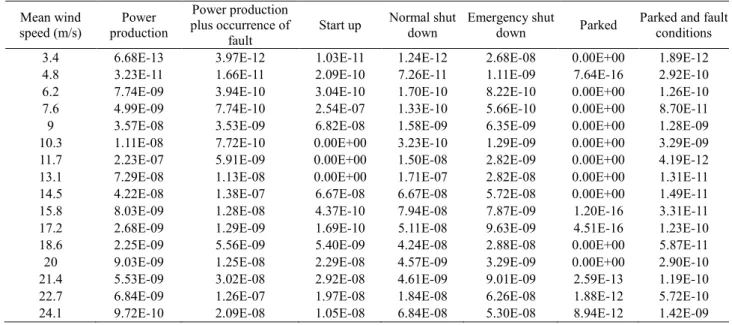
DOFs per blade, one drivetrain torsion DOF, one variable generator-speed DOF, one nacelle yaw DOF, two fore-aft and two side-to-side tower mode DOFs. An additional 30 seconds of simulation time (in addition to the times listed) was processed before outputting simulation data to eliminate any start-up transient behavior that may have otherwise spuriously affected the response predictions (Matha 2010). Therefore, the length of the wind data generated by TurbSim is 630 seconds. The land-based turbine model time-domain simulations were run for each design load case. As a result of the design conditions applied for all wind data, the maximum fatigue values occurring on the cross section are presented in Table 4.
6. Conclusions
Fatigue is a phenomenon that affects the service life of turbines. As a result of the analyzes made using wind data and turbulence values generated depending on the position, the stresses on the turbine components were obtained. This study has presented a realistic perspective with the codes written to take into account the effect of wind direction. The fatigue life of the tower components is satisfactory.
The design conditions included in the IEC 61400-1 standard have been simulated under different wind conditions and presented for comparison. In the table, it has been determined that generally occurrence of fault conditions have higher fatigue damages than conditions without fault. It appears that there is no stable distribution according to wind speeds. The fatigue values of the turbine analyzed under different design conditions and different winds are given in Fig. 9.
In parked (standing still or idling) conditions, there are stable situations. As expected, fatigue damage for the parking condition turbines is at its lowest level. In this analysis, there is more energy in the wind spectra at high wind speed (i.e., higher wind speed standard deviations), Table 4 Fatigue damage under different load cases
Mean wind speed (m/s) Power production Power production plus occurrence of fault Start up Normal shut down Emergency shut down Parked
Parked and fault conditions
3.4 6.68E-13 3.97E-12 1.03E-11 1.24E-12 2.68E-08 0.00E+00 1.89E-12
4.8 3.23E-11 1.66E-11 2.09E-10 7.26E-11 1.11E-09 7.64E-16 2.92E-10
6.2 7.74E-09 3.94E-10 3.04E-10 1.70E-10 8.22E-10 0.00E+00 1.26E-10
7.6 4.99E-09 7.74E-10 2.54E-07 1.33E-10 5.66E-10 0.00E+00 8.70E-11
9 3.57E-08 3.53E-09 6.82E-08 1.58E-09 6.35E-09 0.00E+00 1.28E-09
10.3 1.11E-08 7.72E-10 0.00E+00 3.23E-10 1.29E-09 0.00E+00 3.29E-09
11.7 2.23E-07 5.91E-09 0.00E+00 1.50E-08 2.82E-09 0.00E+00 4.19E-12
13.1 7.29E-08 1.13E-08 0.00E+00 1.71E-07 2.82E-08 0.00E+00 1.31E-11
14.5 4.22E-08 1.38E-07 6.67E-08 6.67E-08 5.72E-08 0.00E+00 1.49E-11
15.8 8.03E-09 1.28E-08 4.37E-10 7.94E-08 7.87E-09 1.20E-16 3.31E-11
17.2 2.68E-09 1.29E-09 1.69E-10 5.11E-08 9.63E-09 4.51E-16 1.23E-10
18.6 2.25E-09 5.56E-09 5.40E-09 4.24E-08 2.88E-08 0.00E+00 5.87E-11
20 9.03E-09 1.25E-08 2.29E-08 4.57E-09 3.29E-09 0.00E+00 2.90E-10
21.4 5.53E-09 3.02E-08 2.92E-08 4.61E-09 9.01E-09 2.59E-13 1.19E-10
22.7 6.84E-09 1.26E-07 1.97E-08 1.84E-08 6.26E-08 1.88E-12 5.72E-10
therefore it can be said that fatigue damage increases with wind speed. Incorrect positioning of the blade element in the case of parking increased fatigue values. When shutdown cases were evaluated, it was calculated that the effect of emergency shutdown case had a higher contribution to fatigue. In addition, emergency shutdown prevents the low oscillate state of the rotor with the effect of the mechanical braking used.
In the operational mode, the highest fatigue damage value was observed for the rated speed value. When DLC 1 and DLC 2 are compared, it is seen that power production plus occurrence of fault conditions cause more fatigue damage at high wind speeds. At low wind speeds, it is seen that the power producing turbine is exposed to more dynamic conditions.
References
Barrera, C., Battistella, T., Guanche, R. and Losada, I.J. (2020), “Mooring system fatigue analysis of a floating offshore wind turbine”, Ocean Eng., 195, 106670.
https://doi.org/10.1016/j.oceaneng.2019.106670.
Chou, J.S. and Tu, W.T., (2011), “Failure analysis and risk management of a collapsed large wind turbine tower”, Eng. Failure Analysis, 18, 295-313.
https://doi.org/10.1016/j.engfailanal.2010.09.008.
DNV-RP-C203 (2010), Fatigue Design of Offshore Steel Structures
Do, T.Q., Mahmoud, H. and van de Lindt, J.W. (2015), “Fatigue life of wind turbine tower bases throughout Colorado”, J. Perform. Construct. Facilities, 29(4), 04014109. https://doi.org/10.1061/(ASCE)CF.1943-5509.0000612. Gao, Q., Liu, S., Fan, J. and Shen, Z. (2019), “Wind-induced
fatigue analysis of wind turbine steel tower”, Earth Environment. Sci., 310(3), 032007.
https://doi.org/10.1016/j.engstruct.2015.07.038.
Gunes, O., Altunsu, E. and Sarı, A. (2019), “Yorulma Etkisideki Rüzgar Türbinlerinin Yaşam Ö mürlerinin Değerlendirilmesi”, 2019 3rd International Symposium on Multidisciplinary Studies and Innovative Technologies (ISMSIT), Ankara, Turkey, October. https://doi.org/10.1109/ISMSIT.2019.8932844. Gupta, N. (2015), “Loads Analysis of the NREL 5-MW Reference
Turbine for an Onshore Site”, Master’s Internship at Fraunhofer Institute for Wind Energy and Energy System Technology (IWES), Bremerhaven, Germany.
GWEC (2019), “Global Wind Report 2018”, Global Wind Energy Council, Brussels, Belgium.
Ilhan, A., Bilgili, M. and Sahin, B. (2018), “Analysis of aerodynamic characteristics of 2 MW horizontal axis large wind turbine”, Wind Struct., 27(3), 187-197.”
https://doi.org/10.12989/was.2018.27.3.187.
International Electrotechnical Commission (2005), IEC 61400-1 Wind Turbines - Part 1: Design requirements. Wind Turbines – Part 1: Design Requirements, 1-92. https://doi.org/10.1055/s-2007-985912.
Jonkman, B.J. and Buhl, M.L., Jr. (2007), “TurbSim User’s Guide”, NREL/EL-500-41136, Golden, CO: National Renewable Energy Laboratory.
Jonkman, J.M. (2007), “Dynamics Modeling and Loads Analysis of an Offshore Floating Wind Turbine”, National Renewable Energy Laboratory NREL/TP-500-41958, 68(November), 233. http://www.nrel.gov/docs/fy08osti/41958.pdf
Jonkman, J., Butterfield, S., Musial, W. and Scott, G. (2009), Definition of a 5-MW Reference Wind Turbine for Offshore
System Development. Contract, February, 1-75. http://tethys-development.pnnl.gov/sites/default/files/publications/Jonkman_ et_al_2009.pdf
Jonkman, J.M. and Buhl Jr, M.L. (2005), “FAST User’s Guide”, National Renewable Energy Laboratory, Golden, CO, Technical Report No. NREL/EL-500-38230.
Kaimal, J.C., Wyngaard, J.C., Haugen, D.A., Cote, O.R. and Izumi, Y. (1976), “Turbulence structure in the convective boundary layer”, J. Atmosph. Sci., 33(417), 2152-2169. https://doi.org/10.1175/15200469(1976)033<2152:TSITCB>2.0 .CO;2.
Kaimal, J.C., Wyngaard, J.C., Izumi, Y. and Cote, O.R. (1972), “Spectral Characteristics of Surface-layer Turbulence”, J. Roy. Meteorol. Soc., 98(417), 563-589.
https://doi.org/10.1002/qj.49709841707.
Kanbur, F.A. (2014), “500 KW Enerji Kapasiteli Bir Ruzgar Turbinin Ç elik Kule Tasarimi”, Master Thesis, Istanbul Technical University, Turkey.
Ke, S.T., Wang, X.H., and Ge, Y.J. (2019), “Wind load and wind-induced effect of the large wind turbine tower-blade system considering blade yaw and interference”, Wind Struct., 28(2), 71-87. http://dx.doi.org/10.12989/was.2019.28.2.071.
Li, H., Hu, Z., Wang, J. and Meng, X., (2018), “Short-term fatigue analysis for tower base of a spar-type wind turbine under stochastic wind-wave loads”, Int. J. Naval Architect. Ocean Eng., 10(1), 9-20. https://doi.org/10.1016/j.ijnaoe.2017.05.003. Manwell, J.F., Mcgowan, J.G. and Rogers, A.L. (2010), “Wind
Energy Explained-Theory, Design and Application”, Royal academic of engineering, Wiley, Chichester, U.K.
Matha, D., Fischer, T., Kuhn, M. and Jonkman, J. (2010), “Model development and loads analysis of a wind turbine on a floating offshore tension leg platform”, (No. NREL/CP-500-46725). National Renewable Energy Lab. (NREL), Golden, CO (United States).
Miner, M.A. (1945), “Cumulative damage in fatigue”, J. Appl. Mech., 12(3), 159-164.
Nunez-Casado, C., Lopez-Garcia, O., de las Heras, E.G., Cuerva-Tejero, A. and Gallego-Castillo, C. (2017), “Assembly strategies of wind turbine towers for minimum fatigue damage”, Wind Struct., 25(6), 569-588.
https://doi.org/10.12989/WAS.2017.25.6.569.
Olsen, T. and Preus, R. (2015), “Small wind site assessment guidelines”, National Renewable Energy Laboratory NREL/ TP-5000-63696, 1-51.
Palmgren, A. (1924), “Die lebensdauer von kugellagern”. Zeitschrift des Vereinesdeutscher Ingenierure, 68(14), 339-341. Sahin S. (2016), “Wind Turbine Tower Structures Analysis
According to Wind Load in Terms of Cost”, Master. Thesis, University of Liege, Szczecin, Poland.
Sahin, M. (2018), “Dynamic Modeling, Control and Adaptive Envelope Protection System for Horizontal Axis Wind Turbines”, Ph.D. Dissertation, Middle East Technical University, Turkey
Slot, R.M.M., Svenningsen, L., Sørensen, J.D. and Thøgersen, M. L. (2018), “Directional fatigue accumulation in wind turbine steel towers”, J. Phys.: Conference Series, 1102, 012017. https://dx.doi.org/10.1088/1742-6596/1102/1/012017.
Udoh, I.E. and Zou, J. (2019), “Wind spectral characteristics on fatigue responses of towerbase and moorings of a floating offshore wind turbine”, Ocean Syst. Eng., 9(2), 191-218. https://doi.org/10.12989/ose.2019.9.2.191.
Van der Tempel, J. (2006), Design of Support Structures for Offshore Wind Turbines, Report no. 2006.029, Delft University Wind Energy Research Institute (DUWIND).
Yeter, B., Garbatov, Y. and Soares, C.G. (2015), “Fatigue damage assessment of fixed offshore wind turbine tripod support structures”, Eng. Struct., 101, 518-528.
https://doi.org/10.1016/j.engstruct.2015.07.038.
Zhu, Y. and huang, M. (2020), “Influence of non-Gaussian characteristics of wind load on fatigue damage of wind turbine”, Wind Struct., 31(3), 217-227.
https://doi.org/10.12989/was.2020.31.3.217.