ISSN 1225-7842 / eISSN 2287-402X http://dx.doi.org/10.7779/JKSNT.2017.37.2.91
1. Introduction
1.1. Research Background and Objectives
As demand for light and rigid structures increases, the employment of composite materials is also increasing steadily. Among others, GFRP and CFRP are the most widely used ones, and CFRP is mainly used in case of requiring high rigidity. According as the prices of composite materials get cheaper than the past, the use of CFRP tends to increase more and more. In particular, the use of CRFP in the area of aero- space is increasing greatly. Recently, composite materials have been usually used in the main wings, ailerons and fuselages of aircraft and the rotor blades of helicopters [1]. In the case of an aircraft using composite material for rapid-
moving structures, their physical reactions to external shock also become different from those of the existing metal structures [2,3]. While as for metal structures, external impact has the effect of elastic deformation or plastic deformation on the structures, as for composite materials, impact load can lead to the phenomenon of fiber tissue destruction as well as deformation in the composite materials, resulting in the problems of the weakened rigidity of composite structures, water penetration into a tiny crack and so on [4]. Hence, this study applied impact load to CRFP composite specimens by using the infrared thermography technology [5] and different light sources, and then investigated a method for detecting damage to composite materials more quickly and more accurately.
Study on the Performance of Infrared Thermal Imaging Light Source for
Detection of Impact Defects in CFRP Composite Sandwich Panels
Hee-Sang Park*, Man-Yong Choi**✝, Koo-Ahn Kwon**, Jeong-Hak Park**, Won-Jae Choi**and Hyun-Chul Jung***
Abstract Recently, composite materials have been mainly used in the main wings, ailerons, and fuselages of aircraft and rotor blades of helicopters. Composite materials used in rapid moving structures are subject to impact by hail, lightning, and bird strike. Such an impact can destroy fiber tissues in the composite materials as well as deform the composite materials, resulting in various problems such as weakened rigidity of the composite structure and penetration of water into tiny cracks. In this study, experiments were conducted using a 2 kW halogen lamp which is most frequently used as a light source, a 2 kW near-infrared lamp, which is used for heating to a high temperature, and a 6 kW xenon flash lamp which emits a large amount of energy for a moment. CFRP composite sandwich panels using Nomex honeycomb core were used as the specimens. Experiments were carried out under impact damages of 1, 4 and 8 J. It was found that the detection of defects was fast when the xenon flash lamp was used. The detection of damaged regions was excellent when the halogen lamp was used. Furthermore, the near-infrared lamp is an effective technology for showing the surface of a test object.
Keywords: CFRP, Infrared Thermography, Halogen Lamp, Xenon Flash Lamp, Near Infrared Lamp
[Received: March 15, 2017, Revised: April 20, 2017 / April 26, 2017, Accepted: April 26, 2017] *R&D, Korea Research Institute of Smart Material and Structures System Association, Daejeon 35222, Korea, **Safety measurement center, Korea research Institute of Standards and Science, Daejeon 34113, Korea, ***Department of Mechanical Engineering Chosun University, Gwangju 61452, Korea, ✝Corresponding Author: [email protected]
The composite material used in the experi- ment was CFRP. Composite materials can be fabricated in a variety of forms according to the weaves of fiber tissues, and in the case of aircraft structures, composite materials in the form of plain weave are mostly used. Hence, this study used the composite materials 2.06 mm (2 mm) and 3.03 mm (3 mm) in thickness fabricated in the form of plain weave. The specimens were made in the size of 60 mm × 60 mm to fit the measurable size of the impact tester, as shown in Fig. 1, and were fabricated as sandwich panels with honeycomb structure being inserted between the composite materials. For the materials of the composite, ARRIS 3K prepreg and T 300 UD were used, and plain- weave prepreg was bonded before and after UD prepreg. For the specimen 2 mm in thickness, CFRP was laid up to form 9 layers, and for 3 mm, it was laid up to form 12 layers. As for the honeycomb core used inside, it was a honeycomb structure of aerospace-grade aramid fiber, and DuPont Nomex paper coated with heat-resistant phenolic resin was used for it. As for the honeycomb, it consisted of 1/8-inch cells, and used cells 0.93 inch in thickness. Functional properties is CTE –0.41 α⋅10-6/˚C, Specific Heat = 0.19 Cal/g⋅˚C, Thermal Con- ductivity = 0.025 Cal/cm⋅s⋅˚C.
When the thickness of the material is the same, the thermal conductivity are high, The lower the specific heat, the easier it is to detect defects. This is because the penetration depth of the heat increases when the same heat are applied to the specimen. The faster the heat is conducted, the deeper and wider the defect can be detected. However, considering the temperature saturation due to heat, the excitation frequency should be appropriately adjusted.
For the fabrication of impact test specimens, experiment was conducted by increasing impact
from 1 J to 4 J and 8 J with an impact tester of drop impact type (Instron 9350), which is operated at KOLAS accredited institutions. The circumference of the impact tester's hammer was 20 mm. 3. Experiment Method
Defect detection methods through infrared thermography can be largely divided into two kinds, passive methods and active methods. The method used for this experiment was lock-in infrared thermography method out of all the active methods, and it can calculate the size of defects by taking a particular stimulus as harmonic function and conveying it to the target object and then processing the response signals from the target object. To detect defects effectively, the lock-in phase technique was applied to the experiment, Active infrared thermography inspection is a method of detecting thermal energy emitted from the inspection object when energy is applied to an inspection object [6]. Three types of light sources were used for the experiment. The first one was a 2 kW light source, the second one was a 2 kW near-infrared lamp, and the third one was a 6 kW xenon flash lamp. In order to apply the lock-in thermography method. The device was constructed so that the output of the halogen lamp and the output of the near infrared lamp were the same. In the case of a xenon lamp, a temperature image by a short pulse method
CFRP 3 mm CFRP 2 mm
Fig. 1 Specimen of honeycomb sandwich composite with water impregnation defects
which cannot use the lock-in thermography technique was used. The experiment was carried out by using the reflection method, as shown in Fig. 2. As for the transmission method, the pilot experiment showed that no damage was found regardless of light sources, and thus only the reflection method was used. Perhaps the possibility of defect detection will increase, that CFRP specimen thickness is thinner than 2 mm and the honeycomb core thickness is than 12.5 mm thinner. As for the distance of light sources, excitation was carried out at a distance of 500 mm. For the detection of damage, the lock-in method was used in the case of the halogen lamp and the near-infrared lamp, and only temperature graphs were used in the case of the xenon flash lamp. The light-source heating time was 2/3 seconds at different frequencies of 100, 200, 800, and 1600 mHz, and in the case of excitation by the use of the xenon flash lamp, images obtained after applying one-time light- source impact, not frequency heating, were used. The selected a frequency of 200 mHz to obtain fast and clear defect images through preliminary experiments. Also, selected a frequency of 800 mHz to check for the presence of defects. At 100 mHz, slightly better defect detection results were obtained, but detection of defects took longer. In addition, there was not a large difference between the defect images at 100 mHz and 200 mHz. For this reason, 200 mHz was selected. As an infrared thermal-imaging camera, this study used Silver 420 m Model (NETD: 25 mK) made by French Cedip Company.
4. Experiment
4.1. Defect Detection by the Use of Halogen Lamp
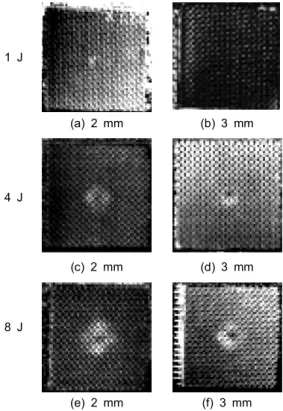
Fig. 3 shows lock-in thermography in case of heating for a period of the sine frequency of 200 mHz by using the halogen lamp [7,8]. It is shown that the higher the impact energy applied to the specimen, the larger the size of damage. It is shown that greater damage occurs in the 2 mm-thick specimen than the 3 mm-thick specimen. And the thermography image shows that the diamond-shaped damage becomes nearly circular damage as the frequency is lowered. From Fig. 3 (a) and (b), it is found that impact with the energy of 1 J left indentation (deformation) on the 2 mm-thick specimen, but Fig. 2 Reflection & transmission infrared thermography
method 1 J (a) 2 mm (b) 3 mm 4 J (c) 2 mm (d) 3 mm 8 J (e) 2 mm (f) 3 mm
Fig. 3 Phase lock in infrared thermography of impact defect specimen by using halogen lamp (200 mHz, sine signal, halogen lamp )
not on the 3 mm-thick specimen. It is judged that this is associated with the existence of breakage to the specimens caused by impact load. From (e) and (f), it is found that in case of indentation, plastic deformation occurred in the specimen. Particularly, while a cruciform bright image usually shows a damaged part, it is judged that the image of damage appeared in the dark circular image region. That is, it may be said that in case of breakage in an area to which impact energy was applied, change in the image appears as an image different from the image of no defect. Fig. 4 presents lock-in thermography images shown when heating at 800 mHz with the halogen lamp. And it was found that the size of damage is small compared with Fig. 3. Particularly, with 4 J, some damage was identifiable only at the 2 mm-thick specimen, and the 3 mm-thick specimen showed no damage. 1 J (a) 2 mm (b) 3 mm 4 J (c) 2 mm (d) 3 mm 8 J (e) 2 mm (f) 3 mm
Fig. 5 Phase lock in infrared thermography image of impact defect specimen using near infrared lamp (200 mHz, sine signal, halogen lamp)
4.2. Defect Detection by the Use of Near Infrared Lamp
Fig. 5 presents lock-in thermography shown when heating for the period of 200-mHz sine frequency by using the near-infrared halogen lamp. As in the experiment with the halogen lamp, it was found that the higher the impact energy applied to the specimen and the thinner the specimen, the greater the damage. The greatest difference from the experiment with the halogen lamp is the problem that as the material of CFRP composite in the form of plain weave appears clearly, it works as noise to the damage image. This showed that while it might be effective to use near infrared ray as means to identify the material surface, it causes difficulty in the detection of damage, compared with the method of using the halogen lamp. Fig. 6 shows images when heating at 800 mHz with the 1 J (a) 2 mm (b) 3 mm 4 J (c) 2 mm (d) 3 mm 8 J (e) 2 mm (f) 3 mm
Fig. 4 Phase lock in infrared thermography of impact defect specimen by using halogen lamp (800 mHz, sine signal, halogen lamp)
near-infrared lamp. Overall, damage is not shown very well, compared with Fig. 5.
Fig. 7 is a thermography of a specimen impacted with 8 J at 100 mHz. The defects appeared a little clearer. However, there was no significant difference between the defect images at 100 mHz and 200 mHz.
4.3. Defect Detection by the use of Xenon Flash Lamp
Fig. 8 presents thermography temperature images shown when exciting the light source of 6 kW instantaneously by using the xenon flash lamp [9]. All the images of Fig. 7 show damage images based on temperature gradients, not lock-in thermography of the previous experiment. 1 J (a) 2 mm (b) 3 mm 4 J (c) 2 mm (d) 3 mm 8 J (e) 2 mm (f) 3 mm
Fig. 6 Phase lock in infrared thermography image of impact defect specimen using near infrared lamp (800 mHz, sine signal, halogen lamp) halogen lamp (a) 2 mm (b) 3 mm near infrared lamp (c) 2 mm (d) 3 mm
Fig. 7 Phase Lock in infrared thermography image of impact defect specimen using near infrared lamp(100 mHz, 8 J, sine signal, halogen lamp) 1 (a) 2 mm (b) 3 mm 4 (c) 2 mm (d) 3 mm 8 (e) 2 mm (f) 3 mm
Fig. 8 Infrared thermography thermal image of impact defect specimen using xenon flash lamp (2/3 sec, pulse signal, xenon lamp)
They are thermography obtained at 2/3 seconds after flash went off. The shape of damage was similar to the image when heating at 200 mHz with the halogen lamp, but it was possible to identify clearer damage images. The greatest difference from the damage images using the halogen lamp is that while overall circular damage is found in the damage images of the impacted 8-layered 2 mm-thick specimen, only clear cruciform damage is found in Fig. 8 (e). Fig. 9 (a) shows thermography images and temperature graphs not treated with lock-in when heating at the period of 1600 mHz with the halogen lamp. The damage images are not clear, compared with the images using the flash lamp in (b). In particular, the results show that while the temperature gradient of damaged area in the case of the flash lamp is 0.30℃, the temperature gradient is below 0.19℃ in case of using the halogen lamp.
When the lamp was heated at 200 mHz for one cycle, the temperature of the halogen lamp increased by 0.8℃ and the temperature of the near infrared lamp increased by 2.0℃.
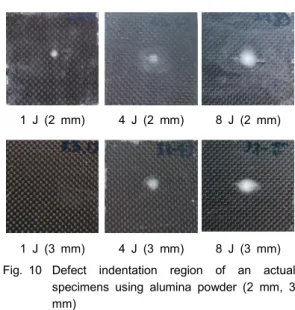
Fig. 10 shows images that identified the surface area of indentation by removing flat
parts after applying alumina power (5 μm) to show clearly the marks of indentation that occurred in the actual specimen. The damage size can be measured through thus distinguishing the damaged area. Tables 1 and 2 show the comparison between the actual damage sizes measured and the results of measurement by the thermography.
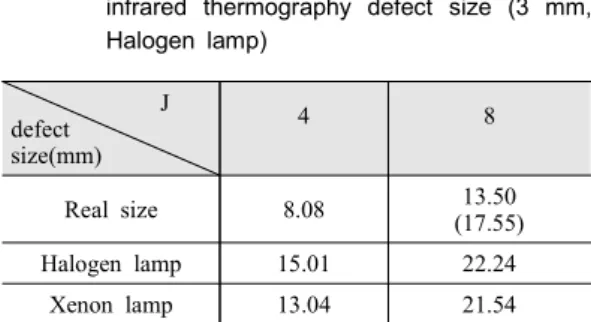
Table 1 shows the size of indentation on the 2 mm-thick specimen. It was found that the higher the impact energy, the greater the indentation actually appears. The damage sizes measured with thermography were found to be greater than damage sizes actually measured. In particular, the damage size measured with the halogen lamp was found to be greatest, and damage measured by the xenon flash lamp was found to be similar to or smaller than that measured with the halogen lamp. In addition, the damage size measured with the near-infrared lamp was the smallest measurement, but was greater than actual damage visible to the naked eye. This phenomenon also occurs in the 3 mm thick specimen in Table 2; as for the specimen impacted with 8 J, actual damage that appears to be a crack other than indentation was displayed in parentheses, and damage measured with thermography was equally found to be greater (a) 1600 mHz, 6 cycle; halogen lamp
(b) 2/3 sec ; xenon flash lamp
Fig. 9 Thermal image and temperature graph of defective specimen with heating time (2 mm, 8 J)
1 J (2 mm) 4 J (2 mm) 8 J (2 mm)
1 J (3 mm) 4 J (3 mm) 8 J (3 mm) Fig. 10 Defect indentation region of an actual
specimens using alumina powder (2 mm, 3 mm)
than the actual damage. These findings show that if the actual composite specimen is impacted, greater damage than visible damage to the naked eye exists inside the composite material.
5. Conclusion
This study investigated a method for detecting damage to CFRP composite material specimens to which impact energy was applied by using the halogen lamp, the near-infrared lamp, and the xenon flash lamp. And as a result, the following conclusion was drawn.
1) The most effective method for identifying a damaged region invisible to the naked eye was heating for time below 200 mHz with the halogen lamp.
2) As for a method for identifying the existence of damage within a short time, the xenon flash lamp showed excellent results, which were similar to the lock-in images using the halogen lamp, within 2/3 seconds without separate signal processing.
3) It was found that damage detection with the near-infrared lamp is an effective technology for identifying the surface of a test object, though inferior to the halogen lamp and the xenon lamp.
4) It was found that damage becomes greater according as impact energy to the specimen increases in 1 J to 8 J and thinner the specimen thickness .
5) In the case of actual specimens to which 4 J or greater impact was applied, damage detection by the use of thermography showed that far greater damage exists than the size of indentation visible to the naked eye.
Acknowledgements
This study is a research project performed asa a part of the middle-grade researcher supporting program with the support of the National Research Foundation of Korea and the Ministry of Science, ICT and Future Planning (2015R1A2A2A01005426)
Reference
[1] M. Balaskó, E. Sváb, G. Molnár, and I. Veres, "Classification of defects in honeycomb composite structure of helicopter rotor blades," Nuclear Instruments and Methods in Physics Research Section A: Accelerators, Spectrometers, Detectors and Associated Equipment, Vol. 542(1), pp. 45-51 (2005) [2] D. Palumbo, F. Ancona and U. Galietti,
"Quantitative damage evaluation of composite materials with microwave thermographic technique: feasibility and new data analysis," Meccanica, Vol. 50(2), pp. 443-459 (2015) [3] R. Capriotti, E. Ddti, P. Silvestri and G.
Trivisonno "NDT Techniques for the Evaluation of Impact Damage on Aeronau- tical Structures," Proceedings of 15th World Conference on NDT, Roma, Italy (2000) Table 1 Comparison of surface indented defect and
infrared thermography defect size (2 mm) J defect size(mm) 1 4 8 Real size 4.41 6.64 12.76 (23.91) Halogen lamp 7.79 18.58 28.97 Xenon lamp 7.22 18.41 26.72
Table 2 Comparison of surface indented defect and infrared thermography defect size (3 mm, Halogen lamp) J defect size(mm) 4 8 Real size 8.08 13.50 (17.55) Halogen lamp 15.01 22.24 Xenon lamp 13.04 21.54
Procedia Structural Integrity, Vol. 1, pp. 50-57 (2016)
[5] C. Ibarra-Castanedo, F. Marcotte, M. Genest, L. Brault, V. Farley and X. P. V. Maldague, "Detection and characterization of water ingress in honeycomb structures by passive and active infrared thermography using a high resolution camera," 11th International Conference on Quantitative InfraRed Thermo- graphy, pp. 278-287 (2012)
[6] G. Busse, "Infrared and thermal testing: technique of infrared thermography," Non- destructive Testing Handbook Series III (3rd Ed), X. P. V. Maldague, P. O. Moore Ed., ASNT, Columbus, USA, pp. 318-328 (2001)
modulated thermpgraphy," J. Appl. Phys. Vol. 71, No. 8, pp. 3962-3965 (1992) [8] H. S. Park, M. Y. Choi, J. H. Park, W.
T. Kim and W. J. Choi, "Study on the qualitative defects detection in composites by optical infrared thermography," Journal of the Korean Society for Nondestructive Testing, Vol. 31, No. 2, pp. 150-156 (2011) [9] E. C. Guler, B. Sankur, E. Anarim, C. D.
Mendi, O. Alkin, Y. P. Kahya and T. Engin, "Wavelet transform based transient detection," Advances in Signal Processing for Nondestructive Evaluation of Materials, X. P. V. Maldague, Ed., Kluwer Academic Publishers, Dordrecht, Netherlands, pp. 269- 283 (1994)


![Fig. 8 presents thermography temperature images shown when exciting the light source of 6 kW instantaneously by using the xenon flash lamp [9]](https://thumb-ap.123doks.com/thumbv2/123dokinfo/4909748.40661/5.807.429.714.110.596/presents-thermography-temperature-images-shown-exciting-source-instantaneously.webp)