* Professor, School of Interdisciplinary Studies, Daegu University E-mail:[email protected], Tel:82-53-850-4594
※ Acknowledgment
This work was supported by the National Research Foundation of Korea(NRF) grant funded by the Korea government(MSIT) (No. 2019R1G1A1100771).
Manuscript received Feb. 10, 2021; revised Mar. 26, 2021; accepted Mar. 27, 2021.
This is an Open-Access article distributed under the terms of the Creative Commons Attribution Non-Commercial license (http://creativecommons.org/licenses/by-nc/3.0) which permits unrestricted non-commercial use, distribution, and reproduction in any medium, provided the original work is properly cited.
Personalized Specific Premature Contraction
Arrhythmia Classification Method Based on QRS
Features in Smart Healthcare Environments
Ik-Sung Cho
*★Abstract
Premature contraction arrhythmia is the most common disease among arrhythmia and it may cause serious situations such as ventricular fibrillation and ventricular tachycardia. Most of arrhythmia clasification methods have been developed with the primary objective of the high detection performance without taking into account the computational complexity. Also, personalized difference of ECG signal exist, performance degradation occurs because of carrying out diagnosis by general classification rule. Therefore it is necessary to design efficient method that classifies arrhythmia by analyzing the persons’s physical condition and decreases computational cost by accurately detecting minimal feature point based on only QRS features. We propose method for personalized specific classification of premature contraction arrhythmia based on QRS features in smart healthcare environments. For this purpose, we detected R wave through the preprocessing method and SOM and selected abnormal signal sets.. Also, we developed algorithm to classify premature contraction arrhythmia using QRS pattern, RR interval, threshold for amplitude of R wave. The performance of R wave detection, Premature ventricular contraction classification is evaluated by using of MIT-BIH arrhythmia database that included over 30 PVC(Premature Ventricular Contraction) and PAC(Premature Atrial Contraction). The achieved scores indicate the average of 98.24% in R wave detection and the rate of 97.31% in Premature ventricular contraction classification.
Key words:R Wave, RR Interval, PVC, PAC, QRS Pattern, Smart Healthcare
Ⅰ. Introduction
Smart healthcare technology enables healthcare that was previously available only in hospitals to be applied in everyday life, and is developing and expanding rapidly with the active spread of smart devices. In particular, devices and related contents designed for exercise management and the prevention of chronic diseases such as obesity, diabetes, and
heart diseases are currently being actively developed. Interpretation of the electrocardiography (ECG) signal generally includes the steps of acquiring biological signals from the human body, removing noise, and detecting and diagnosing the QRS complex. This interpretation is then used in diagnosing heart problems and various heart diseases. Among heart diseases, arrhythmia refers to an irregular heart rhythm or an abnormal heart
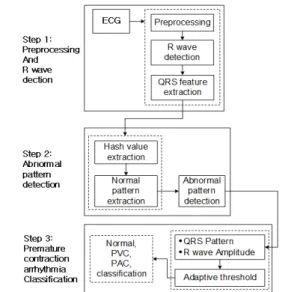
Fig. 1. System Flowchart.
rate. The types of arrhythmia range from mild rhythmic disorders that can occur in normal people to life-threatening and dangerous ones, which are caused by automaticity or conduction disorders of cardiac cells[1-3]. In particular, the occurrence of premature ventricular contraction (PVC)-the most common form of arrhythmia that can be found during clinical practice-in patients with a history of heart disease can lead to dangerous heart conditions such as ventricular tachycardia(VT), and premature atrial contraction(PAC) can lead to complications such as cerebral infarction or systemic embolism and increase morbidity and mortality rates[4-5]. Therefore, early detection of arrhythmia such as PVC and PAC is a crucial part of the preliminary investigation for the prevention and future occurrence of heart disease. The existing arrhythmia classification method considers the PP interval, the P wave morphological variability, and the assumption of there being several P waves within the QRS interval, but the diagnostic accuracy of this method is contingent on accurate P wave detection. Furthermore, it is difficult to guarantee generalizability because it classifies arrhythmia through the signal of the ECG itself, ignoring the signal differences that arise from individual characteristics[6-10]. To overcome this problem, there is a need for a method of classifying arrhythmia that considers the R wave, which can overcome noise and be easily detected after distinguishing abnormal signals due to individual differences, along with various QRS patterns. This study proposes a personalized premature contraction arrhythmia classification method based on QRS features in smart healthcare environments. To this end, the R wave was detected through preprocessing and the subtractive operation method (SOM), and abnormal patterns for each individual were detected. Afterwards, the type of premature contraction arrhythmia was classified according to the R wave amplitude variability and QS interval based on QRS features. The abnormal pattern detection and premature contraction
classification performance of the proposed method was evaluated based on the MIT-BIH database containing more than 30 PAC and PVC subjects, which showed excellent detection and classification rates of over 97% in analyzing both R wave and premature contraction arrhythmia.
Ⅱ. Proposed methods
The personalized premature contraction arrhythmia classification method based on QRS features in smart healthcare environments proposed in this study is divided into three steps as shown in Figure 1. The first step removes noise from the ECG signal and detects the R wave; the second step detects abnormal patterns by extracting the hash value and the normal pattern; and the third step classifies the QRS pattern and R wave amplitude based on the extracted R wave, both of which are put through an adaptive threshold for classification into Normal, PVC, and PAC categories.
1. Preprocessing and R wave detection
For accurate diagnosis, the R wave must be accurately detected by removing various noises included in the ECG signal. A morphological operation based preprocessing method was used in this study to reduce baseline wander and
minimize computational complexity.
The R wave is detected by using an empirical threshold on the preprocessed signal followed by the SOM, but in cases where this is insufficient, a backward searching technique using the RR interval is applied. When detecting the R wave, a false positive(FP) may occur when the P wave or the T wave is incorrectly labeled as the R wave, and a true negative(TN) may occur when the R wave is not detected despite being present. The backward searching technique was used to prevent such misdetections. After detecting the R wave, feature points must be extracted to detect abnormal patterns. In this study, RR and QRS intervals were used as variables for detecting abnormal patterns.
2. Personalized abnormal pattern detection The ECG signal is not uniform in shape because it is a bio-signal with a clear difference in waveform between individuals. Therefore, a hash value and normal signal pattern extraction method was used in this study to detect personalized abnormal patterns [10]. This method considers the ECG signal as a packet and determines the data to be normal if it matches a specific character string and abnormal otherwise. QRS interval data was used to detect abnormal patterns.
가. Hash value and normal pattern extraction In the hash value extraction step, the first hash value is calculated using the QRS interval data in the ECG signal, and the next hash value is extracted to compute the address value of the QRS interval between the boundary surfaces. The extracted value is then compared with the initial normal pattern and stored in memory if this range is satisfied. The stored value is compared with the later hash values to detect abnormal patterns. As heartbeats defined as a normal signal in the ECG is generally not identical to previous signals, the range of normal signals for this study was set as 92-116% of the
current signal. The initial normal pattern generates a unique reference value that is different for each individual and is stored in memory by calculating the hash value of the current RR interval and a QRS width of 150ms. In general, a hash function is a method used for authentication to ensure the integrity of a message. In this study, a linear feedback shift register (LFSR) was used to calculate a unique address value representing the normal pattern interval.
나. Abnormal pattern detection
Abnormal patterns were detected by extracting hash values and normal patterns. Patterns were confirmed using 10 MIT-BIH records for performance evaluation. One record with a normal signal and nine records containing multiple PVCs were analyzed. In the case of record number 100, a normal QRS interval is maintained and the RR interval is also within the normal range with low variability. Record numbers 105, 116, and 119 are cases which shows high-amplitude PVC and results in a wide QRS interval; the PVC section is characterized by a small RR interval with high variability. Changes in QRS and RR intervals in the remaining records that contain multiple PVCs showed similar characteristics. As seen through the signal shape of each record, the change in QRS and RR intervals of each record between normal and abnormal signals are clearly different and can be considered as suitable basis for abnormal pattern classification via hash value and normal pattern extractions.
3. QRS pattern classification
After detecting personalized abnormal patterns, it is possible to classify the signal into PVC and PAC.
In this study, the signals are classified as normal, PVC, and PAC using RR interval, R wave amplitude, and QRS pattern as variables for arrhythmia classification.
RR interval is sharply narrowed and its variability constantly increases compared to a normal signal. The arrhythmia classification process proposed in this study is divided into four steps, and the process of judging premature contraction arrhythmias is its first classification step. Premature contraction arrhythmia includes cases with an RR interval smaller than the total weighted average and an RR interval variability of greater than 1.2 in a sequence of continuous arrhythmic and normal signals.
After first classifying as premature contraction using the RR interval, the signal undergoes a second classification process to distinguish them into PVC and PAC. In general, when looking at premature contraction waveform patterns, the PVC waveform shows a lower negative value compared to the PAC waveform. If the analysis of PVC and PAC amplitude range for the MIT-BIH records resulted in an amplitude value of less than -1.3mv within the sampling range, the record was classified as PVC. However, for some PVCs that cannot be determined based on the R wave amplitude, they were classified using the R wave amplitude variability. Certain PVC patterns such as in record number 105, which is not classified as negative amplitude, are determined using the R wave amplitude variability. The amplitude variability of PVC was about twice that of normal, whereas the amplitude variability of PAC was similar to or 1.5 times that of normal. Amplitude variability was calculated using these characteristics as a template. The template is formed as a group of 25 R peaks, with 15 peaks before and 9 peaks after the current R peak. If the difference between the template and the current R wave amplitude is greater than 8%, it is determined as PVC and otherwise as PAC.
Ⅲ. Experimental Results and Discussion
Performances for R wave detection, abnormal pattern detection, and premature contraction
arrhythmia classification were evaluated using the MIT-BIH arrhythmia database.
Detection rate is calculated via Equation (1).
(1)
In the above equation, where TP is correctly classified normal beat, TN is classified correctly PVC beat, FP is misclassified normal beat, FN is misclassified PVC beat. R wave detection showed an excellent performance of 99.76%.
1. Abnormal pattern detection
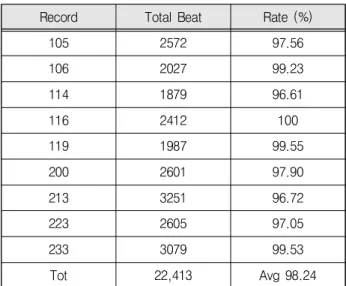
Table 1 shows the difference between actual and detected abnormal beats for each MIT-BIH record. The experiment was performed on 9 records(105, 106, 114, 116, 119, 200, 213, 223, and 233) all containing 30 or more PVCs for the reliability of classification. The detection rate of abnormal patterns was excellent in most records that contained abnormal beats such as PVC or PVC and PAC. However, the detection rate was slightly low for record number 233. this was confirmed to be an error based on beat variation due to the inclusion of multiple paced beats. As a result, the abnormal signal detection rate was 98.24% on average, indicating a good reliability for abnormal pattern detection.
Record Total Beat Rate (%)
105 2572 97.56 106 2027 99.23 114 1879 96.61 116 2412 100 119 1987 99.55 200 2601 97.90 213 3251 96.72 223 2605 97.05 233 3079 99.53 Tot 22,413 Avg 98.24
2. Comparison of arrhythmia classification performance
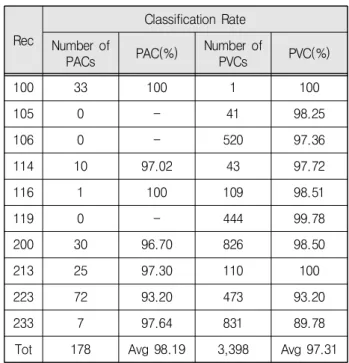
Table 2 shows the difference between actual and detected abnormal beats for each MIT-BIH record. The experiment was performed on 9 records(105, 106, 114, 116, 119, 200, 213, 223, and 233) all containing 30 or more PVCs for the reliability of classification. The proposed method showed excellent performance with final PAC and PVC classification rates of 98.19% and 97.31%, respectively.
The classification rate for PVC, which in particular has the greatest risk among the classified heart diseases, is shown in Table 3 in comparison with existing methods. Among these methods, the SVM method was excluded from comparison because the MIT-BIH records used for arrhythmia evaluation did not match. Furthermore, the proposed method resulted in a slightly lower detection rate than the Bayesian filtering method, but is much better in terms of classification simplicity, and obtained better results compared to the Gaussian method. Therefore, the proposed method showed good classification rates while reducing complexity.
To test the performance of the PVC and PAC classification algorithm, the same 9 MIT-BIH arrhythmia database records containing 30 or more PVC and PACs used to detect abnormal patterns were used. Table 1 shows the classification performance on the two premature contraction arrhythmia types, PAC and PVC. Evaluation results showed good performance for average classification rates of 98.19% and 97.31%, respectively. Especially in the case of record number 105, where its waveform could not be analyzed with pattern classification and thus was analyzed using an R wave threshold, it was confirmed that this resulted in an improved classification rate compared to classifying patterns solely based on negative peaks. However, record number 233 showed a large error with a classification rate of 89.78%, this can be attributed to the fact that its RR interval variability was not greater than normal despite
being a PVC, which resulted in incorrect classification as the algorithm determined the RR interval to be unproblematic. Rec Classification Rate Number of PACs PAC(%) Number of PVCs PVC(%) 100 33 100 1 100 105 0 - 41 98.25 106 0 - 520 97.36 114 10 97.02 43 97.72 116 1 100 109 98.51 119 0 - 444 99.78 200 30 96.70 826 98.50 213 25 97.30 110 100 223 72 93.20 473 93.20 233 7 97.64 831 89.78
Tot 178 Avg 98.19 3,398 Avg 97.31 Table 2. Premature Contraction Arrhythmia Classification
Rates.
Classification Method Research Avg(%) SVM Erik Zellmer [6] -Gaussian Melgani and Basi [9] 97.10 Bayesian Sayadi [10] 99.10
Proposed proposed 97.31
Table 3. Comparison of PVC Classification Rates.
Ⅳ. Conclusion
This study proposes a personalized premature contraction arrhythmia classification method based on QRS features in smart healthcare environments. To this end, the R wave was detected through preprocessing and the subtractive operation method (SOM), and abnormal patterns for each individual were detected. Afterwards, the type of premature contraction arrhythmia was classified according to the R wave amplitude variability and QS interval based on QRS features. R wave detection, abnormal pattern detection, and premature contraction
arrhythmia classification of the proposed method were evaluated on records of MIT-BIH database containing more than 30 PACs and PVCs to demonstrate its performance, which showed excellent detection and classification rates of over 97% in all categories.
The algorithm for arrhythmia classification proposed in this study can be applied as a decision-making support system for smart healthcare-based telemedicine requiring accurate diagnosis according to the presence or absence of the subject.
References
[1] G. Wang, J. Hu, C. Li, B. Guo & F. Li, “Simultaneous Human Health Monitoring and Time-Frequency Sparse Representation Using EEG and ECG Signals,” IEEE Access, Vol.7, pp.85985-85994, 2019.
DOI: 10.1109/ACCESS.2019.2921568
[2] W. Li, “Deep Intermediate Representation and In-Set Voting Scheme for Multiple-Beat Electro-cardiogram Classification,” IEEE Sensors Journal, vol.19, no.16, 6895-6904, 2019.
DOI: 10.1109/JSEN.2019.2910853
[3] E. Orosco et al, On the use of high-order cumulant and for muscular-activity detection, Biomedical Signal Processing and Control, vol.18, 325-333, 2015.
[4] Z. j Chen et al, “An Energy-Efficient ECG Processor With Weak-Strong Hybrid Classifier for Arrhythmia Detection,” IEEE Transactions on Circuits and Systems II: Express Briefs, vol.65, no.7, 948-952, 2017.
DOI: 10.1109/TCSII.2017.2747596
[5] Xue Xu, Sohyun Jeong, Jianqiang Li, “Interpretation of Electrocardiogram (ECG) Rhythm by Combined CNN and BiLSTM,” IEEE Access, vol.8, no.2, pp.2169-3536, 2020.
DOI: 10.1109/ACCESS.2020.3006707
[6] Erik Zellmer, Fei Shang, Hao Zhang “Highly Accurate ECG Beat Classfication based on Continuous Wavelet Transformation and Multiple Support
Vector Machine Classifiers,” Biomedical Engineering and Informatics Conference MMEI, pp.1-5, 2009. DOI: 10.1109/BMEI.2009.5305280
[7] Lujain Ibrahim, Munib Mesinovic, Kai-Wen Yang, Mohamad A. Eid, “Explainable Prediction of Acute Myocardial Infarction Using Machine Learning and Shapley Values,” IEEE Access, vol.8. no.2, pp.2169-3536, 2020.
DOI: 10.1109/ACCESS.2020.3040166
[8] Y.-L. Zheng et al., “Unobtrusive sensing and wearable devices for health informatics,” IEEE Transactions on Biomedical Engineering, vol.61, no.5, pp.1538-1554, 2017.
DOI: 10.1109/TBME.2014.2309951
[9] Melgani, F., Bazi, Y, “Detecting premature ventricular contractions in ECG signals with Gaussian processes,” Comput. Cardiol, vol.35, pp.237-240. 2008. DOI: 10.1109/CIC.2008.4749021
[10] Sayadi, O., Mohammad, B., Shamsollahi, G., Clifford, D, “Robust detection of premature ventricular contractions using a wave-based Bayesian framework,” IEEE Trans. Biomed. Eng, vol.57, no.2, pp.353-362. 2020. DOI: 10.1109/TBME.2009.2031243 [11] Faezipour. M. Saeed. A, Nourani. M, “Automated ECG profiling and beat classification,” Acoustics Speech and Signal Processing (ICASSP), 2010 IEEE International Conference, pp.2198-2201, 2010. DOI: 10.1109/ICASSP.2010.5495715
BIOGRAPHY
Ik-Sung Cho (Member)2004:MS degree in Electrical & Communication Engineering, Korea Maritime University.
2014:PhD degree in Bio Medical Engineering, Pusan University. 2018~present:Professor, School of Interdisciplinary Studies Daegu University.