Journal of Magnetics 22(2), 188-195 (2017) https://doi.org/10.4283/JMAG.2017.22.2.188
©2017 Journal of Magnetics
The Relation of Crystallite Size and Ni
2+Content to Ferromagnetic
Resonance Properties of Nano Nickel Ferrites
Sadeq H. Lafta*
Applied Science Department, University of Technology (UOT), Bagdad, Iraq
(Received 10 February 2017, Received in final form 29 April 2017, Accepted 2 May 2017)
The ferromagnetic resonance and other magnetic properties dependence on Ni2+/Fe3+ ratio and crystallite size were investigated for nano nickel ferrite (NiFe2O4). The crystallite size was controlled by controlling the nickel
content in the starting material solution. The XRD and TEM were utilized to measure the crystallite size through Scherrer formula and particle size respectively. The most frequent particle sizes were lower than crys-tallite size, which ranged from 16.5 to 44.65 nm. The general behavior of M-H loop shapes and parameters showed superparamagnetic one. The saturation magnetization had a maximum value at Ni2+/Fe3+ molar ratio equal to 0.186. The FMR signals showed, generally, broad linewidths, where the maximum width and mini-mum resonance field were for the sample of the lowest crystalline size. Furthermore, FMR resonance field shows linear dependence on crystalline size. The fitting relation was estimated to express this linear depen-dency on the base of behavior coincidence between particle size and the inverse of saturation magnetization. The given interpretations to understand the intercept and the slope meanings of the fitted relation were based on Larmor equation, and inhomogeneous in the anisotropy constant.
Keywords : ferromagnetic resonance, resonance field, crystallite size, Nano Ni-ferrite, FMR linewidth
1. Introduction
The chemical formula of Nickel ferrite, in general, is given by NiyFe3-yO4. In case of stoichiometric composition
(y = 1), the formula becomes NiFe2O4, i.e. Fe atomic
content is twice the Ni content [1]. Otherwise ( y < 1), the composition becomes nonstoichiometric. Ni ferrite is one of common magnetic ferrites owning an inverse spinel structure, where the Fe3+ ions at tetrahedral and octa-hedral sites whereas Ni2+ ions reside at octahedral sites. The magnetic properties of Ni ferrite are directly a function of nickel and iron contents and their distributions [2].
One of the important methods to evaluate and charac-terize bulk and nanoparticles magnetic material is the ferromagnetic resonance (FMR) technique. FMR mea-suerment depends on measuring the resonant field (Hres),
the linewidth (ΔHpp), and signal line shape [3-5]. Basically,
FMR analysis can give information about magnetization, anisotropy, relaxation times, and magnetization damping
process [6, 7]. These properties depend on material com-position, crystalline structure, particle (grain) size and shape, and defects, which are the main properties of nanoferrite. Nickel ferrite as one of spinel ferrites has large ΔHpp
due to the role of the orbital state of a relaxing ion Ni2+. For bulk material, ΔHpp reaches 1700G in case of in-plane
measurement [8-10].
FMR resonance field increasing for YIG had been reported when the particle size changed from micro to nanosize [11, 12] due to surface/volume contribution. The surface disorder producing Hres alteration due to the
arising extra internal field for nanoparticle was reported for different systems [13-16]. The particle size contri-bution to Hres due to surface disorder is anisotropic while
the magnetization process contribution to Hres shift is
isotropic.
TheHres decreasing is also produced by increasing the
internal field due to the interaction of nanoparticles that related to magnetic, defects, electrostatic, and other origins. On the other hand,the effect of cluster size on Hres was
also observed in literature [17]. The larger cluster size causes larger decreasing in surface effects, compared to monodisperse sample having the larger internal field [18]. Some researchers [19, 20] found that the increasing of the
©The Korean Magnetics Society. All rights reserved. *Corresponding author: Tel: +9647713282808
effective anisotropy constant is proportion nearly in linear mode with particle size decreasing. Recently, a study [21] mentioned that the relation between the nanoparticle size of Ni ferrite and the FMR properties with no empirical relationship.
Particle size and composition play an important role in controlling magnetization and FMR properties. Thus, this will determine the application in which the substance will be used, such as hyperthermia, magnetic resonance imagin-ing and microwave applications.
The first aim of this study is examination the magnetic and FMR properties of nano Ni ferrite where the studies are few and not dilated. The second aim is to find and explain an empirical relation between the nanoparticle size and the FMR resonance field of Ni ferrite nano-powder that has different Ni content. By then, one can evaluate and specify the best nanoparticles size of Ni ferrite to be functioned in a certain application. The study, in general, can give an idea about how ferromagnetic resonance depends on particle size for ferrites.
2. Experimental Part
Six different NiyFe3-yO4 compositions were prepared. The nickel to iron molar ratio (Ni2+/Fe3+) equals y/(3−y). The hydrothermal process was dependent as preparation technique. The chemicals NiCl2·6H2O and FeCl3 were used as the chemical agents. The overall solution that contains certain weights of metals chlorides dissolved in 200 ml distilled water. This was followed by adding 0.2 M NaOH to the solution until pH reaches 13. Hydroxide complexes are constructed at this step. The solution volumes during previous processes for all samples were kept constant and the concentrations of Ni2+ and Fe3+ were different. This was followed by transferring the solution to stainless autoclave heated to 150oC for 5 hours at autogenous pressure. The day after, the formed suspen-sion was washed and magnetically filtered several times. Finally, the samples were dried at 80oC.
Nickel content (thus the particle size), in each sample, was controlled by selecting a precise value of NiCl2·6H2O/ FeCl3 mixing weight ratio to satisfy certain Ni2+/Fe3+ molar ratio. The values of the ratios, as shown in Table 1, are chosen to be in the range from 0 to the stoichiometric one, which is (0.5). The compositions were checked by the atomic absorption spectroscopy (AAS) by using the device Varian SpectrAA. In this analysis, 30 mg of each sample was dissolved in the (35%)HCl:(65%)HNO3 of molar ratio 1:1, accompanying by heating at 60oC on hotplate. Then the solution is diluted with volume of 1 liter by distilled water.
The XRD analysis was performed by Expert Panalytical Diffractometer. The 10 mg of each sample was measured by Quantum Design MPMS XL SQUID to specify the M-H loop. The FMR device was BRUKER ESR E500 used in cavity mode around the resonance frequency of 9.7 GHz at 35 dB. Each sample was weighted at 0.3 mg and pressed in PVC capsule for FMR measurements.
The crystallite size (D) was calculated by using Scherrer formula [22, 23]:
D = 0.94 λ/β cosθ (1)
Where λ is x-ray wavelength, β is the FWHM of the diffracted line, θ is the Bragg angle. Transmission elec-tron microscope branded Philips CM 12 TEM was used to check the particle size, size distribution and particle shapes, as well as an EDX analysis was conducted for the sample S4 to compare with AAS results.
3. Results and Discussions
3.1. Reaction and Composition Analysis
The expected chemical equation for reaction between ferric chloride, nickel chloride and sodium hydroxide at the stoichiometric ratio can be indicated by Eq. (2):
2FeCl3 + NiCl2·6H2O + 8NaOH
→ NiFe2O4 + 10H2O + 8NaCl (2)
The crystallite growth of ferrite in the hydrothermal process depends on: solution pH, temperature, salts centrations, etc. [24, 25]. In this work, the reactants con-centration was adopted to play the role for controlling the crystal growth and subsequently the crystallite size. The reaction in Eq. (2) was utilized to calculate the required weight of starting materials ions for producing the ferrite for each composition. It was already expected that the reaction does not follow the ideal reaction in Eq. (2). So atomic absorption analyses were utilized to check the composition of the products. The results are shown in
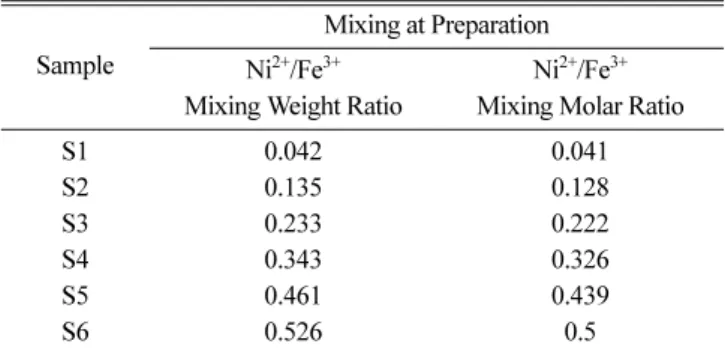
Table 1. The samples with their associated mixing Ni2+/Fe3+
weight and molar ratios.
Sample
Mixing at Preparation Ni2+/Fe3+
Mixing Weight Ratio
Ni2+/Fe3+ Mixing Molar Ratio
S1 0.042 0.041 S2 0.135 0.128 S3 0.233 0.222 S4 0.343 0.326 S5 0.461 0.439 S6 0.526 0.5
Table 2.
The sample S4 was additionally analyzed by the TEM-EDX technique for more accuracy confirming. The TEM-EDX spectrum with associated elements percent values is shown in Fig. 1. The Ni2+/Fe3+ ratio of the sample S4 from Fig. 1 is about 0.27 which is somewhat larger than that of AAS. This difference may be related to choosing a small selected area by the TEM-EDX technique, while the AAS involves huge dissolved particles. It is good to mention that the copper peaks of the spectrum are due to the copper mesh grid used for the TEM.
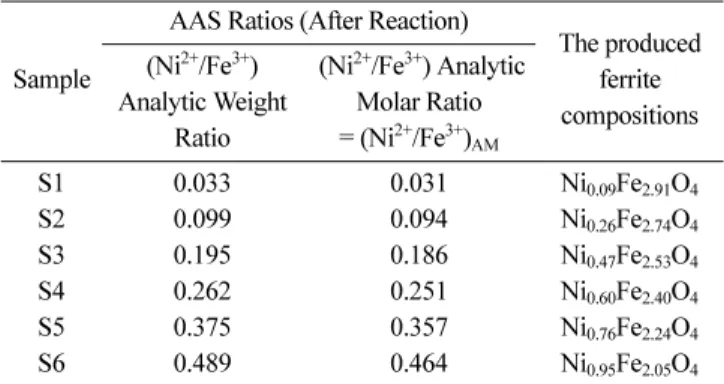
Going back to Table 1, There is a nearly linear dependence between Ni2+/Fe3+ mixing molar ratio and Ni2+/Fe3+ analytic molar ratio. The above ratios indicate that little loss in starting ions concentrations is increased as Ni2+/Fe3+ mixing molar ratio is increased. The Ni2+/Fe3+ analytic molar ratio will be dependent in later results because it represents the actual ratio and will be denoted by (Ni2+/ Fe3+)AM.
3.2. Crystalline Structure and Morphology
The XRD patterns for the various six samples of different
nickel contents (different (Ni2+/Fe3+)AM) are illustrated in Fig. 2. Generally, whole samples had a pure inverse spinel phase and no presence of strange phases due to repetition of magnetic filtering.
The estimated crystallite sizes (D) by Scherrer formula are given in Fig. 3. It is clear that D drops from 44.64 nm to 16.5 nm as the ratio increases from 0.031 to 0.186. This is more likely related to the excess of nucleation centers. In other words, more crystals number with smaller sizes is produced due to increasing nucleation rate on account of growth rate. In this case, the production of other phases instead of ferrite is absent [26]. The crystallite size is enhanced as the (Ni2+/Fe3+)AM is increased and exceeding 0.24 due to saturation of nucleation center. The saturation of nucleation rate induces a rising in growth rate, which makes crystallite size to be larger. Whenever
Table 2. The AAS (Atomic Absorption Spectroscopy) ratios results for the samples with produced ferrite compositions.
Sample
AAS Ratios (After Reaction)
The produced ferrite compositions (Ni2+/Fe3+) Analytic Weight Ratio
(Ni2+/Fe3+) Analytic Molar Ratio = (Ni2+/Fe3+)AM S1 0.033 0.031 Ni0.09Fe2.91O4 S2 0.099 0.094 Ni0.26Fe2.74O4 S3 0.195 0.186 Ni0.47Fe2.53O4 S4 0.262 0.251 Ni0.60Fe2.40O4 S5 0.375 0.357 Ni0.76Fe2.24O4 S6 0.489 0.464 Ni0.95Fe2.05O4
Fig. 1. (Color online) TEM-EDX spectrum of the sample S4 and associated elements in percent values.
Fig. 2. (Color online) The XRD patterns for the six Ni Ferrite samples (six (Ni2+/Fe3+)AM ratio).
Fig. 3. Crystallite size (D) vs. (Ni2+/Fe3+)
the ratio is going to the value 0.5, the stoichiometric one, the growth rate is going to be higher.
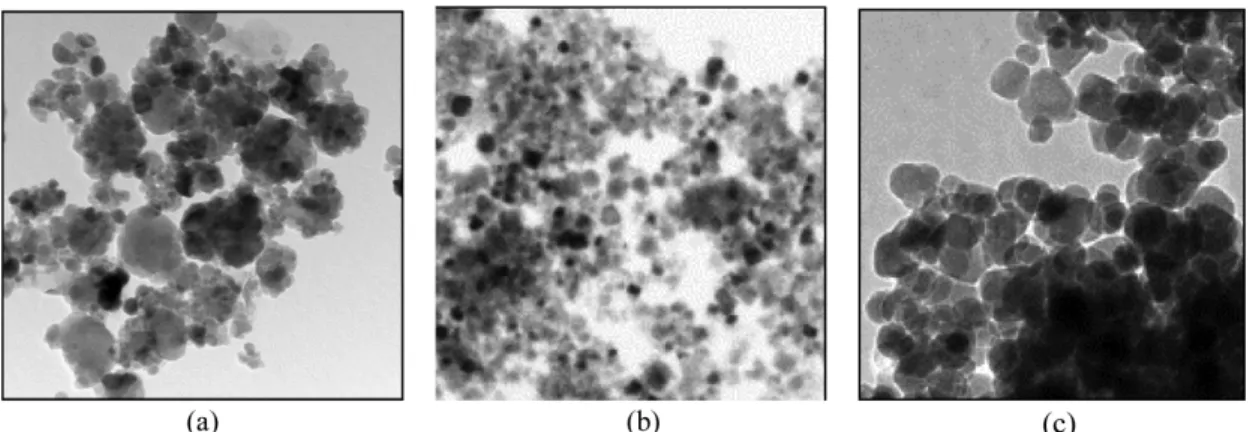
Most of all particles have a spherical shape as shown by TEM images for samples S1, S3 and S4 in Fig. 4. The size distributions obtained from TEM images in Fig. 5 exhibit that the particle sizes are around 35 nm for S1, 12.5 nm for S3, and 15 nm for S4 respectively. They are somewhat smaller than crystalline sizes (D). This ambi-guity is cleared up when one take into account the larger particles in particle distribution.
The distributions support the suggested supposition about the growth mechanism. The accompaying of lowest particle size and lowest distribution with high particle density mean high nucleation rate existaence as seen in Fig. 5.
3.3. Magnetic and FMR Charactrestics
The M-H loops of the prepared samples are shown in Fig. 6. The saturation magnetization of the samples are given in Table 3 with their corresponding (Ni2+/Fe3+)AM ratios. Loops generally shows soft behavior with un-saturated curves for all samples due to superparamagnetic effect of the fraction of small particles. The particle distribution in Fig. 5 and low Hc values (< 28 Oe) of the
samples support this view. For that reason, the moment at field value 45000 Oe is considered as saturation Ms
magnetization value for comparison among samples. The sample S3, who has (Ni2+/Fe3+)AM = 0.186, owns the maximum Ms value, which is 128.41 emu/g. The deviation
from this ratio leads to high drop in Ms value. There is no
doubt, the main role in modifying Ms in this case is the Ni
content.
Fig. 4. TEM images. (a) Sample S1; image dimension: 348 × 348 nm and, (b) Sample S3; image dimension: 418 × 418 nm, (b) Sample S4; image dimension: 210 × 210 nm.
Fig. 5. Particle size distribution for samples (a) S1, (b) S3, (c) S4.
While the (Ni2+/Fe3+)AM was varied from 0.031 to 0.186, Ni2+ cations occupied the tetrahedral sites. In this case, the Fe3+ cations at octahedral sites is the predominant and the net moment is on their side and so Ms is enhanced.
When (Ni2+/Fe3+)AM exceeded the 0.186, the Ni2+ cations stay at octahedral sites. This action leads the net moment to be equalized by the two sublattices and Ms to be
reduced. The previous works [27-32] showed increasing in Ms as D increases. The compositions in their samples
were still unchanged, which is opposite the result of this study. The interpretation of these results depended on surface area affected by noncollinear surface spins decreasing or exchange interactions between tetrahedral and octahedral sub-lattices. These previous results are in agreement with the relationship [33, 34]:
Msn = Msb[1 − (β/D)] (3)
Where Msn, Msb are the saturation magnetization of nano
and bulk materials respectively, and β is a constant. In our case, Ms is affected by the dual Ni content and particle
(crystallite) size D. but still the influence of Ni content and cation distribution is the predominant factor in deter-mining Ms compared to surface disorder that resulted from
particle size variation. Due to the coincidence between the 1/Ms and the particle size, it could be to make the
particle size D as an indicator for Ms.
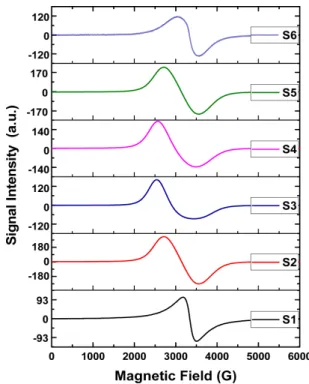
The FMR signals vs field intensity for the six samples are shown in Fig. 7. All signals are marked by broad fashion with a minimum linewidth of 250G for the sample S1. The linewidths for the rest samples are around 900G with 50G tollerance, as shown in Table 4. The reason behind ΔHpp increasing from S1 to S2 is related to the
inhomogeneity of samples resulted from moderate samples mosaicity, randomly oriented crystallites, and damping due to surface effects and particles interaction. Besides that, the more Ni2+ ions means more magnon-phonon relaxiation events due to have degenerated orbital ground stateof this ion. The evidence for that is that broadening accompanied with resonance field degradation at low (Ni2+/Fe3+)AM valuesas it will be seen later.
The variation of FMR resonance field (Hres) with (Ni2+/
Fe3+)AM is shown in Fig. 8. To understand the behavior in Fig. 8, one must recall the FMR relationships and
contri-Table 3. Saturation magnetization (Ms) of the prepared sam-ples with their corresponding (Ni2+/Fe3+)AM ratios.
Sample (Ni2+/Fe3+)AM ratio Ms (emu/g)
S1 0.031 25.94 S2 0.094 59.29 S3 0.186 128.41 S4 0.251 65.76 S5 0.357 45.97 S6 0.464 11.67
Fig. 7. (Color online) FMR signals from the six Ni ferrite samples with different crystalline size.
Table 4. FMR linewidth of Ni ferrite sample. Sample FMR Linewidth ΔHpp (G) S1 325 S2 840 S3 897 S4 890 S5 832 S6 505
Fig. 8. Resonance field at different (Ni2+/Fe3+) AM.
butions of fields in Hres. When the moment (or
magneti-zation) (M) rotates around the static field (H) as a result of the torque (H x M), the angular Larmor frequency ω is given by [35-37]:
ω = γ Hres (4)
where γ is the gyromagnetic ratio (γ = 28 GHz per T−1), H is the magnetic field in Tesla. Otherwise, the frequency (f) of the last equation in GHz can be written in a more practical form as f = 35.2 × 10⁶ × H. In fact, Hres is the
outcome of several contributions connected to the magnetic speciemen conditions. These contributions can be given by [38, 39]:
Hres = Hexp + Ha + Hp + He + Hid + Hdis (5)
where the subscripts stand for the following: exp: experi-mental; a: Anisotropy; p: porosity; e: eddy current; id: inhomogeneous demagnetization; dis: cations distribution. The last term is associated with ferrites, which was dis-cussed by Raul Valenzuela [40]. It is produced by cation distributions and represents another source of inhomo-geneity (inhomoinhomo-geneity in cations surrounding).
The sum of these fields in Eq. (5) without Hexp is called
internal field (Hint). In case of nanoferrite, Hint is affected
by temperature, particle size and magnetization. It was reported that when the temperature is minimized the Hres
is reduced due to the building up of the internal field which is mainly produced by exchange and anisotropy [14]. For the case of this research, the terms Hp, He and
the term Hdis is meaningless and can be neglected due to
the subsequent respective reasons: (i) low particle size comparing with pore size, (ii) ferrite high resistivity and (iii) all cations have preferred occupation sites up to (Ni2+/Fe3+)AM = 0.186. Besides that, the prepared particles are generally spherical, so no contribution of the de-magnetization field, while the shape anisotropy of the spherical particles is zero [41, 42].
It is believed that the Ha field is responsible for Hres
behavior in Fig. 8 through the impact of the magneti-zation saturation Ms and the anisotropy constant K, as in
Eq. (6) [43]:
(6)
Where (4K/Ms) is the anisotropy field (Ha). The
aniso-tropy constant depends on temperature, composition, particle size and crystal structure parameters such as, lattice parameter, bond lengths, bond angles, etc [44]. From Eq. (6) one can give a reasonable explanation for Fig. 8 by comparing Fig. 8 with Table 3. The maximum
Ms value in Table 3 is 128.41 emu/g, which corresponds
the (Ni2+/Fe3+)AM value of 0.186. On the other hand, the
minimum Hres is related to (Ni2+/Fe3+)AM = 0.251, but not
to (Ni2+/Fe3+)AM = 0.186. So due to the lower influence of the anisotropy constant K, it is believed that it has no noticeable effect on Hres at different (Ni2+/Fe3+)AM values
compared to Ms.
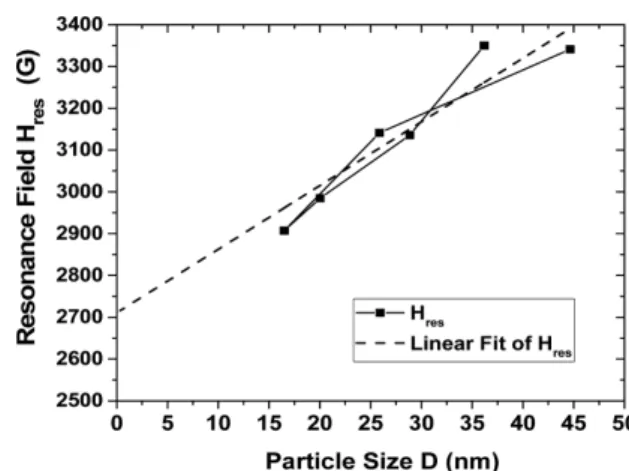
One can note that the general behavior of Hres vs (Ni2+/
Fe3+)AM in Fig. 8 has nearly the same behavior of crystallite size (D) vs (Ni2+/Fe3+)AM ratioin Fig. 3. That can gives a conclusion about the linearity between the resonance field and crystallite size, which is illustrated in Fig. 9. The dashed line in this figure represents the fitting line of Hres versus D as drawn by using OriginLap version
2015 software. The mathematical form of this behavior is expressed empirically by Eq. (7):
Hres (in Gauss) = 2710.03 + 15.24D (D in nm) (7)
It is important to deduce the meanings of the Eq. (7) constants, which are the intersection (2710.03 G) and the slope (15.24 G/nm). By going back to Eq. (4), if one tries the frequency 9.7 GHz and uses Gauss unit instead of Tesla, the produced field will be 2740 G which is nearly equal to the intercept value given by Eq. (7). In this case, the percentage error is less than 1.1 %. This conclusion is supported by the signal shape and linewidth of the sample S1 in Fig. 5. On the other hand, it is believed that the slope (15.24 G/nm) depends on the crystalline anisotropy constant and magnetization saturation as compared to Eq. (6) and basing on the previous coincidence between 1/Ms
and D. An exponential dependence of Hres on D was
reported formerly [19] with no given explanation and no empirical equation. In general, (Ni2+/Fe3+)AM = 0.186 pro-duces the lowest size, the highest magnetization and the lowest resonance field.
Hres = ω---- + γ 4K Ms
4. Conclusions
The particle size and nickel content control magnetic properties. There is a linear variation of the resonance field with crystallite size. The linear behavior may tell how nano Ni ferrite crystal size suitable for certain bio-medical application and microwave device. It is also can be used to determine the crystallite size, anisotropy con-stant and the internal field, which are significant magnetic parameters. With the help of the preparation can be used to measure for many magnetic materials.
Acknowledgement
The author would like to express his thanks to AG-Farle in Duisburg-Essen especially Prof. Dr. M. AG-Farle for his permission and scientific support and to Dr. R. Salikhov to his technical support and help for performing the FMR tests.
References
[1] D. Carta, M. F. Casula, A. Falqui, D. Loche, G. Mount-joy, C. Sangregorio, and A. Corrias, J. Phys. Chem. C 113, 8606 (2009).
[2] M. Han, Ch. R. Vestal, and Z. J. Zhang, J. Phys. Chem. B 108, 583 (2004).
[3] H. Montiel, G. Alvarez, I. Betancourt, R. Zamorano, and R. Valenzuela, Physica B 384, 297 (2006).
[4] G. Alvarez, H. Montiel, D. Cos, A. García-Arribas, R. Zamorano, J. M. Barandiarán, and R. Valenzuela, J. Non-Cryst. Solids 354, 5195 (2008).
[5] G. Alvarez, H. Montiel, J. F. Barron, M. P. Gutierrez, and R. Zamorano, J. Magn. Magn. Mater. 322, 348 (2010). [6] J. M. D. Coey, Magentism and Magnetic Material,
Cam-bridge University press, New York (2010).
[7] H. Yang, Y. Li, M. Zeng, W. Cao, E. B. William, and Y. Ronghai, Sci. Rep. 6, 20427 (2016).
[8] N. Pachauri, PhD Dissertation Alabama University, Ala-bama (2014).
[9] R. Valenzuela, Novel Applications of Ferrites, Phys. Res. Int. ID 591839 (2012).
[10] J. L. Xie, M. Han, L. Chen, R. Kuang, and L. Deng, J. Magn. Magn. Mater. 314, 37 (2007).
[11] C. Y. Tsay, C. Y. Liu, K. S. Liu, I. N. Lin, L. J. Hu, and T.-S. Yeh, J. Magn. Magn. Mater. 239, 490 (2002). [12] R. D. Sánchez, C. A. Ramos, J. Rivas, P. Vaqueiro, and
M. A. López-Quintela, Physica B 354, 104 (2004). [13] V. G. Harris, IEEE Trans. Magn. 48, 1075 (2012). [14] F. Gazeau, J. C. Bacri, F. Gendron, R. Perzynski, Y. L.
Raikher, V. I. Stepanov, and E. Dubois, J. Magn. Magn. Mater. 186, 175 (1998).
[15] M. Noginov, N. Noginova, O. Amponsah, R. Bah, R.
Rakhimov, and V. A. Atsarkin, J. Magn. Magn. Mater. 320, 2228 (2008).
[16] F. Gazeau, J. C. Bacri, F. Gendron, R. Perzynski, Y. L. Raikher, V. I. Stepanov, and E. Dubois, J. Magn. Magn. Mater. 202, 535 (1999).
[17] R. Valenzuela, F. Herbst, and S. Ammar, J. Magn. Magn. Mater. 324, 3398 (2012).
[18] I. Edelman, E. Petrakovskaja, D. Petrov, S. Zharkov, R. Khaibullin, V. Nuzhdin, and A. Stepanov, Appl. Magn. Res. 40, 363 (2011).
[19] A. F. Lehlooha, S. H. Mahmooda, and J. M. Williamsb, Physica B 321, 159 (2002).
[20] S. Oyarzún, A. Tamion, F. Tournus, V. Dupuis, and M. Hillenkamp, Sci. Rep. 5, 14749 (2015).
[21] X. Lasheras, M. Insausti, I. Gil de Muro, E. Garaio, F. Plazaola, M. Moros, L. De Matteis, J. M. de la Fuente, and L. Lezama, J. Phys. Chem. C 120, 3492 (2012). [22] A. Monshi, M. R. Foroughi, and M. R. Monshi, W. J.
Nano Sci. Eng. 2, 154 (2012).
[23] A. Patterson, Phys. Rev. 56, 978 (1939).
[24] H. Wang, J. Xie, K. Yan, and M. Duan, J. Mater. Sci. Technol. 27, 153 (2011).
[25] S. Laurent, D. Forge, M. Port, A. Roch, C. Robic, L. Vander Elst, and R. N. Muller, Chem. Rev. 108, 2064 (2008).
[26] Emad K. Al-Shakarchi, Sadeq H. Lafta, Ali M. Musa, M. Farle, and R. Salikhov, J. Supercond. Novel Magn. 29, 923 (2016).
[27] M. A. Dar, J. Shah, W. A. Siddiqui, and R. K. Kotnala, Appl. Nanosci. 4, 675 (2014).
[28] Ka. Nejati and R. Zabihi, Chem. Cent. J. 6, 23 (2012). [29] I. Zalite, G. Heidemane, M. Kodols, J. Grabis, and M.
Maiorov, Mat. Sci. (MEDŽIAGOTYRA) 18, 1392 (2012). [30] M. Zhang, Z. Zhenfa, Q. Liu, P. Zhang, X. Tang, J. Yang, X. Zhu, Y. Sun, and J. Dai, Adv. Mater. Sci. Eng. 2013, 1155 (2013).
[31] M. Lakshmi, K. V. Kumar, and K. Thyagarajan, Adv. Nanopart. 5, 103 (2016).
[32] B. S. Yoo, Y. G. Chae, Y. M. Kwon, D. H. Kim, B. W. Lee, and C. Liu, J. Magn. 18, 230 (2013).
[33] X. He, W. Zhong, C. T. Au, and Y. D. He, Nanoscale Res. Lett. 8, 446 (2013).
[34] R. D. Sanchez, J. Rivas, P. Vaqueiro, M. A. Lopez-Quin-tela, and D. Caeirob, J. Magn. Magn. Mater. 247, 92 (2002).
[35] M. Pardavi and Horvath, J. Magn. Magn. Mater. 215-216, 171 (2001).
[36] F. X. Qin and H. X. Peng, Prog. Mater. Sci. 58, 183 (2013).
[37] A. H. Morrish, The Physical Principles of Magnetism, John Wiley & Sons, New York (1965).
[38] E. Schlomann, J. Phys. Chem. Solids 6, 257 (1958). [39] R. Biasi and T. Devezas, J. Appl. Phys. 49, 2466 (1978). [40] R. Valenzuela, Electromagnetic Waves Capter 18, ISBN 978-953-307-304-0, InTech (2011), DOI:10.5772/16508.
[41] H. Song, S. Mulley, N. Coussens, P. Dhagat, A. Jander, and A. Yokochi, J. Appl. Phys. 111, 07E348 (2012). [42] J. V. I. Timonen, R. H. A. Ras, O. Ikkala, M. Oksanen, E.
Seppala, K. Chalapat, J. Li, and G. S. Paraoanu, Trends in nanophysics: Theory, experiment, technology (Engineer-ing Materials Series), Spr(Engineer-inger-Verlag, Berlin (2010) pp.
257-285.
[43] C. J. Oates, F. Y. Ogrin, S. L. Lee, P. C. Riedi, and G. M. Smith, and T. Thomson, J. Appl. Phys. 91, 1417 (2002). [44] L. Kumar and M. Kar, J. Magn. Magn. Mater. 323, 2042