저작자표시-비영리-변경금지 2.0 대한민국 이용자는 아래의 조건을 따르는 경우에 한하여 자유롭게 l 이 저작물을 복제, 배포, 전송, 전시, 공연 및 방송할 수 있습니다. 다음과 같은 조건을 따라야 합니다: l 귀하는, 이 저작물의 재이용이나 배포의 경우, 이 저작물에 적용된 이용허락조건 을 명확하게 나타내어야 합니다. l 저작권자로부터 별도의 허가를 받으면 이러한 조건들은 적용되지 않습니다. 저작권법에 따른 이용자의 권리는 위의 내용에 의하여 영향을 받지 않습니다. 이것은 이용허락규약(Legal Code)을 이해하기 쉽게 요약한 것입니다. Disclaimer 저작자표시. 귀하는 원저작자를 표시하여야 합니다. 비영리. 귀하는 이 저작물을 영리 목적으로 이용할 수 없습니다. 변경금지. 귀하는 이 저작물을 개작, 변형 또는 가공할 수 없습니다.
High-Density SNP Linkage Map
Construction and QTL Analysis of
Firmness in Octoploid Strawberry
(Fragaria × ananassa)
[W사1]JUN-GEOL YEUM
DEPARTMENT OF PLANT SCIENCE
THE GRADUATE SCHOOL OF SEOUL NATIONAL UNIVERSITY
ABSRACT
The allo-octoploid cultivated strawberry (Fragaria x anananssa Duchesne) has been produced around the world because of its pleasant flavor and health benefitting properties. There have been many obstacles in molecular breeding of strawberry due to the extremely complex nature of its genome composed of four relatively similar sub-genomic chromosome set. However, with recent advances in sequencing and scaffolding technology, chromosome-scale octoploid genome information is now available. In addition, with the development of various molecular markers, it is possible to construct high-density linkage maps that can be useful for molecular breeding. In this study, we constructed a high-density bin map using IStraw90
Axiom® SNP array and genotyping-by-sequencing (GBS)-based markers, and an F2 populations derived from inbred lines. As a result, a high-density linkage bin map of 3,974.6 cM in length was constructed, consisting of 1,245 bins and 33 linkage groups, covering 87.7% of the total physical length of the octoploid genome. This high-density linkage map was used to improve the quality of the octoploid reference genome, ‘Camarosa’. The chromosomes 1-2, 2-1, 6-2, and 6-4 of ‘Camarosa’, which has scaffolding errors in large scale, were reassembled based on the linkage map constructed in this study. Furthermore, this high-density linkage map was used to analyze QTL for firmness, one of the traits that is important for the quality of strawberry fruits. Among the nine QTL for firmness detected in ‘L80’ linkage bin map, QTL ‘qFaFL7’ containing the firmness-related genes on chromosome 6-3b was the major QTL explaining 26% of phenotypic value with LOD value of 6. On the other hand, in the ‘T137’ linkage bin map, five QTL were detected, but the LOD and phenotypic value was too low to be considered major QTL. In[o2][o3] summary, the high-density linkage maps, ‘L80’ constructed in this study will be a framework for molecular breeding of agriculturally important traits in strawberry.
Keywords: Allo-octoploid strawberry, IStraw90 Axiom SNP array,
genotyping-by-sequencing (GBS), reference genome, high-density linkage map, fruit firmness
CONTENTS
ABSTRACT ...i
CONTENTS ...iii
LIST OF TABLES ...v
LIST OF FIGURES ...vi
LIST OF ABBREVIATIONS ...vii
INTRODUCTION ...1
MATERIALS AND METHODS ...6
Plant materials, DNA extraction and reference genome ...6
GBS library preparation and sequencing ...7
Sequencing data processing and SNP calling ...7
GBS SNP dataset filtering and genotyping ...8
Axiom marker dataset filtering and genotyping ...8
Bin map and SNP linkage map construction ...9
Comparison of linkage map to physical map ...10
Scaffolds reassembly in ‘Camarosa’ reference genome ...10
Measurement of firmness ...11
QTL analysis ...11
RESULTS ...12
Bin map construction ...14
SNP linkage map construction ...17
Relationship between linkage map and physical map ...20
Scaffolds reassembly ...25
QTL analysis for firmness in ripe fruit and identify of association with firmness-related genes ...27
DISCUSSION ...34
REFERENCES ...39
ABSTRACT IN KOREAN ...47
LIST OF TABLES
Table 1. Summary of GBS-based SNP marker sets ...13 Table 2. Number of markers in six classes for Axiom IStraw90 genotyping array ...13 Table 3. The total number of SNPs and bin markers mapped to the ‘L80’ linkage map ...15 Table 4. The total number of SNPs and bin markers mapped to the ‘T137’ linkage
map ...16 Table 5. Summary of QTL for firmness in ‘L80’ population ...29 Table 6. Summary of QTL for firmness in ‘T137’ population ...30 Table 7. Comparison of bin markers most closely linked to firmness QTL and genes
in ‘L80’ population ...32 Table 8. Comparison of bin markers most closely linked to firmness QTL and genes
LIST OF FIGURES
Figure 1. Construction of ‘L80’ SNP linkage bin map ...18 Figure 2. Construction of ‘T137’ SNP linkage bin map ...19 Figure 3. Comparison of the two linkage bin maps with ‘Wongyo’ reference
genome ...21 Figure 4. Four chromosome reassembly of ‘Camarosa’ reference genome ...26 Figure 5. Positions of two major QTL for firmness in ‘L80’ population ...31
LIST OF ABBREVIATIONS
GBS
Genotyping-by-sequencing
SNP
Single nucleotide polymorphism
cM
Centi Morgan (the unit of genetic distance)
LOD
Logarithm of the odds
CTAB
Cetyl trimethy lammonium bromide
BWA
Burrow wheelers alignment
SAM
Sequence alignment/map
GATK
GenomeAnalysisTK
LG
Linkage group
QTL
Quantitative trait loci
SMRT
Single-molecule real-time
RAPD
Random amplified polymorphic DNA
AFLP
Amplified fragment length polymorphisms
SSR
Simple sequence repeat
DArT
Diversity arrays technology
AF
Allele frequency
INTRODUCTION
Strawberries belong to the genus Fragaria L. in the family Rosaceae,
subfamily Rosoideae (Potter et al., 2007). The genus Fragaria has a basic
chromosome number of seven (x=7) (Ichijima, 1926). There are various
Fragaria species with different ploidy levels, ranging from diploid to
decaploid (Ahmadi et al. 1992; Hummer et al. 2009). The cultivated
strawberries (F. x anananssa Duchesne) are octoploid (2n = 8x = 56), which
originated from a cross between a few clones of South American F. chiloensis
(L.) Miller and North American F. virginiana (L.) Miller about 250 years ago
(Darrow, 1966). Because of its pleasant flavor, nutrient factors and health
benefitting properties, strawberry has a large economic and commercial
values (Giampieri et al., 2014) which are evidenced by the continuous
increase of the strawberry production (http://faostat.fao.org/site/567/).
There have been many obstacles in molecular breeding of strawberry due
to the extremely complex nature of its genome, which also leads to difficulty
in assembly of octoploid strawberry genome (Folta and Davis, 2006;
Hirakawa et al., 2014; Koskela et al., 2016).
Strawberry is an allopolyploid
composed of four different diploid genomes
. The allopolyploidy nature of
when assemble the strawberry genome (Ming and Wai, 2015). For this reason,
diploid F. vesca and incomplete octoploid F.
xananassa reference genome
have been the basis of genetic studies in octoploid strawberry (Shulaev et al.,
2011; Tennessen, 2014; Bassil et al., 2015; Davik et al., 2015; Edger et al.,
2017). However, recent long-read sequencing methods including
single-molecule real-time (SMRT) and Nanopore sequencing enabled construction
of the chromosome-scale reference genome of the octoploid F. ananassa. The
chromosome-scale reference genome covers approximately 99% of the
estimated genome size. These reference genome provide an unprecedented
opportunities for molecular breeding in strawberry (Edgar et al., 2019b).
Molecular markers and linkage maps are essential for plant molecular
breeding and genetic studies. Various molecular markers have been developed
during last several decades including random amplified polymorphic DNA
(RAPD), amplified fragment length polymorphisms (AFLP), simple
sequence repeat (SSR), diversity arrays technology (DArT), Affymetrix
IStraw90 Axiom array, and genotyping-by-sequencing (GBS) in strawberry
(Gidoni et al., 1994; Congiu et al., 2000; Degani et al., 2001;
Lerceteau-Köhler et al., 2003; Davis et al., 2006; Sánchez-Sevilla et al., 2015; Bassil et
al., 2015; Vining et al., 2017). As the markers have been gradually developed,
there have been many studies aimed to construct linkage maps in octoploid
strawberry. The first genetic linkage map of F. × ananassa was constructed
using amplified fragment length polymorphism (AFLP) markers. These
genetic linkage maps with total linkage distances of 1,604 cM and 1,496cM
was constructed using 235 and 280 amplified fragment length polymorphism
(AFLP) markers, for female and male maps, respectively (Lerceteau-Köhler
et al., 2003). Isobe et al., (2013) reported a linkage map consisting of simple
sequence repeat (SSR) with a total linkage distance of 2364.1 cM (Isobe et
al., 2013). The Affymetrix IStraw90 Axiom array was the first
high-throughput genotyping platform for octoploid strawberry (Bassil et al., 2015).
A linkage map spanning 1,820 cM was constructed with the 8,407 SNP
markers of Axiom® IStraw90 array (Sargent et al., 2016). In case of
Affymetrix IStraw90 Axiom array, it is a highly simple, convenient and
cost-effective method compared to other genotyping technologies. In 2017, the
first linkage maps of three octoploid strawberry was constructed using
genotyping-by-sequencing (GBS). The linkage groups covered 99% of the F.
vesca reference genome (Vining et al., 2017).
The firmness of strawberry is one of the main factors influencing the
consumers’ acceptance (Døving and Måge, 2002). It is evidenced that the
higher the firmness assures the higher the storage capacity and the better
quality of the fruit (Liu, 2016). Furthermore, fruit with low firmness have the
disadvantage of increased pathogen susceptibility (Dotto et al., 2006).
Therefore, fruit firmness has been an important target in strawberry breeding
programs (Darrow, 1966; Barritt, 1979; Scheerens and Brennemaan, 1991;
Khanizadeh et al., 2000; Giampieri et al., 2014; [o4]Hancock et al., 2016;
Mora et al., 2019). Fruit firmness is controlled by many factors such as cuticle
properties, cell wall structure and turgor (Chaib et al., 2007; Saladie et al.,
2007). Therefore, firmness is a very complex and polygenic trait (Brummell
and Harpster, 2001). To date, there has been studied on QTL analysis targeting
firmness in various fleshy fruits such apple, melon, peach and sweet cherry
as well as tomato which is considered a model plant for fleshy fruits (Kenis
et al., 2008; Moreno et al., 2008; Cao et al., 2012; Chapman et al., 2012; Balas
et al., 2017). Similarly, QTL analysis targeting firmness have been studied in
strawberry (Dotto et al., 2006; Zorrilla-Fontanesi et al., 2011;
Lerceteau-Köhler et al., 2012; Antanaviciute, 2016; Pott et al., 2018). [W사5] Until
now, several QTL regions for firmness have been detected. Among them,
according to the most detailed study of firmness as the target trait, eight QTL
regions were detected on chromosome 1, 2, 3, 4 and 7 based on SSR-based
linkage map. Also, in the Axiom array-based linkage map, by comparing the
physical position of markers detected in QTL regions with the expansin
position known to affect strawberry fruit firmness, three markers that are
thought to be closely related to firmness were finally selected. However, this
result is based on physical position of diploid reference genome, therefore
further study based on the new octoploid reference genome is required.
In this study, we constructed a high-density linkage map for the F₂
mapping population which shows differences in firmness using the IStraw90
Axiom® SNP array and GBS markers for identification of
subgenome-specific loci. This method can substitute the disadvantage that the whole
genome resequencing is expensive, and has the advantages that the density
and coverage of the mapping population is excellent as in whole genome
resequencing. Firstly, we identified and corrected the scaffolding error of the
octoploid ‘Camarosa’ reference genome using this high-density linkage map
(domesticated type) and two previously published linkage map (wild types).
Secondly, using our ‘L80’ linkage bin map, a significant QTL region with an
LOD value of 6 and associated with the expansin genes affecting the firmness
of strawberry fruit was identified in Chromosome 6-3b. Therefore, the
construction of the domesticated type high-density linkage map will be
beneficial to further researches not only in genomic studies but also in
molecular breeding.
MATERIALS AND METHODS
[W사6]Plant materials, DNA extraction and reference genome
Inbred lines (‘Bennihoppe 8-10’, ‘Sachinoka KJ12 12’, ‘Bennihoppe 8-9’, and ‘Chandler KJ13 13’) derived from the relatively high firmness variety F. × ananassa ‘Bennihoppe’ and two low firmness varieties F. × ananassa ‘Sachinoka’ and ‘Chandler’ were used as parental lines (Rho et al., 2012). [o7] Two F₂ mapping populations ‘L80’ and ‘T137’ were used for linkage map construction. ‘L80’ was derived from a cross between ‘Bennihoppe 8-10’ and ‘Sachinoka KJ12 12’ and ‘T137’ is a cross between ‘Bennihoppe 8-9’ and ‘Chandler KJ13 13’. Total genomic DNA was extracted from young leaves of 149 F2 plants and their parental lines (‘L80’)
and those of 147 F2 plants and their parental lines (‘T137’) using modified
cetytrimethylammonium bromide (CTAB) method (Doyle and Doyle, 1987). Two octoploid strawberry reference genomes were used in this study. One is a reference genome named ‘Wongyo (unpublished)’, which is a highly homozygous inbred line and a high-quality reference genome covering a total of 804 Mb. The other is ‘Camarosa’, which is the first completed octoploid strawberry reference genome representing ~99% of the estimated genome size (Edgar et al., 2019b).
GBS library preparation and sequencing
The GBS libraries were constructed for the ‘L80’ ‘T137’ populations and their parental lines. DNA concentrations were diluted to 80 ng/㎕ for library preparation. Genomic DNA was double digested with the restriction enzymes EcoRI and MseI as previously described by Han et al., (2018). The adapters of two restriction enzymes were ligated to both enzyme cut-sites of digested gDNA with different barcodes for each sample. After amplification and quality control, the library were sequenced using Hiseq 4000 at Macrogen (Seoul, Republic of Korea).
Sequencing data processing and SNP calling
The CLC genomics Workbench (v8.5.1) was used to check sequencing quality (QC) and trim the sequence reads. Quality trimming value was set to 0.01 (Q=20). For trimming, ambiguous nucleotides were removed to allow maximal 2 nucleotides. Sequence length less than 80 was removed. A pipeline implemented in Python program was used for the processing of trimmed data. This pipeline uses several software tools as Burrow Wheelers Alignment (BWA), Sequence Alignment/Map (SAM) Tools, and Picard (Li and R. Durbin, 2009; Li et al., 2009; Truong et al., 2012). The raw reads were aligned to the reference genome using the Burrow-Wheeler Aligner program v0.7.12 (Li and Durbin, 2009). To group and sort the aligned read, Picard Tools v1.19 and SAMtools v1.1 were used. For SNP calling, the Genome Analysis ToolKit (GATK) UnifiedGenotyper v3.8-0 was used (Depristo et
al., 2011). SNPs were filtered for minimum genotype quality of Q30, allele frequency (AF) and a minimum sequencing depth 3.
GBS SNP dataset filtering and genotyping
Processed GBS reads were aligned against the reference genome of F. ×
ananassa ‘Wongyo’ for SNP calling. The following criteria were used for further
SNP filtering: (i) SNP loci with no calling data in both parents was removed; (ii) threshold for removal was set to P <0.01; (iii) based on the fact that one parent is clearly called homozygous, the uncertain genotype of the opposite parent was determined (iiii). In case of one parent was no-call or heterozygous, or both parents were heterozygous, it was adjusted to the genotypes around the SNP loci. Lastly, we performed parent-based genotyping of paternal line to “A” and maternal line to “B”. The genotypes were labeled as “A” or “B” for homozygous genotypes, and “H” for heterozygous genotypes. ‘Chandler’, ‘Sachinoka’ and individuals following ‘Chandler’ and ‘Sachinoka’ genotypes were coded as “A”, whereas ‘Bennihoppe’ and individuals following ‘Bennihoppe’ genotypes were coded as “B” (Rabbi et al., 2014; Moumouni et al., 2015).
Axiom marker dataset filtering and genotyping
To select F₂ plants for Genotyping using Affymetrix of Axiom® Strawberry Array (IStraw90K), gDNA quality was evaluated using ND-1000 spectrophotometer
(Thermofisher, Waltham, and USA) and Quant-iT™ PicoGreen ® dsDNA Reagent (Thermofisher, Waltham, and USA). Among the ‘L80’ F₂ plants, 94 individuals having high recombination rates, which were calculated using GBS data, were selected. The Axiom SNP array experiment were performed at DNA Link (Seoul, Korea). The quality of raw data for each individual were determined using the default Dish QC values by Affymetrix Power Tools (APT). After removing DQC, the genotype calling were performed using APT with AxiomGT1 BRLMM-P algorithm. For genotyping analysis, Axiom Analysis Suite v4.0.1 was used.
Bin map and SNP linkage map construction
In this study, we constructed a bin map to solve the genotyping error and missing data. The ratios of SNPs with both parental genotypes was calculated for each window, defined as a window unit of 2.0 Mb and a moving window size of 200 Kb. When more than 70% of SNPs had one parental genotype, the window was called as homozygous; otherwise, the window was called as heterozygous. Adjacent windows with same genotype were combined into a recombination bin. Recombination breakpoints were determined as the position where a different genotype emerged. A linkage map of bins was constructed by using the Carthagene software (De Givry et al., 2005). The criteria used to construct a linkage group were a 3.0 LOD threshold score and limited distance of 50 cM. Among several LGs, the best map order was determined based on LOD scores and recombination frequencies. The Kosambi genetic mapping function was used to calculate the distances between
bin markers. The resulting linkage map was then drawn using the MapChart2.2 software (Voorrips. R, 2002).
Comparison of linkage map to physical map
After construction of the linkage map using bin marker, linkage map and physical map were compared using ALLMAPS software (Haibao Tang., 2015). The physical map information was based on the genome sequence of ‘Wongyo’ reference. In the case of chromosome divided into two linkage groups, the gap connecting the two divided linkage groups was set to 50 cM. [W사8]
Scaffold reassembly in 'Camarosa’ reference genome
The scaffolds of the ‘Camarosa’ reference genome were reassembled of the scaffolding errors using the linkage bin map of the domesticated population, ‘L80’ and linkage maps of the two wild type populations, ‘Del norte’ and ‘PI552277’ (Hardigan et al., 2019). Firstly, in order to identify and correct the scaffolding errors of the ‘Camarosa’ reference genome, the ALLMAPS program (--links=3) was used to identify the collinearity between the ‘Camarosa’ reference genome and three linkage maps. In case of ‘L80’ population, the sequence between -250bp and +250bp based on the SNP position was extracted. Then, the physical position in the Chandler reference genome was detected through the local blastn (Evalue of 3, maximum under of HSPs of 1.0 and maximum target sequence of 10.0) on the Linux server.
Secondly, the gap position was detected in ‘Camarosa’ reference genome, and among the gaps that matches the region where the chromosomes were twisted, the gap with the most average value was selected. Based on the selected gap, the chromosomes were divided. Finally, using the ALLMAPS program (--links=3), the ‘Camarosa’ reference genome were reassembled with the ‘Camarosa’ reference genome divided by the gap position and three linkage maps.
Measurement of firmness
Strawberry firmness was evaluated by modified method of non-destructive way. Fruit firmness was leveled by compressing 80~90% ripe fruit between thumb and forefinger and scored from hard to mushy (Leveled 1 to 10, level 1; very soft; level 10; very firm) (Mathey et al., 2013). [o9]Firmness evaluation was conducted at the National Institute of Horticulture and Herbal Science in 2018.
QTL analysis
Using the two genetic bin maps and firmness phenotypic data, composite interval mapping was performed using Windows QTL Cartographer v2.5 (Wang et al., 2012). The result were screened for functional QTL based on an LOD value 2.5. The closest bin marker to the QTL with the highest LOD was selected to represent QTL in firmness. The proportion of phenotypic variation explained by each QTL was estimated using R² (%) value.
RESULTS
Genotyping by sequencing and Axiom array genotyping
Sequencing data of GBS libraries for ‘L80’ and ‘T137’ were obtained and aligned to ‘Wongyo’ reference genome assembly. A total of 61,862 (‘L80’) and 75,595 (‘T137’) raw SNPs were obtained from the Illumina sequencing. After quality filtering (minimum 30 phred-score, minimum read depth of 3 and minimum calling rate of 70%, 6,312 and 11,378 SNPs were obtained for ‘L80’ and for ‘T137’, respectively. SNPs fitted to a segregation ratio of 1:2:1 (p-value > 0.01) were selected and 855 and 1,091 GBS SNPs were finally obtained for ‘L80’ and ‘T137’, respectively (Table 1).[W사10] In case of the Axiom SNPs, only ‘L80’ population were used for analysis. The scores for the probes were classified into six categories produced by the Affymetrix software: (1) Poly High Resolution (PHR) (4,463; 3.23%); (2) Call Rate Below Threshold (CRBT) (4,714; 3.41%); (3) Other (20,571; 14.9%) (4) Off-Target Variant (OTV) (123; 0.09%); (5) Mono High Resolution (MHR) (100,851; 73.03%); (6) No Minor Homozygote (NMH) (7,377; 5.34%). Along with the first group (PHR) markers suggested by the company, second group (CRBT) and third group (Other) markers were used for blastn to align ‘Wongyo’ reference genome. As a result, total 4,936 Axiom markers were multiple alignment locus and showed a 1:2:1 segregation ratio (p-value > 0.01) (Table 2).
Table 1. Summary of GBS-based SNP marker sets
Name Population size Raw SNPs QC filtered Final marker*
L80 149 61,862 6,312 855
T137 147 75,595 11,378 1,091
*Final marker means that the F₂ genotype matched to 1:2:1 segregation ratio selected through the chi square test (p-value > 0.01).
Table 2. Number of markers in six classes for Axiom IStraw90 genotyping array
Name PHR CRBT Other OTV MHR NMH Filtered SNP Total
Bin map construction
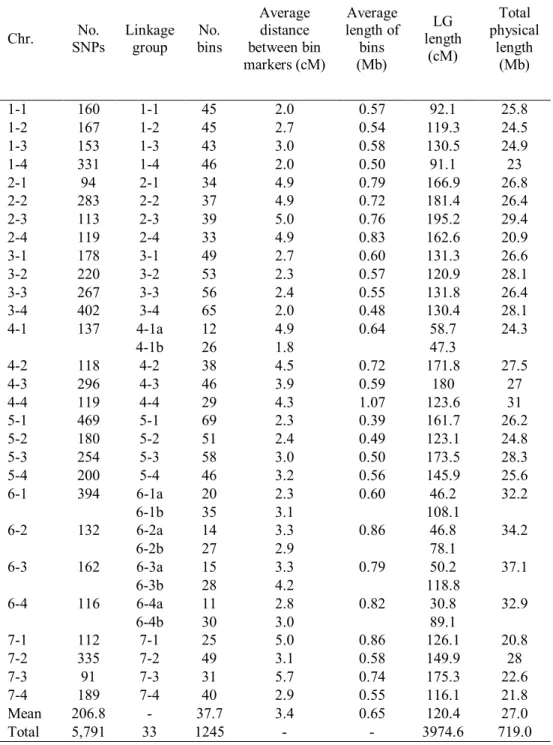
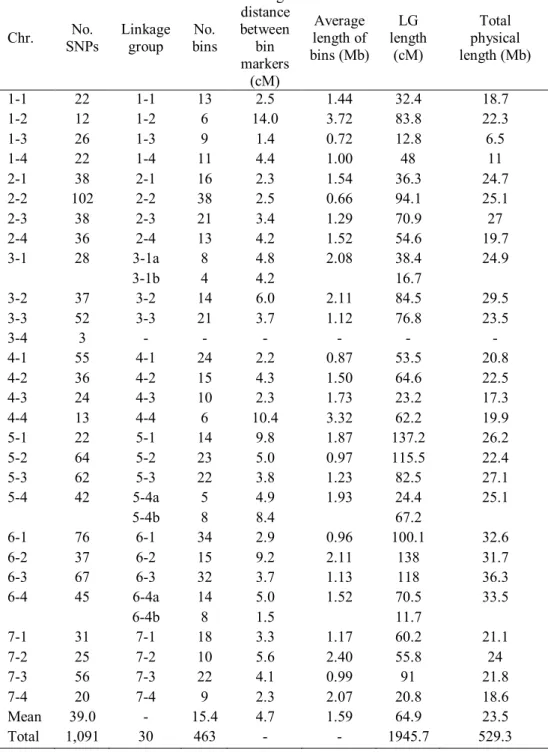
We used F. × ananassa chromosome information with the reference in this study. High-density genetic maps of populations with high linkage disequilibrium contain many redundant markers that provide no new information, but increase the computational requirements of mapping. Furthermore, a small percentage of genotypes are falsely called due to sequencing error. To complement for missing data and genotyping errors and to construct an ultra-high-density linkage map, a modified sliding window approach was applied (Huang et al., 2009). A slightly modified sliding window approach (Han et al., 2016) was used to investigate recombination breakpoints and construct a bin map. Adjacent SNPs with the same genotype were integrated into a single recombination bin, and the genotype of each bin was determined based on the ratio between SNPs from two parents. This bin was used as a marker for construct a linkage map. A total of 5,791 SNPs (‘L80’) and 1,091 SNPs (‘T137’) were used to construct the bin map. All SNPs were distributed in 1,245 bins (‘L80’) and 463 bins (‘T137’), grouped into 33 and 30 linkage groups, respectively. The average length of bin is 0.65Mb (‘L80’) and 1.74Mb (‘T137’), which means that the length of one bin representing the physical genome region in the ‘L80’ population is shorter than in the ‘T137’ population (Table 3 and Table 4). Most of bin marker length were more than 1Mb, ranging from 100kb to 11.8Mb (‘L80’) and 100kb to 19.1Mb (‘T137’).
Table 3. The total number of SNPs and bin markers mapped to the ‘L80’ linkage map.
Chr. SNPsNo. Linkage group binsNo.
Average distance between bin markers (cM) Average length of bins (Mb) LG length (cM) Total physical length (Mb) 1-1 160 1-1 45 2.0 0.57 92.1 25.8 1-2 167 1-2 45 2.7 0.54 119.3 24.5 1-3 153 1-3 43 3.0 0.58 130.5 24.9 1-4 331 1-4 46 2.0 0.50 91.1 23 2-1 94 2-1 34 4.9 0.79 166.9 26.8 2-2 283 2-2 37 4.9 0.72 181.4 26.4 2-3 113 2-3 39 5.0 0.76 195.2 29.4 2-4 119 2-4 33 4.9 0.83 162.6 20.9 3-1 178 3-1 49 2.7 0.60 131.3 26.6 3-2 220 3-2 53 2.3 0.57 120.9 28.1 3-3 267 3-3 56 2.4 0.55 131.8 26.4 3-4 402 3-4 65 2.0 0.48 130.4 28.1 4-1 137 4-1a 12 4.9 0.64 58.7 24.3 4-1b 26 1.8 47.3 4-2 118 4-2 38 4.5 0.72 171.8 27.5 4-3 296 4-3 46 3.9 0.59 180 27 4-4 119 4-4 29 4.3 1.07 123.6 31 5-1 469 5-1 69 2.3 0.39 161.7 26.2 5-2 180 5-2 51 2.4 0.49 123.1 24.8 5-3 254 5-3 58 3.0 0.50 173.5 28.3 5-4 200 5-4 46 3.2 0.56 145.9 25.6 6-1 394 6-1a 20 2.3 0.60 46.2 32.2 6-1b 35 3.1 108.1 6-2 132 6-2a 14 3.3 0.86 46.8 34.2 6-2b 27 2.9 78.1 6-3 162 6-3a 15 3.3 0.79 50.2 37.1 6-3b 28 4.2 118.8 6-4 116 6-4a 11 2.8 0.82 30.8 32.9 6-4b 30 3.0 89.1 7-1 112 7-1 25 5.0 0.86 126.1 20.8 7-2 335 7-2 49 3.1 0.58 149.9 28 7-3 91 7-3 31 5.7 0.74 175.3 22.6 7-4 189 7-4 40 2.9 0.55 116.1 21.8 Mean 206.8 - 37.7 3.4 0.65 120.4 27.0 Total 5,791 33 1245 - - 3974.6 719.0
Table 4. The total number of SNPs and bin markers mapped to the ‘T137’ linkage map.
Chr. SNPsNo. Linkage group binsNo.
Average distance between bin markers (cM) Average length of bins (Mb) LG length (cM) Total physical length (Mb) 1-1 22 1-1 13 2.5 1.44 32.4 18.7 1-2 12 1-2 6 14.0 3.72 83.8 22.3 1-3 26 1-3 9 1.4 0.72 12.8 6.5 1-4 22 1-4 11 4.4 1.00 48 11 2-1 38 2-1 16 2.3 1.54 36.3 24.7 2-2 102 2-2 38 2.5 0.66 94.1 25.1 2-3 38 2-3 21 3.4 1.29 70.9 27 2-4 36 2-4 13 4.2 1.52 54.6 19.7 3-1 28 3-1a 8 4.8 2.08 38.4 24.9 3-1b 4 4.2 16.7 3-2 37 3-2 14 6.0 2.11 84.5 29.5 3-3 52 3-3 21 3.7 1.12 76.8 23.5 3-4 3 - - - -4-1 55 4-1 24 2.2 0.87 53.5 20.8 4-2 36 4-2 15 4.3 1.50 64.6 22.5 4-3 24 4-3 10 2.3 1.73 23.2 17.3 4-4 13 4-4 6 10.4 3.32 62.2 19.9 5-1 22 5-1 14 9.8 1.87 137.2 26.2 5-2 64 5-2 23 5.0 0.97 115.5 22.4 5-3 62 5-3 22 3.8 1.23 82.5 27.1 5-4 42 5-4a 5 4.9 1.93 24.4 25.1 5-4b 8 8.4 67.2 6-1 76 6-1 34 2.9 0.96 100.1 32.6 6-2 37 6-2 15 9.2 2.11 138 31.7 6-3 67 6-3 32 3.7 1.13 118 36.3 6-4 45 6-4a 14 5.0 1.52 70.5 33.5 6-4b 8 1.5 11.7 7-1 31 7-1 18 3.3 1.17 60.2 21.1 7-2 25 7-2 10 5.6 2.40 55.8 24 7-3 56 7-3 22 4.1 0.99 91 21.8 7-4 20 7-4 9 2.3 2.07 20.8 18.6 Mean 39.0 - 15.4 4.7 1.59 64.9 23.5
SNP linkage map construction
Two linkage bin maps have been constructed to improve genome quality and QTL analysis. The linkage maps were constructed with a total of 1,245 (‘L80’) and 463 bins (‘T137’), and Carthagene software was used. As a result, a linkage maps consisting of 33 linkage groups (‘L80’) and 30 linkage groups (‘T137’) corresponding to 28 strawberry chromosomes was constructed. In case of ‘L80’ population, chromosome 4-1, 6-1, 6-2, 6-3, 6-4 were divided into two linkage groups and in case of ‘T137’ population, chromosome 3-1, 5-4, 6-4 were divided into two linkage groups. Also, in the ‘T137’ population, the number of SNP markers in the chromosome 3-4 was only three, so the linkage group could not be developed (Fig. 1 and Fig. 2). The total length of the linkage maps were 3,974.6 cM (‘L80’) and 1,945.7 cM (‘T137’) based on the genetic distance, and 780.9 Mb (‘L80’) and 677.6 Mb (‘T137’) based on the physical distance. In the ‘L80’ population, it was confirmed that the genetic and physical lengths were longer than ‘T137’ population. Also, in ‘L80’ population, length per bin were approximately 3.4 cM and 0.65 Mb. On the other hands, in ‘T137’ population, length per bin were approximately 4.7 cM and 1.74 Mb (Table 3 and Table 4). These results indicate that the linkage bin map constructed using GBS and Axiom markers is high-density rather than the linkage bin map constructed using only GBS markers.
F ig ur e 1. C on st ru ct io n of ‘ L 80 ’ S N P lin ka ge b in m ap H ig h-de ns ity l in ka ge b in m ap o f th e ‘L 80 ’ p op ul at io n de ri ve d fr om t he c ro ss b et w ee n ‘B en ih op pe ’ a nd ‘ D oy on ok a’ . T he lin ka ge b in m ap c on si st s of G B S a nd A xi om m ar ke r se ts . L in ka ge g ro up s ar e de no te d L G 1-L G 33 c or re sp on di ng t o 28 ch ro m os om es in s tr aw be rr y. C hr 4-1, 6 -1 , 6 -2 , 6 -3 a nd 6 -4 a re d iv id ed in to tw o lin ka ge g ro up s. T he c ol or o f t he u pp er li ne s, gr ou pe d by s ub -g en om e, i nd ic at es t o se ve n F. v es ca c hr om os om es . T he b ar o n th e le ft is a n in di ca to r of t he l en gt h of t he lin ka ge g ro up s.
F ig ur e 2. C on st ru ct io n of ‘ T 13 7’ S N P lin ka ge b in m ap H ig h-de ns ity li nk ag e bi n m ap o f th e ‘T 13 7’ p op ul at io n de ri ve d fr om th e cr os s be tw ee n ‘B en ih op pe ’ a nd ‘ S ac hi no ka ’. T he lin ka ge b in m ap c on si st s of o nl y G B S m ar ke rs . L in ka ge g ro up s ar e de no te d L G 1-L G 30 c or re sp on di ng to 2 7 ch ro m os om es in s tr aw be rr y. T he l in ka ge g ro up c or re sp on di ng t o C hr 3-4 ha s no t be en c on st ru ct ed . C hr 3-1, 5 -4 a nd 6 -4 a re d iv id ed i nt o tw o lin ka ge g ro up s. T he c ol or o f th e up pe r lin es , g ro up ed b y su b-ge no m e, i nd ic at es t o se ve n F. v es ca c hr om os om es . T he ba r on th e le ft is a n in di ca to r of th e le ng th o f th e li nk ag e gr ou ps .
Relationship between linkage map and physical map
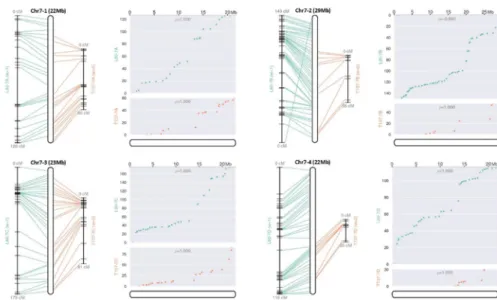
To evaluate the linkage maps constructed with 1,245 (‘L80’) and 463 bins (‘T137’), the physical position of ‘Wongyo’ reference genome and genetic position of two linkage groups were compared. It was confirmed that the collinearity was high in most of the bin markers in all 28 chromosomes. In case of two linkage groups are generated in one chromosome, the gap between the genetic position of the last marker of one linkage group and the genetic position of the first marker of the other linkage group was set to 50 cM and connected. The 50 cM is an option value used when developing a linkage group in the Carthagene program. By connecting the two divided linkage groups, it was easier to identify the collinearity. Although the ‘L80’ population has more bin markers than the ‘T137’ population, the Pearson correlation values were generally higher or equal, except for chromosome 5-2 and 7-2. Also, the region covering 28 chromosome genome sequences was 719.0 Mb (87.7%) in the ‘L80’ population and 529.3 Mb (64.6%) in the ‘T137’ population, showing a higher coverage in the ‘L80’ population (Fig 3; Table 3 and Table 4). The reason is that the number of markers in the ‘L80’ population composed of the GBS and Axiom markers is larger than that of the ‘T137’ population composed only GBS markers, and the flanking sequence of the Axiom marker has the characteristics of octoploid that align with up to four duplicated homoeologous octoploid sequences. Compared to linkage maps published in the previous study (Hardigan et al., 2019), it was confirmed that the linkage map of the ‘L80’ population showed higher coverage.
Figure 3. Comparison of the two linkage bin maps with ‘Wongyo’ reference genome.
Left and right bar shows two different linkage bin map. Left bar is ‘L80’ population, right bar is ‘T137’ population. Middle bar represents physical map of ‘Wongyo’ reference genome. The graph shows the Pearson correlation values and collinearity for genetic position and physical position of 28 chromosomes. The markers corresponding to ‘L80’ population are indicated by green color lines and dots, and the markers corresponding to ‘T137’ population are indicated by orange color lines and dots.
Scaffolds reassembly
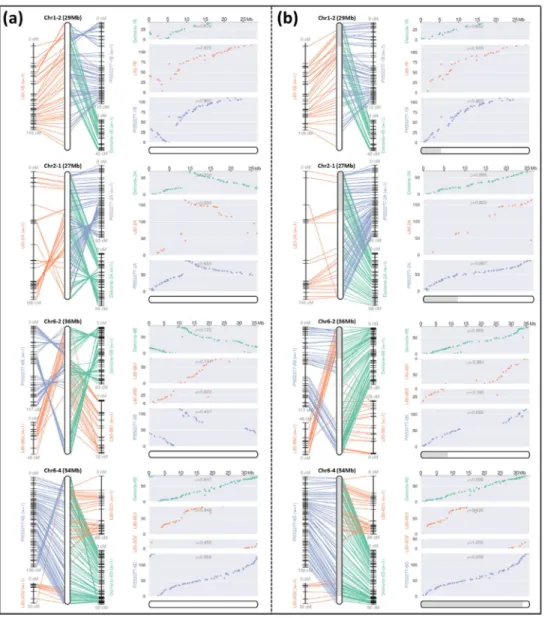
To correct the ‘Camarosa’ reference genome, chromosome reassembly of scaffolding errors was processed in ALLMAPS program using our linkage bin map and two (published) linkage maps. As a result of identifying the collinearity by comparing the physical position of the ‘Camarosa’ reference genome and three linkage maps, a wide range of scaffolding errors could be identified in the four chromosomes 1-2, 2-1, 6-2, 6-4 (Fig 4a). The range of physical positions that generated these uncollinearity was 5,288,841 bp to 5,393,984 bp (Chromosome 1-2), 18,256,718 bp to 18,411,584 bp (Chromosome 2-1), 26,559,923 bp to 27,260,197 bp (Chromosome 6-2) and 1,827,818 bp to 2,786,280 bp (Chromosome 6-4), respectively. After that, as a result of extracting the range of the actual gap position, it was 5,346,824 bp to 5,347,824 bp (Chromosome 1-2), 18,304,402 bp to 18,304,427 bp (Chromosome 2-1), 27,212,991 bp to 27,213,991 bp (Chromosome 6- 2) and 2,204,157 bp to 2,205,157 bp (Chromosome 6-4), respectively. Each uncollinearity chromosomes were divided based on the actual gap, and the divided chromosomes were reassembled using the three linkage maps and ALLMAPS program. We showed four chromosomes completely reassembled (Fig 4b). It was identified that the physical position of the ‘Camarosa’ reference genome and the genetic position of the three linkage maps became more collinear than ‘Camarosa’ reference genome before reassembly (Fig 4).
Figure 4. Four chromosome reassembly of ‘Camarosa’ reference genome.
(a) represents the comparison between physical position of the ‘Camarosa’ reference genome and genetic position of the three linkage maps. Show discordance on all three linkage maps. (b) represents the comparison between physical position of the ‘Camarosa’ reference genome, which has been reassembled, and genetic position of the three linkage maps. In the bar, black and white color shows that the chromosomes
QTL analysis for firmness in ripe fruit and identify of
association with firmness-related genes
QTL controlling firmness in ripe fruit were detected in two population. Phenotype data for firmness and two linkage bin maps were used to identify QTL. In the ‘L80’ population, a total of nine QTL were mapped to the linkage bin map constructed in this study. On the other hands, only 5 QTL were detected in the ‘T137’ population. In case of ‘L80’ population, QTL were detected on chromosome 2, 1-4, 2-2, 3-1, 3-2, 4-1b, 6-3b, 7-2, 7-3. In case of ‘T137’ population, QTL were detected on chromosome 2-2, 3-3, and 4-1. Chromosome 3-2 showed the highest LOD score and explained 34.6% of total phenotypic variation in the ‘L80’ population. Chromosome 2-2 and 4-1 showed the highest LOD score and explained 0.1% and 8.8% of total phenotypic variation, respectively in the ‘T137’ population. Chromosome 4-1 region were the common QTL in the two populations, but the LOD value was relatively low. The ‘L80’ population detected relatively more QTL regions compared to the ‘T137’ population, and detected a region showing a higher LOD value because the ‘L80’ population is a linkage bin map composed of a high-density marker set rather than the ‘T137’ population (Table 6 and Table 7). As a result, the major QTL are not the regions where QTL are commonly detected in the two linkage groups, but the QTL on chromosome 3-2 and 6-3b region, which has a relatively high LOD value in the ‘L80’ population, appeared to be major QTL controlling firmness in strawberry ripe fruit (Fig 5). In addition, we investigated whether QTL
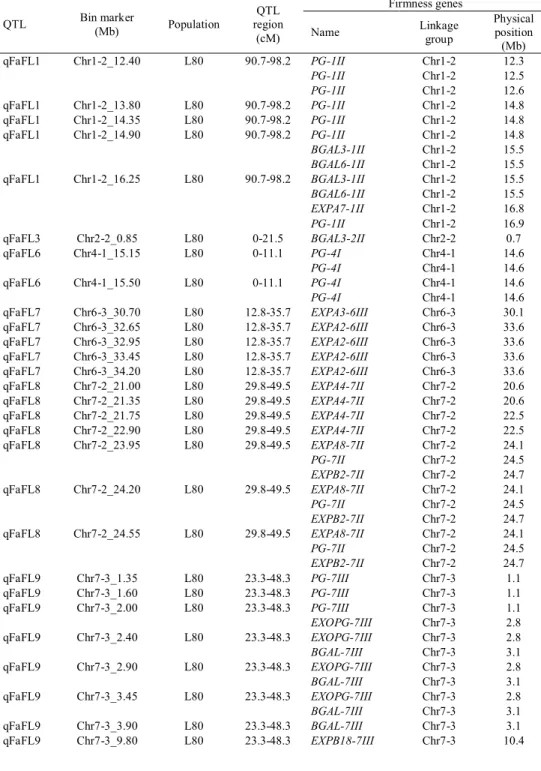
positions associated with fruit firmness are overlapped with firmness-related genes position. The physical position of the genes was extracted from annotation data of the octoploid reference genome, ‘Wongyo’ (Appendix 1 and Appendix 2). The physical positions of the closest bin markers linked to fruit firmness QTL were compared to the firmness-related gene location (Table 7 and Table 8). Since the sliding window size of bin markers was 2Mb, the genes existing between the 1Mb before and 1Mb after the bin marker was extracted. Comparison of the physical positions between the bin markers and firmness-related genes showed that twenty-nine and thirteen bin markers were located close to the firmness-related gene positions in L80 and T137 population, respectively. Among them, there were five markers belonging to the major QTL region ‘qFaFL7’. The markers’ name are 3_30.70’, 3_32.65’, 3_32.95’, 3_33.45’ and ‘Chr6-3_34.20’ and the markers ranged from 30.7Mb to 34.2Mb. Two firmness-related genes ranging from 30.1 Mb to 33.6 Mb associated with the markers, EXPA2 and
Table 5. Summary of QTL for firmness in ‘L80’ population[o11]. QTL Chromosome Location (cM) LOD R 2(%) Additive effect Dominant effect Location (Mb) qFaFL1 Chr1-2 90.7-98.2 3.6 16.0 0.1858 0.5497 11.1-16.3 qFaFL2 Chr1-4 84.6-87.9 2.8 28.4 0.6971 0.6545 20.9-21.2 qFaFL3 Chr2-2 0-21.5 2.6 5.6 0.4104 0.3789 8.5-17.5 qFaFL4 Chr3-1 112-118.7 3.3 48.9 0.6007 0.6191 27.2-27.5 qFaFL5 Chr3-2 56.9-66.4 6.6 34.6 0.5354 0.1446 19.1-20.4 qFaFL6 Chr4-1b 0-11.1 3.6 8.4 0.3066 0.0756 15.2-15.9 qFaFL7 Chr6-3b 12.8-35.7 6.5 25.6 0.4746 0.0835 30.7-34.2 qFaFL8 Chr7-2 29.8-49.5 2.6 1.2 0.2053 0.2059 20.9-27.4 qFaFL9 Chr7-3 23.3-48.3 2.5 17.2 0.3809 0.302 1.4-11.1
Table 6. Summary of QTL for firmness in ‘T137’ population[o12]
QTL Chromosome Location(cM) LOD (%)R2 Additive effect Dominant effect Location(Mb)
qFaFT1 Chr2-2 16.5-24.3 2.7 0.4 0.1098 0.4247 6.0-11.0
qFaFT2 Chr2-2 24.3-46.9 3.2 0.1 0.1091 0.5513 11.0-15.3
qFaFT3 Chr3-3 13-21.4 3.0 22.0 0.3489 0.1647 7.9-9.6
qFaFT4 Chr3-3 21.4-39.3 2.6 18.7 0.3368 0.1382 9.6-17.4
Fig 5. Positions of two major QTL for firmness in ‘L80’ population.
Two major QTL was identified for firmness in strawberry fruit on chromosome 3-2 (A) and 6-3b. Major QTL which has highest LOD score was located in 61.4 cM (A) and 29.5 cM (B), respectively.
Table 7. Comparison of bin markers most closely linked to firmness QTL and
genes[o13] in ‘L80’ population
QTL Bin marker(Mb) Population
QTL region (cM)
Firmness genes
Name Linkage group
Physical position (Mb) qFaFL1 Chr1-2_12.40 L80 90.7-98.2 PG-1II Chr1-2 12.3 PG-1II Chr1-2 12.5 PG-1II Chr1-2 12.6 qFaFL1 Chr1-2_13.80 L80 90.7-98.2 PG-1II Chr1-2 14.8 qFaFL1 Chr1-2_14.35 L80 90.7-98.2 PG-1II Chr1-2 14.8 qFaFL1 Chr1-2_14.90 L80 90.7-98.2 PG-1II Chr1-2 14.8 BGAL3-1II Chr1-2 15.5 BGAL6-1II Chr1-2 15.5 qFaFL1 Chr1-2_16.25 L80 90.7-98.2 BGAL3-1II Chr1-2 15.5 BGAL6-1II Chr1-2 15.5 EXPA7-1II Chr1-2 16.8 PG-1II Chr1-2 16.9 qFaFL3 Chr2-2_0.85 L80 0-21.5 BGAL3-2II Chr2-2 0.7 qFaFL6 Chr4-1_15.15 L80 0-11.1 PG-4I Chr4-1 14.6 PG-4I Chr4-1 14.6 qFaFL6 Chr4-1_15.50 L80 0-11.1 PG-4I Chr4-1 14.6 PG-4I Chr4-1 14.6 qFaFL7 Chr6-3_30.70 L80 12.8-35.7 EXPA3-6III Chr6-3 30.1 qFaFL7 Chr6-3_32.65 L80 12.8-35.7 EXPA2-6III Chr6-3 33.6 qFaFL7 Chr6-3_32.95 L80 12.8-35.7 EXPA2-6III Chr6-3 33.6 qFaFL7 Chr6-3_33.45 L80 12.8-35.7 EXPA2-6III Chr6-3 33.6 qFaFL7 Chr6-3_34.20 L80 12.8-35.7 EXPA2-6III Chr6-3 33.6 qFaFL8 Chr7-2_21.00 L80 29.8-49.5 EXPA4-7II Chr7-2 20.6 qFaFL8 Chr7-2_21.35 L80 29.8-49.5 EXPA4-7II Chr7-2 20.6 qFaFL8 Chr7-2_21.75 L80 29.8-49.5 EXPA4-7II Chr7-2 22.5 qFaFL8 Chr7-2_22.90 L80 29.8-49.5 EXPA4-7II Chr7-2 22.5 qFaFL8 Chr7-2_23.95 L80 29.8-49.5 EXPA8-7II Chr7-2 24.1 PG-7II Chr7-2 24.5 EXPB2-7II Chr7-2 24.7 qFaFL8 Chr7-2_24.20 L80 29.8-49.5 EXPA8-7II Chr7-2 24.1 PG-7II Chr7-2 24.5 EXPB2-7II Chr7-2 24.7 qFaFL8 Chr7-2_24.55 L80 29.8-49.5 EXPA8-7II Chr7-2 24.1 PG-7II Chr7-2 24.5 EXPB2-7II Chr7-2 24.7 qFaFL9 Chr7-3_1.35 L80 23.3-48.3 PG-7III Chr7-3 1.1 qFaFL9 Chr7-3_1.60 L80 23.3-48.3 PG-7III Chr7-3 1.1 qFaFL9 Chr7-3_2.00 L80 23.3-48.3 PG-7III Chr7-3 1.1 EXOPG-7III Chr7-3 2.8 qFaFL9 Chr7-3_2.40 L80 23.3-48.3 EXOPG-7III Chr7-3 2.8 BGAL-7III Chr7-3 3.1 qFaFL9 Chr7-3_2.90 L80 23.3-48.3 EXOPG-7III Chr7-3 2.8 BGAL-7III Chr7-3 3.1 qFaFL9 Chr7-3_3.45 L80 23.3-48.3 EXOPG-7III Chr7-3 2.8 BGAL-7III Chr7-3 3.1 qFaFL9 Chr7-3_3.90 L80 23.3-48.3 BGAL-7III Chr7-3 3.1
qFaFL9 Chr7-3_10.50 L80 23.3-48.3 EXPB18-7III Chr7-3 10.4 Table 8. Comparison of bin markers most closely linked to firmness QTL and
genes[o14] in ‘T137’ population
QTL Bin marker(Mb) Population QTL region(cM)
Firmness genes
Name Linkage group
Physical position (Mb) qFaFT1 Chr2-2_6.00 T137 16.5-46.9 BGAL-2II Chr2-2 7.0 qFaFT1 Chr2-2_6.20 T137 16.5-46.9 BGAL-2II Chr2-2 7.0 qFaFT1 Chr2-2_6.50 T137 16.5-46.9 BGAL-2II Chr2-2 7.0 qFaFT1 Chr2-2_6.70 T137 16.5-46.9 BGAL-2II Chr2-2 7.0 qFaFT1 Chr2-2_7.10 T137 16.5-46.9 BGAL-2II Chr2-2 7.0 qFaFT1 Chr2-2_7.70 T137 16.5-46.9 BGAL-2II Chr2-2 7.0 qFaFT2 Chr2-2_13.60 T137 16.5-46.9 EXOPG-2II Chr2-2 13.1 EXPA20-2II Chr2-2 13.1 qFaFT2 Chr2-2_14.90 T137 16.5-46.9 PL8-2II Chr2-2 14.8 PG-2II Chr2-2 15.5 qFaFT3 Chr3-3_7.90 T137 13-39.3 EXPA13-3III Chr3-3 7.7 qFaFT4 Chr3-3_11.40 T137 13-39.3 EXPA12-3III Chr3-3 11.8 qFaFT4 Chr3-3_11.90 T137 13-39.3 EXPA12-3III Chr3-3 11.8 qFaFT4 Chr3-3_12.40 T137 13-39.3 EXPA12-3III Chr3-3 11.8 qFaFT5 Chr4-1_15.30 T137 22.3-44.6 PG-4I Chr4-1 14.6
DISCUSSION
[W사15]In strawberry, the first linkage map of octoploid strawberry (F. x ananassa) was constructed using AFLP markers (Lerceteau-Köhler et al., 2003). It had several limitations: (i) the number of markers was too small per linkage map, (ii) marker densities were relatively low, and (iii) the total map size was also relatively small. After construction of this linkage map, various molecular markers have been developed. A high-density linkage map was constructed using the various molecular markers (Isobe et al., 2013; Sargent et al., 2016; Vining et al., 2017). In this study, we used the Affymetrix IStraw90 Axiom array and genotyping-by-sequencing (GBS) to construct high density linkage maps. These methods have several competitive advantages compared to other genotyping methods. The Affymetrix IStraw90 Axiom array has the advantages of high marker density approximately one marker per every 0.5 cM, and no risks of sequencing errors (Bassil et al., 2015). Genotyping-by-sequencing (GBS) has the advantage of being able to identify high-throughput and cost-effective to identify single-nucleotide polymorphisms (SNPs) on a whole-genome scale. In this study, using the advantages of these two techniques, a marker set was selected and used for linkage map construction. In the case of Axiom array markers, special modification method was applied. It was to convert the Axiom marker set based on the diploid reference genome, ‘F. vesca’ into Axiom marker set based on the octoploid reference genome, ‘F. x ananassa’. That is, if the flanking
sequence of these ‘F. vesca’-based marker is blasted to the octoploid reference genome, the flanking sequences are multiple-aligned to the subgenome. Using this characteristic, the number of markers was increased and thereby, a linkage map of octoploid strawberry was constructed to cover the entire genome spans as much as whole genome shotgun sequencing based linkage map, ‘Del norte’ (Hardigan et al., 2019) and also to cover the break of the physical map caused by large homozygous regions.[W사16] Therefore, in this study, the ‘L80’ linkage bin map constructed by applying the modification method is a suitable for constructing a physical map of the octoploid strawberry reference genome using an inbred line such as ‘Wongyo’ as well as for covering the large homozygous regions of ‘Camarosa’. Our high-density linkage map will contribute to a molecular marker breeding to enable genomic selection and precise mapping of agronomically important genes and have numerous applications in genomic research in octoploid strawberry.
With the development of sequencing and scaffolding technologies, a chromosome-scale reference genome ‘Camarosa’ was assembled in 2019 (Edger et al., 2019). It provided the physical framework needed to molecular breeding. However, as reported in Micheal A. Hardigan, wild species octoploid map revealed some chromosomal rearrangements on chromosomes 1-2, 1-4, 2-1, 2-3, 2, and 6-4, indicating intra-chromosomal scaffolding errors in the physical reference genome. Especially, scaffolding errors occurred large region on chromosome 1-2, 2-1, 6-2, and 6-4. In this study, we identified and corrected the scaffolding error using a high-density map, ‘L80’, and two previously constructed wild species maps. As some
chromosomes were reassembled, the scaffolding error of ‘Camarosa’ was corrected and improved, and it will be very useful framework for studies on DNA variation discovery, gene discovery, genetic mapping, QTL analysis and genome wide association study based on this octoploid reference genome.
There are a number of the genes and enzymes associated with fruit firmness: Expansin, Polygalactosidase (PG), Pectate lyase (PL), pectin methylesterase (PME), and B-galactosidase (Harrison et al., 2001; Posé, S et al., 2011; Jiménez-Bermudez, S et al., 2002; Duvetter, T et al., 2005). Among them, the gene associated with the major QTL region in my study was expansin, so we explore this genes, intensively. The genes are present in cell walls and are associated with cell wall expansion, affecting firmness of strawberry. In strawberry, seven expansin genes have been reported to regulate fruit softness (Harrison et al., 2001; Dotto et al., 2006). Of these, three genes (FaEXP1, FaEXP2, and FaEXP5) showed correlations between fruit-specific firmness and their mRNA expression level (Dotto et al., 2006). In the previous study, QTL for fruit firmness were detected on chromosome 1, 2, 3, 4 and 7. In addition, the physical position of the markers detected in the QTL region was compared with the expansin genes. As a result, three markers were reported to be located close to the expansin gene position (Antanaviciute et al., 2016). (
)In this studies, we used the two linkage bin map developed by GBS and Axiom array to analyze QTL controlling firmness in strawberry fruit. Mapping populations were derived from one relatively high firmness and two relatively low firmness. In addition to the detected chromosome in the previous study, it was additionally
detected in chromosome 6. The similarity between the QTL analysis of the previous study and this study was that QTL is detected in various regions of the chromosome. On the other hand, when comparing the QTL analysis of the previous study with this study, a few differences were identified. On the contrary to the previous study based on the diploid reference genome, QTL analysis was conducted based on the octoploid reference genome in this study. In previous study, the physical positions of the three markers located closely to the position of the expansin genes were located on F. vesca chromosome 2 and 7. By contrast, we were able to detect a total of fifteen bin markers located close to the position of the expansin genes. In ‘L80’ linkage bin map, the physical positions of five bin markers out of fifteen were located on F. x
ananassa chromosome 1-2, 1-4, 6-3b, and 7-2. In ‘T137’ linkage bin map, the
physical position of ten bin markers out of fifteen are located on F. x ananassa chromosome 2-2 and 3-3. In this study, the major QTLs ‘qFaFL5’ and ‘qFaFL7’ were observed only in the ‘L80’ linkage bin map. However, major QTL has not been observed in the ‘T137’ linkage bin map, and we think it is because of the low density of the marker. Meanwhile, among the major QTL in the ‘L80’ linkage bin map, only the one bin marker ‘Chr6-3_4.8’ belonging to QTL ‘qFaFL7’ was located close to the physical position of the expansin genes. As the result of this study, we could show the potential of using a high-density linkage map for QTL analysis in strawberry and it is expected that the reliable marker of the QTL region observed in the ‘L80’ linkage bin map will be helpful in the firmness study of octoploid strawberry breeding. However, to be more accurate and reliable, functional study is necessary to identify
whether the gene associated with these markers affects strawberry firmness, and also it will be needed to phenotypic investigations of more diverse environments.
REFERENCES
Ahmadi, Hamid, and Royce S. Bringhurst. (1992) Breeding strawberries at the
decaploid level. Journal of the American Society for Horticultural Science, 117(5), 856-862.
Antanaviciute, L. (2016) Genetic mapping and phenotyping plant characteristics,
fruit quality and disease resistance traits in octoploid strawberry (Fragaria× ananassa) (Doctoral dissertation, University of Reading).
Balas, F., López-Corrales, M., Serradilla, M. J., Cai, L., Iezzoni, A., & Wünsch, A. (2017, June) Firmness QTL mapping using an'Ambrunés'×'Sweetheart'sweet
cherry population. In VIII International Cherry Symposium 1235 (pp. 41-46).
Barritt, B. H., & BH, B. (1979) BREEDING STRAWHERRIES FOR FRUIT
FIRMNESS.
Bassil, N. V., Davis, T. M., Zhang, H., Ficklin, S., Mittmann, M., Webster, T., Mahoney, L., Wood, D., Alperin, E. S., Rosyara, U. R., Putten, H. K. V., Monfort, A., Sargent, D. J., Amaya, I., Denoyes, B., Bianco, L., Dijk, T. V., Pirani, A., Amylezzoni, Main, D., Peace, C., Tang, T., Whitaker, V., Verma, S., Bellon, L., Brew, F., Herrera, R., & Weg, E. V. D. (2015) Development
and preliminary evaluation of a 90 K Axiom® SNP array for the allo-octoploid cultivated strawberry Fragaria× ananassa. BMC genomics, 16(1), 155.
Brummell, D. A., & Harpster, M. H. (2001) Cell wall metabolism in fruit softening
and quality and its manipulation in transgenic plants. In plant cell walls (pp. 311-340). Springer, Dordrecht.
Cao, K., Wang, L., Zhu, G., Fang, W., Chen, C., & Luo, J. (2012) Genetic
diversity, linkage disequilibrium, and association mapping analyses of peach (Prunus persica) landraces in China. Tree genetics & genomes, 8(5), 975-990.
Chaïb, J., Devaux, M. F., Grotte, M. G., Robini, K., Causse, M., Lahaye, M., & Marty, I. (2007) Physiological relationships among physical, sensory, and
morphological attributes of texture in tomato fruits. Journal of Experimental Botany, 58(8), 1915-1925.
Chapman, N. H., Bonnet, J., Grivet, L., Lynn, J., Graham, N., Smith, R., Sun, G., Walley, P. G., Poole, M., Causse, M., King, G. J., Baxter, C., & Seymour, G. B. (2012) High-resolution mapping of a fruit firmness-related quantitative
trait locus in tomato reveals epistatic interactions associated with a complex combinatorial locus. Plant Physiology, 159(4), 1644-1657.
Congiu L, Chicca M, Cella R, Rossi R, Bernacchia G. (2000) The use of random
amplified polymorphic DNA (RAPD) markers to identify strawberry varieties: a forensic application. Molecular Ecology 9:229–2325
Darrow, G. M. (1966) The strawberry. History, breeding and physiology. The
strawberry. History, breeding and physiology.
Davik, J., Sargent, D. J., Brurberg, M. B., Lien, S., Kent, M., & Alsheikh, M.
(2015) A ddRAD based linkage map of the cultivated strawberry, Fragaria x
ananassa. PLoS One, 10(9).
Davis, T. M., DiMeglio, L. M., Yang, R., Styan, S. M., & Lewers, K. S. (2006)
Assessment of SSR marker transfer from the cultivated strawberry to diploid strawberry species: functionality, linkage group assignment, and use in diversity analysis. J Am Soc Hortic Sci 131:506–512
De Givry, S., Bouchez, M., Chabrier, P., Milan, D., & Schiex, T. (2005)
CARHTA GENE: multipopulation integrated genetic and radiation hybrid mapping. Bioinformatics, 21(8), 1703-1704.
Degani, C., Rowland, L. J., Saunders, J. A., Hokanson, S. C., Ogden, E. L., Golan-Goldhirsh, A., & Galletta, G. J. (2001) A comparison of genetic
relationship measures in strawberry (Fragaria × ananassa Duch.) based on AFLPs, RAPDs, and pedigree data. Euphytica 117:1–12
DePristo, M. A., Banks, E., Poplin, R., Garimella, K. V., Maguire, J. R., Hartl, C., Philippakis, A. A., Angel, G. D., Rivas, M. A., Hanna, M., Mckenna, A., Fennell, T. J., Kernytsky, A. M., Sivachenko, A. Y., Cibulskis, K., Gabriel,
S. B., Altshuler, D., & Daly, M. J. (2011) A framework for variation discovery
and genotyping using next-generation DNA sequencing data. Nature Genetics, 43(5), 491.
Dotto, M. C., Martínez, G. A., & Civello, P. M. (2006) Expression of expansin
genes in strawberry varieties with contrasting fruit firmness. Plant Physiology and Biochemistry, 44(5-6), 301-307.
Døving, A., & Måge, F. (2002) Methods of testing strawberry fruit firmness. Acta
Agriculturae Scandinavica, Section B-Plant Soil Science, 52(1), 43-51.
Duvetter, T., Fraeye, L., Hoang, T. V., Buggenhout, S. V., Verlent, L., Smout, C., Loey, A. V., Hendrickx, M. (2006) Effect of pectinmethylesterase infusion
methods and processing techniques on strawberry firmness. Journal of food science, 70(6), s383-s388.
Edger, P. P., Poorten, T. J., VanBuren, R., Hardigan, M. A., Colle, M., McKain, M. R., Smith, R. D., Teresi, S. J., Nelson, A. D. L., Wai, C. M., Alger, E. I., Bird, K. A., Yocca, A. E., Pumplin, N., Ou, S., Ben-Zvi, G., Brodt, A., Baruch, K., Swale, T., Shiue, L., Acharya, C. B., Cole, G. S., Mower, J. P., Childs, K. L., Jiang, N., Lyons, E., Freeling, M., Puzey, J. R., & Knapp, S. J. (2019) Origin and evolution of the octoploid strawberry genome. Nature
Genetics, 51(3), 541-547.
Edger, P. P., VanBuren, R., Colle, M., Poorten, T. J., Wai, C. M., Niederhuth, C. E., Callow, P., Mckain, M. R., Shi, J., Collier, C., Xiong, Z., Mower, J. P., Slovin, J. P., Hytönen, T., Jiang, N., Childs, K. L., & Knapp, S. J. (2018)
Single-molecule sequencing and optical mapping yields an improved genome of woodland strawberry (Fragaria vesca) with chromosome-scale contiguity. Gigascience, 7(2), gix124.
Folta, K. M., & Davis, T. M. (2006) Strawberry genes and genomics. Critical
Reviews in Plant Sciences, 25(5), 399-415.
Giampieri, F., Alvarez-Suarez, J. M., & Battino, M. (2014) Strawberry and
Food Chemistry, 62(18), 3867-3876.
Gidoni D, Rom M, Kunik T, Zur M, Izsak E, Izhar S, Firon N. (1994)
Strawberry-cultivar Identification using randomly amplified polymorphic DNA (RAPD) markers. Plant Breed 113:339–342
Han, K., Lee, H. Y., Ro, N. Y., Hur, O. S., Lee, J. H., Kwon, J. K., & Kang, B. C. (2018) QTL mapping and GWAS reveal candidate genes controlling
capsaicinoid content in Capsicum. Plant Biotechnology Journal, 16(9), 1546-1558.
Hardigan, M. A., Feldmann, M. J., Lorant, A., Famula, R., Acharya, C., Cole, G., Edger, P. P., & Knapp, S. J. (2019) Chromosome evolution of octoploid
strawberry. BioRxiv, 861526.
Hirakawa, H., Shirasawa, K., Kosugi, S., Tashiro, K., Nakayama, S., Yamada, M., Kohara, M., Watanabe, A., Kishida, Y., Fujishiro, T., Tsuruoka, H., Minami, C., Sasamoto, S., Kato, M., Nanri, K., Komaki, A., Yanagi, T., Huoxin, Q., Maeda, J., Ishikawa, M., Kuhara, S., Sato, S., Tabata, S., & Isobe, S. N. (2014) Dissection of the octoploid strawberry genome by deep
sequencing of the genomes of Fragaria species. DNA Research, 21(2), 169-181.
Harrison, E. P., McQueen-Mason, S. J., Manning, K. (2001) Expression of six
expansin genes in relation to extension activity in developing strawberry fruit. Journal of Experimental Botany, 52(360), 1437-1446.
Hummer, K. E., & Hancock, J. (2009) Strawberry genomics: botanical history,
cultivation, traditional breeding, and new technologies. In Genetics and genomics of Rosaceae (pp. 413-435). Springer, New York, NY.
Ichijima, K. (1926) Cytological and genetic studies on Fragaria. Genetics, 11(6),
590.
Jiang, G. L. (2013) Molecular markers and marker-assisted breeding in plants. Plant
breeding from laboratories to fields, 45-83.
López-Aranda, J. M., Valpuesta, V., Pliego-Alfaro, F., Quesada, M. A., Mercado, J. A. (2002) Manipulation of strawberry fruit softening by antisense
expression of a pectate lyase gene. Plant physiology, 128(2), 751-759.
Kenis, K., Keulemans, J., & Davey, M. W. (2008) Identification and stability of
QTL for fruit quality traits in apple. Tree Genetics & Genomes, 4(4), 647-661.
Khanizadeh, S., DeEll, J., Cousineau, J., & Lagrave, I. (1998, August)
Comparison of three methods to evaluate fruit firmness in advanced strawberry selections. In XXV International Horticultural Congress, Part 7: Quality of Horticultural Products 517 (pp. 463-466).
Koskela, E. A., Sønsteby, A., Flachowsky, H., Heide, O. M., Hanke, M. V., Elomaa, P., & Hytönen, T. (2016) TERMINAL FLOWER 1 is a breeding
target for a novel everbearing trait and tailored flowering responses in cultivated strawberry (Fragaria× ananassa Duch.). Plant Biotechnology Journal, 14(9), 1852-1861.
Lerceteau-Köhler E, Guerin G, Laigret F, Denoyes-Rothan B. (2003)
Characterization of mixed disomic and polysomic inheritance in the octoploid strawberry (Fragaria × ananassa) using AFLP mapping. Theoretical and Applied Genetics, 107:619–628
Lerceteau-Köhler, E., Moing, A., Guérin, G., Renaud, C., Petit, A., Rothan, C., & Denoyes, B. (2012) Genetic dissection of fruit quality traits in the octoploid
cultivated strawberry highlights the role of homoeo-QTL in their control. Theoretical and Applied Genetics, 124(6), 1059-1077.
Li, H., & Durbin, R. (2009) Fast and accurate short read alignment with Burrows–
Wheeler transform. Bioinformatics, 25(14), 1754-1760.
Li, H., Handsaker, B., Wysoker, A., Fennell, T., Ruan, J., Homer, N., Marth, G., Abecasis, G., & Durbin, R. (2009) The sequence alignment/map format and
SAMtools. Bioinformatics, 25(16), 2078-2079.
Liu, L., Ji, M. L., Chen, M., Sun, M. Y., Fu, X. L., Li, L., Gao, D. S., & Zhu, C. Y. (2016) The flavor and nutritional characteristic of four strawberry varieties
cultured in soilless system. Food Science & Nutrition, 4(6), 858-868.
Luciano Da Costa, E. S., Wang, S., & Zeng, Z. B. (2012) Composite interval
mapping and multiple interval mapping: procedures and guidelines for using Windows QTL Cartographer. In Quantitative trait loci (QTL) (pp. 75-119). Humana Press.
Mathey, M. M. (2013) Phenotyping diverse strawberry (Fragaria spp.) germplasm
for aid in marker-assisted breeding, and marker-trait association for red stele (Phytophthora fragariae) resistance marker Rpf1.
Ming, R., & Wai, C. M. (2015) Assembling allopolyploid genomes: no longer
formidable. Genome Biology, 16(1), 27.
Mora, F., Zúñiga, P. E., & Figueroa, C. R. (2019) Genetic variation and trait
correlations for fruit weight, firmness and color parameters in wild accessions of Fragaria chiloensis. Agronomy, 9(9), 506.
Moreno, E., Obando, J. M., Dos-Santos, N., Fernández-Trujillo, J. P., Monforte, A. J., & Garcia-Mas, J. (2008) Candidate genes and QTL for fruit ripening
and softening in melon. Theoretical and Applied Genetics, 116(4), 589-602.
Moumouni, K. H., Kountche, B. A., Jean, M., Hash, C. T., Vigouroux, Y., Haussmann, B. I. G., & Belzile, F. (2015) Construction of a genetic map for
pearl millet, Pennisetum glaucum (L.) R. Br., using a genotyping-by-sequencing (GBS) approach. Molecular breeding, 35(1), 5.
Posé, S., García-Gago, J. A., Santiago-Doménech, Nieves., Pliego-Alfaro, F., Quesada, M. A., Mercado, F. A. (2011) Strawberry fruit softening: role of cell
wall disassembly and its manipulation in transgenic plants. Genes, Genomes and Genomics, 5(1), 40-48.
Potter, D., Eriksson, T., Evans, R. C., Oh, S., Smedmark, J. E. E., Morgan, D. R., Kerr, M., Robertson, K. R., Arsenault, M., Dickinson, T. A., & Campbell, C. S. (2007) Phylogeny and classification of Rosaceae. Plant
Systematics and Evolution 266:5–43
J. L., & Kulakow, P. A. (2014) High-resolution mapping of resistance to
cassava mosaic geminiviruses in cassava using genotyping-by-sequencing and its implications for breeding. Virus Research, 186, 87-96.
Rho, I. R., Woo, J. G., Jeong, H. J., Jeon, H. Y., & Lee, C. H. (2012)
Characteristics of F1 hybrids and inbred lines in octoploid strawberry (Fragaria× ananassa Duchesne). Plant Breeding, 131(4), 550-554.
Saladié, M., Matas, A. J., Isaacson, T., Jenks, M. A., Goodwin, S. M., Niklas, K. J., Xiaolin, R., Labavitch, J. M., Shackel, K. A., Fernie, A. R., Lytovchenko, A., O'Neill, M. A., Watkins, C. B., & Rose, J. K. C. (2007) A reevaluation of
the key factors that influence tomato fruit softening and integrity. Plant Physiology, 144(2), 1012-1028.
Sánchez-Sevilla JF, Horvath A, Botella MA, Gaston A, Folta K, Kilian A, Denoyes B., & Amaya I. (2015) Diversity Arrays Technology (DArT) marker
platforms for diversity analysis and linkage mapping in a complex crop, the octoploid cultivated strawberry (Fragaria × ananassa). PLoS ONE 10:e0144960
Scheerens, J. C., & Brenneman, G. L. (1991) Fruit quality patterns among
strawberry cultivars based on decade of release or area of adaptation. The strawberry into the 21st century. Timber Press, Portland, Ore, 111-114.3
Shulaev, V., Sargent, D. J., Crowhurst, R. N., Mockler, T. C., Folkerts, O., Delcher, A. L., Jaiswal, P., Mockaitis, K., Liston, A., Mane, S. P., Burns, P., Davis, T. M., Slovin, J. P., Bassil, N., Hellens, R. P., Evans, C., Harkins, T., Kodira, C., Desany, B., Crasta, O. R., Jensen, R. V., Allan, A. C., Michael, T. P., Setubal, J. C., Celton, J. M., Rees, D. J. G., Williams, K. P., Holt, S. H., Rojas, J. J. R., Chatterjee, M., Liu, B., Silva, H., Meisel, L., Adato, A., Filichkin, S. A., Troggio, M., Viola, R., Ashman, T. L., Wang, H., Dharmawardhana, P., Elser, J., Raja, R., Priest, H. D., Jr, D. W. B., Fox, S. E., Givan, S. A., Wilhelm, L. J., Naithani, S., Christoffels, A., Salama, D. Y., Carter, J., Girona, E. L., Zdepski, A., Wang, W., Kerstetter, R. A.,
Schwab, W., Korban, S. S., Davik, J., Monfort, A., Denoyes-Rothan, B., Arus, P., Mittler, R. Flinn, B., Aharoni, A., Bennetzen, J. L., Salzberg, S. L., Dickerman, A. W., Velasco, R., Borodovsky, M., Veilleux, R. E., & Folta, K. M. (2011) The genome of woodland strawberry (Fragaria vesca). Nature
Genetics, 43(2), 109.
Tang, H., Zhang, X., Miao, C., Zhang, J., Ming, R., Schnable, J. C., Schnable, P. S., Lyons, E., & Lu, J. (2015) ALLMAPS: robust scaffold ordering based
on multiple maps. Genome Biology, 16(1), 3.
Tennessen, J. A., Govindarajulu, R., Ashman, T. L., & Liston, A. (2014)
Evolutionary origins and dynamics of octoploid strawberry subgenomes revealed by dense targeted capture linkage maps. Genome Biology and Evolution, 6(12), 3295-3313.
Truong, H. T., Ramos, A. M., Yalcin, F., de Ruiter, M., van der Poel, H. J., Huvenaars, K. H., Hogers, R. C. J., Enckevort, L. J. G. V., Janssen, A.,Orsouw, N. J. V., & van Eijk, M. J. (2012) Sequence-based genotyping for
marker discovery and co-dominant scoring in germplasm and populations. PloS one, 7(5).
Vining, K. J., Salinas, N., Tennessen, J. A., Zurn, J. D., Sargent, D. J., Hancock, J., & Bassil, N. V. (2017) Genotyping-by-sequencing enables linkage mapping
in three octoploid cultivated strawberry families. PeerJ 5:e3731.
Voorrips, R. E. (2002) MapChart: software for the graphical presentation of linkage
maps and QTLs. Journal of Heredity, 93(1), 77-78.
Zorrilla-Fontanesi, Y., Cabeza, A., Domínguez, P., Medina, J. J., Valpuesta, V., Denoyes-Rothan, B., Sánchez-Sevilla, J. F., & Amaya, I. (2011) Quantitative
trait loci and underlying candidate genes controlling agronomical and fruit quality traits in octoploid strawberry (Fragaria× ananassa). Theoretical and Applied Genetics, 123(5), 755-778.

![Table 5. Summary of QTL for firmness in ‘L80’ population [o11] . QTL Chromosome Location (cM) LOD R 2 (%) Additive effect Dominant effect Location(Mb) qFaFL1 Chr1-2 90.7-98.2 3.6 16.0 0.1858 0.5497 11.1-16.3 qFaFL2 Chr1-4 84.6-87.9 2.8 28.4 0.6971 0.6545 2](https://thumb-ap.123doks.com/thumbv2/123dokinfo/4721332.9162/37.799.130.681.215.788/summary-firmness-population-chromosome-location-additive-dominant-location.webp)
![Table 6. Summary of QTL for firmness in ‘T137’ population [o12]](https://thumb-ap.123doks.com/thumbv2/123dokinfo/4721332.9162/38.799.126.696.220.562/table-summary-qtl-firmness-t-population-o.webp)