R E S E A R C H A R T I C L E
Open Access
Novel biomarker-based model for the
prediction of sorafenib response and
overall survival in advanced hepatocellular
carcinoma: a prospective cohort study
Hwi Young Kim
1†, Dong Hyeon Lee
2,3†, Jeong-Hoon Lee
2,4*, Young Youn Cho
2, Eun Ju Cho
2, Su Jong Yu
2,
Yoon Jun Kim
2and Jung-Hwan Yoon
2Abstract
Background: Prediction of the outcome of sorafenib therapy using biomarkers is an unmet clinical need in patients with advanced hepatocellular carcinoma (HCC). The aim was to develop and validate a biomarker-based model for predicting sorafenib response and overall survival (OS).
Methods: This prospective cohort study included 124 consecutive HCC patients (44 with disease control, 80 with progression) with Child-Pugh class A liver function, who received sorafenib. Potential serum biomarkers (namely, hepatocyte growth factor [HGF], fibroblast growth factor [FGF], vascular endothelial growth factor receptor-1, CD117, and angiopoietin-2) were tested. After identifying independent predictors of tumor response, a risk scoring system for predicting OS was developed and 3-fold internal validation was conducted.
Results: A risk scoring system was developed with six covariates: etiology, platelet count, Barcelona Clinic Liver Cancer stage, protein induced by vitamin K absence-II, HGF, and FGF. When patients were stratified into low-risk (score≤ 5), intermediate-risk (score 6), and high-risk (score≥ 7) groups, the model provided good discriminant functions on tumor response (concordance [c]-index, 0.884) and 12-month survival (area under the curve [AUC], 0.825). The median OS was 19.0, 11.2, and 6.1 months in the low-, intermediate-, and high-risk group, respectively (P < 0.001). In internal validation, the model maintained good discriminant functions on tumor response (c-index, 0.825) and 12-month survival (AUC, 0. 803), and good calibration functions (allP > 0.05 between expected and observed values).
Conclusions: This new model including serum FGF and HGF showed good performance in predicting the response to sorafenib and survival in patients with advanced HCC.
Keywords: Hepatocellular carcinoma, Sorafenib, Response, Biomarker, Prediction
* Correspondence:[email protected];[email protected]
* The abstract of the present study was presented as a poster at the Liver Meeting 2016 (the 67th Annual Meeting of the American Association for the Study of Liver Diseases) (Kim HY, Lee DH, Cho EJ, Yu SJ, Kim YJ, Yoon J-H, Lee J-H: A Novel Biomarker-Based Model for the Prediction of Response to Sorafenib and Overall Survival for Advanced Hepatocellular Carcinoma: A Prospective Cohort Study. In: HEPATOLOGY: 2016: WILEY 111 RIVER ST, HOBOKEN 07030–5774, NJ USA; 2016: 634A-634A.).
†Equal contributors 2
Department of Internal Medicine and Liver Research Institute, Seoul National University College of Medicine, Seoul, Republic of Korea
4Department of Internal Medicine, Seoul National University Hospital, 101,
Daehak-ro, Jongno-gu, Seoul 03080, Republic of Korea Full list of author information is available at the end of the article
© The Author(s). 2018 Open Access This article is distributed under the terms of the Creative Commons Attribution 4.0 International License (http://creativecommons.org/licenses/by/4.0/), which permits unrestricted use, distribution, and reproduction in any medium, provided you give appropriate credit to the original author(s) and the source, provide a link to the Creative Commons license, and indicate if changes were made. The Creative Commons Public Domain Dedication waiver (http://creativecommons.org/publicdomain/zero/1.0/) applies to the data made available in this article, unless otherwise stated.
Background
Sorafenib is an oral multikinase inhibitor targeting the receptor tyrosine kinase activity of VEGF receptors (VEGFR 1–3), PDGFRb, serine-threonine kinases Raf-1 and B-Raf, c-KIT, and RET [1–3]. Sorafenib therapy pro-longed overall survival (OS) with acceptable safety and tolerability in patients with advanced HCC in the SHARP (Sorafenib Hepatocellular Carcinoma Assess-ment Randomized Protocol) trial and the Asia-Pacific study [4,5]. Based on these two phase III trials, sorafe-nib therapy is currently the standard of care for patients with advanced-stage or Barcelona Clinic Liver Cancer (BCLC) stage C HCC and for patients in the control arm of ongoing clinical trials [6, 7]. However, consider-ing the various adverse effects, incomplete response, modest survival benefit and cost of sorafenib therapy, the necessity of predictive biomarkers has been con-stantly raised, to select patients who could benefit most from this treatment [8].
Cancer biomarkers have been widely used for the predic-tion of the natural course, prognosis, and treatment response in certain malignancies [9]. Predictive biomarkers can be best explored in the setting of properly designed clinical trials [10]. Baseline plasma angiopoietin 2 and vas-cular endothelial growth factor (VEGF) were identified as independent predictors of survival in the SHARP study; however, no biomarker was predictive of sorafenibresponse [11]. Because the diagnosis of HCC is usually made without obtaining tumor tissue, serum biomarkers for the predic-tion of sorafenib response would be of significant benefit for proper selection of patients [12]. Furthermore, there has been no attempt to date to integrate potential serum markers and other relevant clinical characteristics for a response prediction model as an approach toward precision medicine in patients with advanced HCC.
This exploratory study aimed (i) to develop a novel relevant predictive model using a serum biomarker for the prediction of sorafenib response, (ii) to validate this model internally, and (iii) to determine its role in pre-dicting outcome in a prospectively collected database from a large-scale in-hospital cohort.Specifically, we chose analytes for serum biomarker analysis on the basis of the molecular targets (or ligands of those targeted receptors) of sorafenib or those related to the outcome and/or pathogenesis of HCC, including VEGF [11], platelet-derived growth factor receptor β (PDGFRb) [2], CD117 [1], hepatocyte growth factor (HGF) [13], angio-poietin 2 [11], lysyl oxidase-like 2 (LOXL2) [14], and basic fibroblast growth factor (bFGF) [15].
Methods
Patients
Between May 2013 and June 2015, a total of 460 con-secutive patients who had a diagnosis of HCC and
received sorafenib were identified in a prospective HCC cohort registry of Seoul National University Hospital. Written informed consent was obtained from each pa-tient before registration in the cohort. The diagnosis of HCC was based on histological examination or clinico-radiological criteria, with reference to the practice guide-lines from the American Association for the Study of Liver Diseases or the European Association for the Study of the Liver [6, 7]. All patients were not indicated for surgical resection, liver transplantation, local ablation, or transarterial chemoembolization at the time of initiation of sorafenib therapy because of their advanced stages at the time of diagnosis or tumor progression despite prior (repeated) locoregional treatments. Among these 460 pa-tients, adequate blood samples were obtained from 161 patients for serum biomarker analyses. Patients with Child-Pugh score≥ 7 (n = 37) were excluded because the outcome assessment of sorafenib therapy in these pa-tients could be misleading, owing to increased risk of mortality from their impaired liver function [16]. Finally, 124 patients were included in the analysis.
The protocol of the present study conformed to the ethical guidelines of the World Medical Association Declaration of Helsinki, and was approved by the Institu-tional Review Board of Seoul NaInstitu-tional University Hospital (IRB No. 0506–150-005). All study participants provided written informed consent. REMARK (Reporting Recom-mendations for Tumor Marker Prognostic Studies) cri-teria were followed throughout this study [17].
Treatment scheme and response evaluation
The standard daily oral dose of sorafenib (Nexavar; Bayer HealthCare AG, Leverkusen, Germany) was 800 mg (i.e., 400 mg twice daily) on a continuous dosing schedule. Follow-up evaluation schedules included (i) clinical examination (toxicity assessment and blood tests) 2 weeks after the first administration of sorafenib and every 4 weeks thereafter, and (ii) imaging tests (con-trast-enhanced dynamic computed tomography or mag-netic resonance imaging) every 6–8 weeks until death or the last follow-up. Dose reduction was allowed in cases of drug-related grade 3 or 4 toxicities. The toxicity grade was assessed before each treatment cycle using the National Cancer Institute Common Toxicity Criteria for Adverse Events (version 4.0). We used three-step dose reduction as follows: 800 mg daily to 600 mg daily, 600 mg daily to 400 mg daily, and 400 mg daily to 400 mg every other day. Treatment response was evalu-ated every 6–8 weeks, according to the modified Response Evaluation Criteria in Solid Tumors criteria using contrast-enhanced dynamic computed tomography or magnetic resonance imaging [18]. Sorafenib therapy was discontinued if one or more of the following
occurred: disease progression, development of intoler-able toxicity, or patient refusal.
Sample collection and biomarker assays
A 5-mL blood sample was collected from each study participant at baseline (before the initiation of sorafenib therapy), and was centrifuged at 1500 rpm for 15 min to separate the serum. The serum samples were then stored at≤ − 70 °C in 1.5-mL aliquots until further assays.
The serum concentrations of biomarkers were mea-sured with commercially available ELISA kits for angio-poietin 2 (R&D Systems, Minneapolis, MN, USA), VEGF (eBioscience, San Diego, CA, USA), PDGFRb (Raybiotech, Norcross, GA, USA), HGF (R&D Systems), CD117 (R&D Systems), LOXL2 (USCN Life Science, Wuhan, China), and bFGF (R&D Systems).
Statistical analysis
For baseline characteristics, continuous variables are expressed as medians and ranges, and categorical vari-ables as frequencies with percentages. Survival analysis was performed using the Kaplan-Meier method from the date of initial diagnosis of HCC to the date of death or last follow-up, with the log-rank test to compare sub-groups. Single binary logistic regression analysis was used to identify relevant features associated with re-sponse to sorafenib, in which variables withP < 0.1 were subsequently included in the multivariate analysis. The selected variables for logistic regression analysis included clinical characteristics, laboratory parameters, serum biomarkers, and hepatic fibrosis indices [19–22]. For-ward and backFor-ward stepwise selection procedures were sequentially used to select the best-fitted model on the basis of the Akaike information criterion [23]. In the final model, scores (0, 1, 2) were assigned to the corre-sponding levels of categorical covariates. For continuous covariates, scores were assigned to the corresponding subranges within cutoff values, to maximize the con-cordance index (c-index). Hence, the risk score for the prediction of sorafenib response was calculated in each patient through the summation of the scores of the covariates in the final prediction model. Patients were further categorized into subgroups according to their predictive scores. For an internal validation of the pre-dictive model, a 3-fold cross-validation was performed. Calibration function was examined by comparing the observed response with the expected response estimated with the risk score, using the Hosmer-Lemeshow test. In addition, survival prediction was performed among sub-groups according to the risk scores, with internal valid-ation and examinvalid-ation of calibrvalid-ation function, in the same manner as that for the response prediction.
All tests were based on a two-sided probability, and P < 0.05 was considered statistically significant. All
statistical analyses were performed with R language ver. 3.1.1 (R Foundation for Statistical Computing, Vienna, Austria).
Results
Patient characteristics and treatment outcomes
Table 1 summarizes the baseline characteristics of the enrolled patients according to their best objective responses to sorafenib, i.e., progressive disease (PD) vs. non-PD. During the treatment period (median, 2.6 months; interquartile range, 1.4–3.8 months), 44 patients had no disease progression (non-PD group: complete response, 2 patients; partial response, 10 patients; and stable disease, 32 patients) and 80 patients had disease progression (PD group). The median time to progression was 2.7 months (95% confidence interval [CI], 2.4–3.1). The main underlying cause of liver disease was hepatitis B infection (59.1% in the non-PD group, 81.2% in the PD group). There was no significant differ-ence in the frequencies of macrovascular invasion or extrahepatic spread and baseline Child-Pugh score between the two groups. Platelet count was significantly lower in the PD group than in the non-PD group (P = 0.006). Of the baseline tumor markers, PIVKA-II (protein induced by vitamin K absence-II) was significantly higher in the PD group than in the non-PD group (P = 0.003), unlike alpha-fetoprotein (P = 0.187). Among the serum biomarkers, only bFGF was significantly higher in the PD group than in the non-PD group (P < 0.001).
The median follow-up duration was 6.6 months (inter-quartile range, 4.3–12.1 months) and OS was 11.2 months (95% CI, 9.4–13.7).
Development of a scoring system for the prediction of sorafenib response
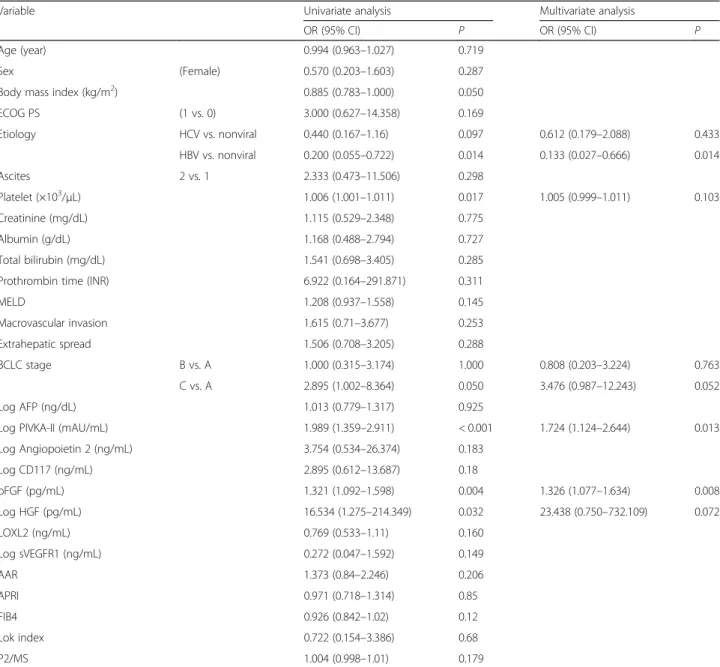
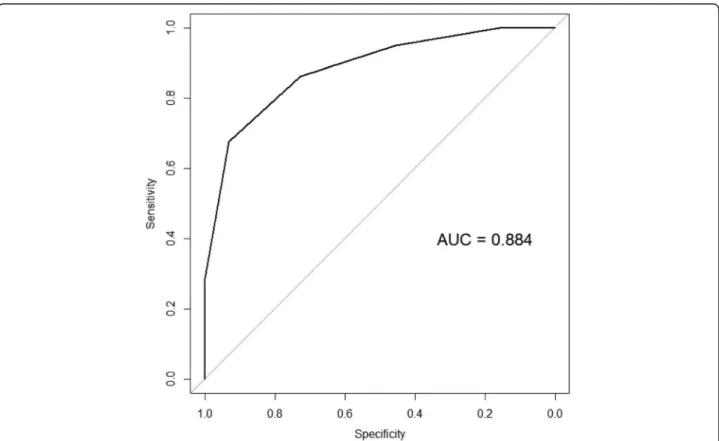
From the single binary logistic regression analysis, variables with P < 0.1 were first selected for multivariate analysis, including etiology, platelet count, PIVKA-II, bFGF, macrovascular invasion, extrahepatic spread, BCLC stage, and log HGF (Table 2). Among these variables, multivariate logistic regression analysis with forward stepwise selection process identified six vari-ables for the final model (Table 2), which included four tumor-related factors (BCLC stage, bFGF, log PIVKA-II, and log HGF) and two liver disease-related factors (etiology and platelets). The risk scoring system for the prediction of sorafenib response was generated using these six covariates, in which a score of 0, 1, or 2 was given to each cutoff value of the six covariates (Table3). The risk score for each patient was calculated through the summation of the scores of the six covariates, and the scores ranged from 0 to 12. Sorafenib response was expected to be PD if the risk score was > 6, showing maximal sensitivity and specificity with this cutoff level
(Fig.1). When all patients were stratified into the low-risk group (risk score≤ 5; n = 43), intermediate-risk group (risk score 6,n = 24), and high-risk group (risk score ≥ 7, n = 57), the model provided good discriminant functions on sorafe-nib response (c-index, 0.884; 95% CI, 0.827–0.941). In the internal validation with 3-fold cross-validation, the model maintained good discriminant functions on tumor response
(c-index, 0.825; 95% CI, 0.745–0.906), and the Hosmer-Lemeshow P-value for the calibration function of the risk score was 0.945.
Effect of the sorafenib response score on the OS
Median OS duration was 19.0 months in the low-risk group (95% CI, 16.1–not available [N/A]), 11.2 months
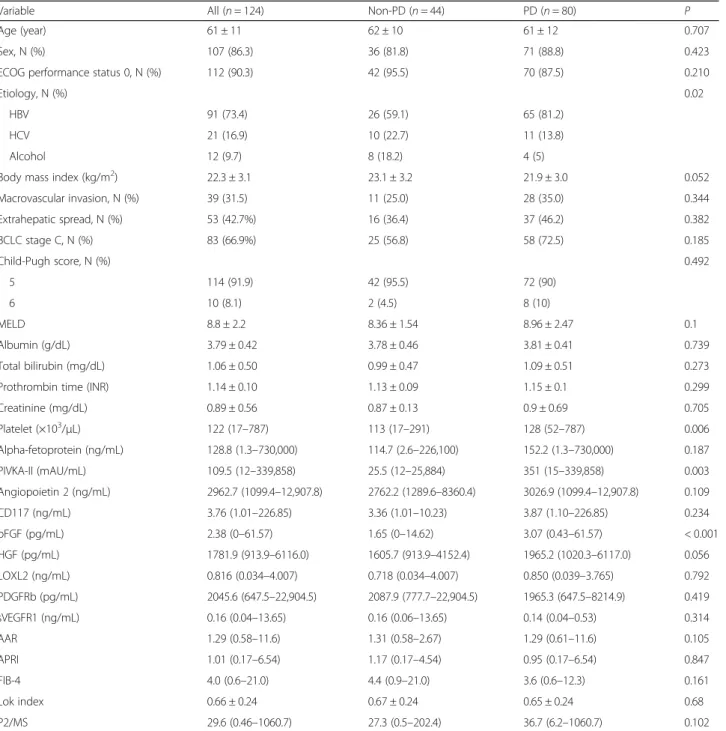
Table 1 Baseline characteristics according to the sorafenib response
Variable All (n = 124) Non-PD (n = 44) PD (n = 80) P
Age (year) 61 ± 11 62 ± 10 61 ± 12 0.707
Sex, N (%) 107 (86.3) 36 (81.8) 71 (88.8) 0.423
ECOG performance status 0, N (%) 112 (90.3) 42 (95.5) 70 (87.5) 0.210
Etiology, N (%) 0.02
HBV 91 (73.4) 26 (59.1) 65 (81.2)
HCV 21 (16.9) 10 (22.7) 11 (13.8)
Alcohol 12 (9.7) 8 (18.2) 4 (5)
Body mass index (kg/m2) 22.3 ± 3.1 23.1 ± 3.2 21.9 ± 3.0 0.052
Macrovascular invasion, N (%) 39 (31.5) 11 (25.0) 28 (35.0) 0.344 Extrahepatic spread, N (%) 53 (42.7%) 16 (36.4) 37 (46.2) 0.382 BCLC stage C, N (%) 83 (66.9%) 25 (56.8) 58 (72.5) 0.185 Child-Pugh score, N (%) 0.492 5 114 (91.9) 42 (95.5) 72 (90) 6 10 (8.1) 2 (4.5) 8 (10) MELD 8.8 ± 2.2 8.36 ± 1.54 8.96 ± 2.47 0.1 Albumin (g/dL) 3.79 ± 0.42 3.78 ± 0.46 3.81 ± 0.41 0.739 Total bilirubin (mg/dL) 1.06 ± 0.50 0.99 ± 0.47 1.09 ± 0.51 0.273
Prothrombin time (INR) 1.14 ± 0.10 1.13 ± 0.09 1.15 ± 0.1 0.299
Creatinine (mg/dL) 0.89 ± 0.56 0.87 ± 0.13 0.9 ± 0.69 0.705 Platelet (×103 /μL) 122 (17–787) 113 (17–291) 128 (52–787) 0.006 Alpha-fetoprotein (ng/mL) 128.8 (1.3–730,000) 114.7 (2.6–226,100) 152.2 (1.3–730,000) 0.187 PIVKA-II (mAU/mL) 109.5 (12–339,858) 25.5 (12–25,884) 351 (15–339,858) 0.003 Angiopoietin 2 (ng/mL) 2962.7 (1099.4–12,907.8) 2762.2 (1289.6–8360.4) 3026.9 (1099.4–12,907.8) 0.109 CD117 (ng/mL) 3.76 (1.01–226.85) 3.36 (1.01–10.23) 3.87 (1.10–226.85) 0.234 bFGF (pg/mL) 2.38 (0–61.57) 1.65 (0–14.62) 3.07 (0.43–61.57) < 0.001 HGF (pg/mL) 1781.9 (913.9–6116.0) 1605.7 (913.9–4152.4) 1965.2 (1020.3–6117.0) 0.056 LOXL2 (ng/mL) 0.816 (0.034–4.007) 0.718 (0.034–4.007) 0.850 (0.039–3.765) 0.792 PDGFRb (pg/mL) 2045.6 (647.5–22,904.5) 2087.9 (777.7–22,904.5) 1965.3 (647.5–8214.9) 0.419 sVEGFR1 (ng/mL) 0.16 (0.04–13.65) 0.16 (0.06–13.65) 0.14 (0.04–0.53) 0.314 AAR 1.29 (0.58–11.6) 1.31 (0.58–2.67) 1.29 (0.61–11.6) 0.105 APRI 1.01 (0.17–6.54) 1.17 (0.17–4.54) 0.95 (0.17–6.54) 0.847 FIB-4 4.0 (0.6–21.0) 4.4 (0.9–21.0) 3.6 (0.6–12.3) 0.161 Lok index 0.66 ± 0.24 0.67 ± 0.24 0.65 ± 0.24 0.68 P2/MS 29.6 (0.46–1060.7) 27.3 (0.5–202.4) 36.7 (6.2–1060.7) 0.102
Values are expressed as mean ± standard deviation, medians (ranges), or frequencies (percentages)
Abbreviations: PD, progressive disease, ECOG Eastern Cooperative Oncology Group, HBV hepatitis B virus, HCV hepatitis C virus, BCLC Barcelona Clinic Liver Cancer, MELD model for end-stage liver disease, INR international normalized ratio, PIVKA-II protein induced by vitamin K absence-II, Ang2 angiopoietin-2, bFGF basic fibroblast growth factor, HGF hepatocyte growth factor, LOXL2 lysyl oxidase-like 2, PDGFRb platelet-derived growth factor receptorβ, sVEGFR1 soluble vascular endothelial growth factor receptor-1, AAR aspartate aminotransferase/alanine aminotransferase ratio, APRI aspartate aminotransferase to platelet ratio index, FIB-4 fibrosis 4
in the intermediate-risk group (95% CI, 8.5–N/A), and 6.1 months in the high-risk group (95% CI, 5.0–8.1) (P < 0.001, Fig. 2). Univariate Cox proportional haz-ards analysis with the above-mentioned risk scoring system showed a significant difference between group A and group C (P < 0.001, Table 4). The area under the receiver-operating curve for OS prediction was 0.825 (95% CI, 0.734–0.915) at 12 months. In the in-ternal validation with 3-fold cross-validation, the area under the receiver-operating curve for OS prediction at 12 months was 0.803 (95% CI, 0.699–0.907). The
Hosmer-Lemeshow P-value for the calibration func-tion of the risk score was 0.207.
Discussion
We developed a new prediction model for sorafenib response that combines relevant serum markers, tumor-related factors, and cirrhosis-tumor-related factors in a scoring system. The risk score showed good performance in pre-dicting the response to sorafenib and survival in patients with advanced HCC in our cohort. The robustness of
Table 2 Binary logistic regression analysis for sorafenib response
Variable Univariate analysis Multivariate analysis
OR (95% CI) P OR (95% CI) P
Age (year) 0.994 (0.963–1.027) 0.719
Sex (Female) 0.570 (0.203–1.603) 0.287
Body mass index (kg/m2) 0.885 (0.783–1.000) 0.050
ECOG PS (1 vs. 0) 3.000 (0.627–14.358) 0.169 Etiology HCV vs. nonviral 0.440 (0.167–1.16) 0.097 0.612 (0.179–2.088) 0.433 HBV vs. nonviral 0.200 (0.055–0.722) 0.014 0.133 (0.027–0.666) 0.014 Ascites 2 vs. 1 2.333 (0.473–11.506) 0.298 Platelet (×103/μL) 1.006 (1.001–1.011) 0.017 1.005 (0.999–1.011) 0.103 Creatinine (mg/dL) 1.115 (0.529–2.348) 0.775 Albumin (g/dL) 1.168 (0.488–2.794) 0.727 Total bilirubin (mg/dL) 1.541 (0.698–3.405) 0.285
Prothrombin time (INR) 6.922 (0.164–291.871) 0.311
MELD 1.208 (0.937–1.558) 0.145 Macrovascular invasion 1.615 (0.71–3.677) 0.253 Extrahepatic spread 1.506 (0.708–3.205) 0.288 BCLC stage B vs. A 1.000 (0.315–3.174) 1.000 0.808 (0.203–3.224) 0.763 C vs. A 2.895 (1.002–8.364) 0.050 3.476 (0.987–12.243) 0.052 Log AFP (ng/dL) 1.013 (0.779–1.317) 0.925
Log PIVKA-II (mAU/mL) 1.989 (1.359–2.911) < 0.001 1.724 (1.124–2.644) 0.013
Log Angiopoietin 2 (ng/mL) 3.754 (0.534–26.374) 0.183 Log CD117 (ng/mL) 2.895 (0.612–13.687) 0.18 bFGF (pg/mL) 1.321 (1.092–1.598) 0.004 1.326 (1.077–1.634) 0.008 Log HGF (pg/mL) 16.534 (1.275–214.349) 0.032 23.438 (0.750–732.109) 0.072 LOXL2 (ng/mL) 0.769 (0.533–1.11) 0.160 Log sVEGFR1 (ng/mL) 0.272 (0.047–1.592) 0.149 AAR 1.373 (0.84–2.246) 0.206 APRI 0.971 (0.718–1.314) 0.85 FIB4 0.926 (0.842–1.02) 0.12 Lok index 0.722 (0.154–3.386) 0.68 P2/MS 1.004 (0.998–1.01) 0.179
Abbreviations: OR odds ratio, CI confidence interval, ECOG PS Eastern Cooperative Oncology Group performance status, HBV hepatitis B virus, HCV hepatitis C virus, BCLC Barcelona Clinic Liver Cancer, MELD model for end-stage liver disease, INR international normalized ratio, AFP alpha-fetoprotein, PIVKA-II protein induced by vitamin K absence-II, Ang2 angiopoietin-2, bFGF basic fibroblast growth factor, HGF hepatocyte growth factor, LOXL2 lysyl oxidase-like 2, PDGFRb platelet-derived growth factor receptorβ, sVEGFR1 soluble vascular endothelial growth factor receptor-1, AAR aspartate aminotransferase/alanine aminotransferase ratio, APRI aspartate aminotransferase to platelet ratio index, FIB-4 fibrosis 4
the prediction model was also verified with internal validation.
Since the approval of sorafenib in 2007, no clinical trial with newer agents has shown superior outcomes as a first-line treatment, until recently [8]. More importantly, there is no predictive biomarker for the selection of pa-tients who could benefit most from sorafenib, unlike other malignancies including breast cancer, lung cancer, and melanoma [24–26]. Most of the prospective clinical trials of molecular targeted therapies in patients with HCC to date were not designed for a prespecified patient popula-tion based on molecular classificapopula-tion and biomarkers. In addition, because noninvasive diagnosis is feasible in most cases with the characteristic imaging features, this omission of obtaining tumor tissue is another obstacle for biomarker exploration in HCC [12]. Thus, we explored candidate biomarkers for the prediction of sorafenib response in a prospectively collected clinical database and serum samples from an in-hospital cohort.
Comparing the present study with the Asia-Pacific sorafenib study [5], the median time to progression (2.7 months) was similar; however, the median OS (11.2 months) was longer in the present study than in the Asia-Pacific study (6.5 months). Although most of the en-rolled patients had chronic hepatitis B in both studies,
Table 3 Scoring system for the prediction of sorafenib response by using six covariates selected in the multivariable binary logistic regression analysis
Variable Cutoff value Score
bFGF (pg/mL) < 2.0 0
2–5.5 1
≥5.5 2
Log PIVKA-II (mAU/mL) < 30 0
30–1780 1 ≥1780 2 BCLC stage A, B 0 C 1 Etiology Nonviral 0 HCV 1 HBV 2 Log HGF (pg/mL) < 1380 0 1380–1860 1 ≥1860 2 Platelet (×103/μL) < 70 0 70–184 1 ≥184 2
Abbreviations: bFGF basic fibroblast growth factor, PIVKA-II protein induced by vitamin K absence-II, BCLC Barcelona Clinic Liver Cancer, HGF hepatocyte growth factor
Fig. 1 Area under the receiver-operating curve (AUC) analysis for exploring a threshold score for predicting sorafenib response. The risk score was calculated by using six covariates from the multivariable binary logistic regression analysis (Table3). When the score was 6 or higher, the sorafenib response was expected to be progressive disease with maximal sensitivity and specificity
patients in the Asia-Pacific study had more advanced tu-mors in that macrovascular invasion or extrahepatic spread was more frequently observed, which might have been responsible for the difference in OS. Indeed, a suba-nalysis of the GIDEON study from Japan reported that the median OS duration of patients with sorafenib therapy was 17.4 months in those with Child-Pugh class A disease and 4.9 months in those with Child-Pugh class B [27]. The longer OS in Japanese patients with Child-Pugh class
A might have resulted from the inclusion of fewer patients in BCLC stage C, compared with our study population (54.7 vs. 66.9%).
The selected covariates for the prediction of sorafenib response from the logistic regression analysis included etiology (B-viral), platelet count, BCLC stage, PIVKA-II, serum bFGF, and serum HGF. Concerning the etiology, hepatitis B-associated HCC was suggested as one of the possible reasons for the shorter OS in the Asia-Pacific study than that in the SHARP study [5]. High serum PIVKA-II level has been reported as a significant predis-posing factor for aggressive HCC biology including vas-cular invasion, intrahepatic spread, and extrahepatic spread [28–30]. Among serum angiogenic factors, bFGF and HGF were selected as covariates in the final risk scoring model. FGF2 or bFGF is known to stimulate HCC proliferation through an autocrine mechanism, to activate HCC invasion, and to induce angiogenesis [15].
Fig. 2 Kaplan-Meier survival curves for subgroups according to the risk scores. The median overall survivals were 19.0 months in group A (score≤ 5, solid black line), 11.2 months in group B (score 6, dashed line), and 6.1 months in group C (score≥ 7, dotted line) (P < 0.001, log-rank test)
Table 4 Cox proportional hazards analysis for predicting survival in the subgroups according to risk scores
Risk group HR (95% CI) P
Intermediate risk vs. low risk 2.529 (1.120–5.707) 0.025 High risk vs. low risk 6.577 (3.419–12.655) < 0.001
Risk groups according to risk scores: low-risk group, score≤ 5; intermediate-risk group, score 6; high-intermediate-risk group C, score≥ 7
In addition, previous studies reported that bFGF level in-creased as the tumor stage became more advanced, and was predictive of worse postoperative survival in patients with HCC [31, 32]. HGF/MET (mesenchymal-epithelial transition) factor is frequently dysregulated, playing a pivotal role in malignancies, including HCC [33]. Activa-tion of the c-MET pathway promotes tumor cell growth, angiogenesis, and metastasis, leading to more aggressive forms of HCC and poor outcomes [34]. A scoring system was developed by combining all the above-mentioned covariates, which showed good predictive performance for sorafenib response (area under the receiver-operating curve of 0.884 at the cutoff score of 6). More desirably, when patients were stratified into three subgroups according to risk scores, OS of the high-risk group was significantly shorter than that of the low-risk group. Recent clinical trials have investigated the efficacy of newer molecular targeted agents in ad-vanced HCC, such as tivantinib (NCT01755767) and lenvatinib (NCT01761266). Tivantinib is an HGF/c-MET inhibitor, and lenvatinib is a multitargeted receptor kinase inhibitor against VEGFR 1, 2, and 3; fibroblast growth factor receptor 1, 2, 3, and 4; platelet-derived growth factor receptor; RET; and c-KIT [33, 35]. Given that the signaling pathways of these new agents do not entirely overlap with the targets of sorafenib, the rele-vance of HGF and bFGF in the prediction of the re-sponse to and the outcome of sorafenib therapy suggests the possibility of an individualized approach in the selec-tion of systemic agents in this difficult-to-treat popula-tion, based on the prediction model in the present study. Lastly, platelets are the source of multiple growth factors and cytokines, and are known to promote tumor growth, angiogenesis, and metastatic potential [36–38]. Several reports have provided evidence supporting the role of platelets in HCC, e.g., reduction of hepatitis B virus –as-sociated experimental HCC by platelet inhibitors [39], antagonism of sorafenib action by platelet factors in HCC cell lines [40], and complete remission of advanced HCC with sorafenib in combination with clopidogrel [41]. Taken together, platelet count was also included in the final risk prediction model in the present study; however, its precise role in molecular targeted therapy needs more investigation.
The results and the risk scoring system of our study need to be interpreted and applied with caution owing to the following limitations. Firstly and most import-antly, although the samples for various biomarker assays were archived in a prospective cohort, multiple use of statistical algorithms raises concerns about false-positive results or overfitting [42,43]. The most desirable setting to avoid these concerns would be a prospective trial that focuses on a specific (group of ) biomarker(s) [42]. How-ever, exploration of predictive biomarkers for sorafenib
response in a new trial is not logistically feasible, except for large-scale comparative studies with newer agents [44]. Thus, we chose a retrospective analysis as an alter-native approach using prospectively collected samples. Secondly, a split-sample method for the validation of the results could not be applied in our cohort owing to the limited number of study subjects [45]. Instead, we per-formed internal validation using 3-fold cross-validation. An external validation with consistent results is a pre-requisite for the application of this scoring system in other patient populations with a larger sample size [42]. Finally, differences in the baseline clinical characteristics of the study subjects also hinder the imprudent generalization of our results in patient populations with a different etiology or tumor status.
Conclusions
In conclusion, we developed a biomarker-based predic-tion model of sorafenib response and survival from a prospective cohort. By using baseline serum bFGF and HGF levels as covariates, a total score of < 6 could be a relevant cutoff value for selecting patients who are most likely to benefit from sorafenib therapy. Furthermore, the cutoff value may also be used as guide to avoid un-necessary toxicity and inconvenience in patients with a score above this cutoff.
Abbreviations
AUR:Area under the curve; BCLC: Barcelona Clinic Liver Cancer; bFGF: Basic fibroblast growth factor; C-index: Concordance-index; FGF: Fibroblast growth factor; HCC: Hepatocellular carcinoma; HGF: Hepatocyte growth factor; LOXL2: Lysyl oxidase-like 2; N/A: Not available; OS: Overall survival; PD: Progressive disease; PDGFRb: Platelet-derived growth factor receptorβ; PIVKA: Protein induced by vitamin K absence-II; REMARK: Reporting Recommendations for Tumor Marker Prognostic Studies; SHARP: Sorafenib Hepatocelluar Carcinoma Assessment Randomized Protocol; VEGF: Vascular endothelial growth factor; VEGFR: Vascular endothelial growth factor receptor Acknowledgements
We thank Dr. Jinho Yoo (YooJin BioSoft, Goyang, Republic of Korea) for his excellent help with statistical analyses.
Funding
This work was funded by Doosan Yonkang Foundation (Grant No. 30–2016-0240), Liver Research Foundation of Korea as part of Bio Future Strategies Research Project, and Ewha Womans University research grant (2016). The funding bodies had no role in the design of the study, collection, analysis, and interpretation of data and in writing of the manuscript.
Availability of data and materials
The datasets used and/or analysed during the current study are available from the corresponding author on reasonable request.
Authors’ contributions
Study conception and design, data collection, analysis and interpretation, and manuscript writing by HYK, DHL and J-HL; data collection, analysis and interpretation and manuscript writing by HYK, DHL, J-HL, YYC, EJC, SJY, YJK and J-HY. All authors read and approved the final manuscript.
Ethics approval and consent to participate
The protocol of the present study conformed to the ethical guidelines of the World Medical Association Declaration of Helsinki, and was approved by the
Institutional Review Board of Seoul National University Hospital (IRB No. 0506–150-005). All study participants provided written informed consent. Consent for publication
Not applicable. Competing interests
The authors declare that they have no competing interests.
Publisher’s Note
Springer Nature remains neutral with regard to jurisdictional claims in published maps and institutional affiliations.
Author details
1Department of Internal Medicine, College of Medicine, Ewha Womans
University, Seoul, Republic of Korea.2Department of Internal Medicine and Liver Research Institute, Seoul National University College of Medicine, Seoul, Republic of Korea.3Department of Internal Medicine, SMG-SNU Boramae
Medical Center, Seoul, Republic of Korea.4Department of Internal Medicine,
Seoul National University Hospital, 101, Daehak-ro, Jongno-gu, Seoul 03080, Republic of Korea.
Received: 21 November 2017 Accepted: 9 March 2018 References
1. Wilhelm SM, Carter C, Tang L, Wilkie D, McNabola A, Rong H, Chen C, Zhang X, Vincent P, McHugh M, et al. BAY 43-9006 exhibits broad spectrum oral antitumor activity and targets the RAF/MEK/ERK pathway and receptor tyrosine kinases involved in tumor progression and angiogenesis. Cancer Res. 2004;64(19):7099–109.
2. Wilhelm SM, Adnane L, Newell P, Villanueva A, Llovet JM, Lynch M. Preclinical overview of sorafenib, a multikinase inhibitor that targets both Raf and VEGF and PDGF receptor tyrosine kinase signaling. Mol Cancer Ther. 2008;7(10):3129–40.
3. Wilhelm S, Carter C, Lynch M, Lowinger T, Dumas J, Smith RA, Schwartz B, Simantov R, Kelley S. Discovery and development of sorafenib: a multikinase inhibitor for treating cancer. Nat Rev Drug Discov. 2006;5(10):835–44. 4. Llovet JM, Ricci S, Mazzaferro V, Hilgard P, Gane E, Blanc JF, de Oliveira AC,
Santoro A, Raoul JL, Forner A, et al. Sorafenib in advanced hepatocellular carcinoma. N Engl J Med. 2008;359(4):378–90.
5. Cheng AL, Kang YK, Chen Z, Tsao CJ, Qin S, Kim JS, Luo R, Feng J, Ye S, Yang TS, et al. Efficacy and safety of sorafenib in patients in the Asia-Pacific region with advanced hepatocellular carcinoma: a phase III randomised, double-blind, placebo-controlled trial. Lancet Oncol. 2009;10(1):25–34. 6. Bruix J, Sherman M. American Association for the Study of liver D:
management of hepatocellular carcinoma: an update. Hepatology. 2011; 53(3):1020–2.
7. European Association For The Study Of The L, European Organisation For R, Treatment Of C. EASL-EORTC clinical practice guidelines: management of hepatocellular carcinoma. J Hepatol. 2012;56(4):908–43.
8. Bruix J, Han KH, Gores G, Llovet JM, Mazzaferro V. Liver cancer: approaching a personalized care. J Hepatol. 2015;62(1 Suppl):S144–56.
9. Sawyers CL. The cancer biomarker problem. Nature. 2008;452(7187):548–52. 10. Kelloff GJ, Sigman CC. Cancer biomarkers: selecting the right drug for the
right patient. Nat Rev Drug Discov. 2012;11(3):201–14.
11. Llovet JM, Pena CE, Lathia CD, Shan M, Meinhardt G, Bruix J, Group SIS. Plasma biomarkers as predictors of outcome in patients with advanced hepatocellular carcinoma. Clin Cancer Res. 2012;18(8):2290–300. 12. Llovet JM, Hernandez-Gea V. Hepatocellular carcinoma: reasons for
phase III failure and novel perspectives on trial design. Clin Cancer Res. 2014;20(8):2072–9.
13. Horiguchi N, Takayama H, Toyoda M, Otsuka T, Fukusato T, Merlino G, Takagi H, Mori M. Hepatocyte growth factor promotes
hepatocarcinogenesis through c-met autocrine activation and enhanced angiogenesis in transgenic mice treated with diethylnitrosamine. Oncogene. 2002;21(12):1791–9.
14. Wong CC, Tse AP, Huang YP, Zhu YT, Chiu DK, Lai RK, Au SL, Kai AK, Lee JM, Wei LL, et al. Lysyl oxidase-like 2 is critical to tumor microenvironment and metastatic niche formation in hepatocellular carcinoma. Hepatology. 2014; 60(5):1645–58.
15. Kin M, Sata M, Ueno T, Torimura T, Inuzuka S, Tsuji R, Sujaku K, Sakamoto M, Sugawara H, Tamaki S, et al. Basic fibroblast growth factor regulates proliferation and motility of human hepatoma cells by an autocrine mechanism. J Hepatol. 1997;27(4):677–87.
16. Llovet JM, Di Bisceglie AM, Bruix J, Kramer BS, Lencioni R, Zhu AX, Sherman M, Schwartz M, Lotze M, Talwalkar J, et al. Design and endpoints of clinical trials in hepatocellular carcinoma. J Natl Cancer Inst. 2008;100(10):698–711. 17. McShane LM, Altman DG, Sauerbrei W, Taube SE, Gion M, Clark GM.
Statistics subcommittee of the NCIEWGoCD: reporting recommendations for tumor marker prognostic studies (REMARK). J Natl Cancer Inst. 2005; 97(16):1180–4.
18. Lencioni R, Llovet JM. Modified RECIST (mRECIST) assessment for hepatocellular carcinoma. Semin Liver Dis. 2010;30(1):52–60. 19. Wai CT, Greenson JK, Fontana RJ, Kalbfleisch JD, Marrero JA,
Conjeevaram HS, Lok AS. A simple noninvasive index can predict both significant fibrosis and cirrhosis in patients with chronic hepatitis C. Hepatology. 2003;38(2):518–26.
20. Shah AG, Lydecker A, Murray K, Tetri BN, Contos MJ, Sanyal AJ. Nash clinical research N: comparison of noninvasive markers of fibrosis in patients with nonalcoholic fatty liver disease. Clin Gastroenterol Hepatol. 2009;7(10):1104–12.
21. Lee JH, Yoon JH, Lee CH, Myung SJ, Keam B, Kim BH, Chung GE, Kim W, Kim YJ, Jang JJ, et al. Complete blood count reflects the degree of oesophageal varices and liver fibrosis in virus-related chronic liver disease patients. J Viral Hepat. 2009;16(6):444–52.
22. Lok AS, Ghany MG, Goodman ZD, Wright EC, Everson GT, Sterling RK, Everhart JE, Lindsay KL, Bonkovsky HL, Di Bisceglie AM, et al. Predicting cirrhosis in patients with hepatitis C based on standard laboratory tests: results of the HALT-C cohort. Hepatology. 2005;42(2):282–92. 23. Harrell FE Jr, Lee KL, Mark DB. Multivariable prognostic models: issues in
developing models, evaluating assumptions and adequacy, and measuring and reducing errors. Stat Med. 1996;15(4):361–87.
24. Verma S, Miles D, Gianni L, Krop IE, Welslau M, Baselga J, Pegram M, Oh DY, Dieras V, Guardino E, et al. Trastuzumab emtansine for HER2-positive advanced breast cancer. N Engl J Med. 2012;367(19):1783–91.
25. Shaw AT, Kim DW, Nakagawa K, Seto T, Crino L, Ahn MJ, De Pas T, Besse B, Solomon BJ, Blackhall F, et al. Crizotinib versus chemotherapy in advanced ALK-positive lung cancer. N Engl J Med. 2013;368(25):2385–94.
26. Chapman PB, Hauschild A, Robert C, Haanen JB, Ascierto P, Larkin J, Dummer R, Garbe C, Testori A, Maio M, et al. Improved survival with vemurafenib in melanoma with BRAF V600E mutation. N Engl J Med. 2011; 364(26):2507–16.
27. Kudo M, Ikeda M, Takayama T, Numata K, Izumi N, Furuse J, Okusaka T, Kadoya M, Yamashita S, Ito Y, et al. Safety and efficacy of sorafenib in Japanese patients with hepatocellular carcinoma in clinical practice: a subgroup analysis of GIDEON. J Gastroenterol. 2016;51(12):1150–60. 28. Pote N, Cauchy F, Albuquerque M, Voitot H, Belghiti J, Castera L, Puy H,
Bedossa P, Paradis V. Performance of PIVKA-II for early hepatocellular carcinoma diagnosis and prediction of microvascular invasion. J Hepatol. 2015;62(4):848–54.
29. Bae HM, Lee JH, Yoon JH, Kim YJ, Heo DS, Lee HS. Protein induced by vitamin K absence or antagonist-II production is a strong predictive marker for extrahepatic metastases in early hepatocellular carcinoma: a prospective evaluation. BMC Cancer. 2011;11:435.
30. Xu JF, Liu XY. PIVKA-II is an independent prognostic factor for overall survival of HCC patients and maybe associated with epithelial-mesenchymal transition. J Hepatol. 2015;63(4):1040–1.
31. Hsu PI, Chow NH, Lai KH, Yang HB, Chan SH, Lin XZ, Cheng JS, Huang JS, Ger LP, Huang SM, et al. Implications of serum basic fibroblast growth factor levels in chronic liver diseases and hepatocellular carcinoma. Anticancer Res. 1997;17(4A):2803–9.
32. Poon RT, Ng IO, Lau C, Yu WC, Fan ST, Wong J. Correlation of serum basic fibroblast growth factor levels with clinicopathologic features and postoperative recurrence in hepatocellular carcinoma. Am J Surg. 2001; 182(3):298–304.
33. Santoro A, Rimassa L, Borbath I, Daniele B, Salvagni S, Van Laethem JL, Van Vlierberghe H, Trojan J, Kolligs FT, Weiss A, et al. Tivantinib for second-line treatment of advanced hepatocellular carcinoma: a randomised, placebo-controlled phase 2 study. Lancet Oncol. 2013;14(1):55–63.
34. Trojan J, Zeuzem S. Tivantinib in hepatocellular carcinoma. Expert Opin Investig Drugs. 2013;22(1):141–7.
35. Ikeda M, Okusaka T, Mitsunaga S, Ueno H, Tamai T, Suzuki T, Hayato S, Kadowaki T, Okita K, Kumada H. Safety and pharmacokinetics of Lenvatinib in patients with advanced hepatocellular carcinoma. Clin Cancer Res. 2016; 22(6):1385–94.
36. Jain S, Harris J, Ware J. Platelets: linking hemostasis and cancer. Arterioscler Thromb Vasc Biol. 2010;30(12):2362–7.
37. Bambace NM, Holmes CE. The platelet contribution to cancer progression. J Thromb Haemost. 2011;9(2):237–49.
38. Buergy D, Wenz F, Groden C, Brockmann MA. Tumor-platelet interaction in solid tumors. Int J Cancer. 2012;130(12):2747–60.
39. Sitia G, Iannacone M, Guidotti LG. Anti-platelet therapy in the prevention of hepatitis B virus-associated hepatocellular carcinoma. J Hepatol. 2013;59(5):1135–8.
40. D’Alessandro R, Refolo MG, Lippolis C, Giannuzzi G, Carella N, Messa C, Cavallini A, Carr BI. Antagonism of sorafenib and regorafenib actions by platelet factors in hepatocellular carcinoma cell lines. BMC Cancer. 2014;14:351.
41. Tan-Shalaby JL. Reproducible complete remission of advanced hepatocellular carcinoma with sorafenib in combination with clopidogrel. BMJ Care Rep. 2014;2014.https://doi.org/10.1136/bcr-2014-203962. 42. Simon RM, Paik S, Hayes DF. Use of archived specimens in evaluation
of prognostic and predictive biomarkers. J Natl Cancer Inst. 2009; 101(21):1446–52.
43. Ludwig JA, Weinstein JN. Biomarkers in cancer staging, prognosis and treatment selection. Nat Rev Cancer. 2005;5(11):845–56.
44. Mandrekar SJ, Sargent DJ. Predictive biomarker validation in practice: lessons from real trials. Clin Trials. 2010;7(5):567–73.
45. Simon R. Validation of pharmacogenomic biomarker classifiers for treatment selection. Cancer Biomark. 2006;2(3–4):89–96.
• We accept pre-submission inquiries
• Our selector tool helps you to find the most relevant journal
• We provide round the clock customer support
• Convenient online submission
• Thorough peer review
• Inclusion in PubMed and all major indexing services
• Maximum visibility for your research Submit your manuscript at
www.biomedcentral.com/submit