254
WHO Classification of Malignant Lymphomas in Korea: Report of the Third
Nationwide Study
Jin-Man Kim · Young-Hyeh Ko1
Seung-Sook Lee2· Jooryung Huh3
Chang Suk Kang4· Chul Woo Kim5
Yun Kyung Kang6· Jai Hyang Go7
Min Kyung Kim8· Wan-Seop Kim9
Yoon Jung Kim10· Hyun-Jung Kim11
Hee Kyung Kim12· Jong Hee Nam13
Hyung Bae Moon14· Chan-Kum Park15
Tae In Park16· Young-Ha Oh17
Dong Wha Lee18· Jong Sil Lee19
Juhie Lee20· Hyekyung Lee21
Sung-Chul Lim22· Kyu Yun Jang23
Hee-Kyung Chang24
Yoon Kyung Jeon5· Hye Ra Jung25
Min-Sun Cho26· Hee Jeong Cha27
Suk Jin Choi28· Jae Ho Han29
Sook Hee Hong30· Insun Kim31
Department of Pathology, Chungnam National University; 1Samsung Medical Center; 2Korea Cancer Center Hospital; 3Asan Medical Center; 4Catholic University of Korea; 5Seoul National University; 6Seoul Paik Hospital; 7Dankook University; 8Kangbuk Samsung Hospital; 9Konkuk University; 10Seoul Veterans Hospital; 11Sanggye Paik Hospital; 12Soonchunhyang University Bucheon Hospital; 13Chonnam National University; 14Wonkwang University; 15Hanyang University; 16Kyungpook National University; 17Hanyang University Guri Hospital; 18Soonchunhyang University; 19Gyeongsang University; 20KyungHee University; 21Eulji University Daejeon Hospital; 22Chosun University; 23Chonbuk National University; 24Kosin University; 25Keimyung University; 26Ewha Womans University; 27Ulsan University, 28Inha University; 29Ajou University; 30Dong-A University; 31Korea University, Korea
Background: The aim of study was to determine the relative frequency of malignant lymphoma
according to World Health Organization (WHO) classification in Korea. Methods: A total of 3,998
cases diagnosed at 31 institutes between 2005 and 2006 were enrolled. Information including age, gender, pathologic diagnosis, site of involvement and immunophenotypes were obtained.
Results: The relative frequency of non-Hodgkin lymphoma (NHL) and Hodgkin lymphoma (HL)
was 95.4% and 4.6%, respectively. B-cell lymphomas accounted for 77.6% of all NHL, while T/ natural killer (T/NK)-cell lymphomas accounted for 22.4%. The most frequent subtypes of NHL were diffuse large B-cell lymphoma (42.7%), extranodal marginal zone B-cell lymphoma (MZBCL) of mucosa-associated lymphoid tissue (19.0%), NK/T-cell lymphoma (6.3%) and peripheral T-cell lymphoma (PTCL), unspecified (6.3%), in decreasing order. The relative frequency of HL was no-dular sclerosis (47.4%), mixed cellularity (30.6%), and nono-dular lymphocyte predominant (12.1%) subtypes. Compared with a previous study in 1998, increase in gastric MZBCL and nodular scle-rosis HL, and slight decrease of follicular lymphoma, PTCL, and NK/T-cell lymphoma were ob-served. Conclusions: Korea had lower rates of HL and follicular lymphoma, and higher rates of
extranodal NHL, extranodal MZBCL, and NK/T-cell lymphoma of nasal type compared with Wes-tern countries. Changes in the relative frequency of lymphoma subtypes are likely ascribed to re-fined diagnostic criteria and a change in national health care policy.
Key Words: Lymphoma; Malignant; WHO; Korea
Received: March 22, 2011 Accepted: May 2, 2011 Corresponding Author Insun Kim, M.D.
Department of Pathology, Korea University College of Medicine, 126-1 Anam-dong 5-ga, Seongbuk-gu, Seoul 136-702, Korea
Tel: +82-2-920-6373 Fax: +82-2-953-3130 E-mail: [email protected]
*Jin-Man Kim and Young-Hyeh Ko contributed equally to this work. This work was supported by 2007 Study Group Supporting Program of Korean Society of Pathologists.
Malignant lymphoma comprised of a diverse group of malig-nant lymphoid neoplasms comprising of B, T, and natural killer (NK) cell lineage, which accounts for 2.3% of malignant neo-plasm in Korea and the crude incidence is 9.0 per 100,000 in general population.1 Classification of malignant lymphoma has
been evolving over the last 30 years and the most recent World Health Organization (WHO) classification divided lymphoid neoplasm into more than 30 lymphoma entities based on the characteristics of neoplastic cells including morphology, immu-nophenotype, and clinical findings such as the location of the lesion, and genetic changes.2 As it is well known, the frequency
of subtypes of malignant lymphoma is different according to geographic regions. Compared with Western countries, regions of Asia have reported higher rates of T-cell lymphoma and low-er rates of follicular lymphoma and Hodgkin’s disease.3-7
Be-cause the frequency of subtypes provides fundamental informa-tion for the study of malignant lymphoma, the Hemato-lym-phoreticular Study Group of the Korean Society of Pathologists had carried out a nationwide study in 1992 based on the Work-ing Formulation and in 1998 based on the revised European-American lymphoma (REAL) classification and determined the relative frequency of malignant lymphoma.6,8
Since the second nationwide study, more than 10 years has passed. During that period, the report of the 2nd nationwide study has provided valuable information to many lymphoma researchers; however, most people now feel the need to update the data. To meet increasing demands on the updated informa-tion for the relative frequency of lymphoma entities, we carried out the third nationwide study on a total of 3,998 cases of ma-lignant lymphoma, including Hodgkin lymphoma (HL), based on the WHO classification.
MATERIALS AND METHODS
A total of 3,998 cases of malignant lymphoma, including HL, diagnosed at 31 institutes between January 2005 and De-cember 2006 were enrolled in the study. All the participants in the study were regular members of a Korean Study Group of Hematopathology. The cases were classified according to the 2001 WHO classification.9 Histologic features and
immuno-histochemical results were carefully reviewed and additional immunohistochemistry was performed in several selected cases. Antibody panels included CD20, CD3, CD56, CD4, CD8, CD21, CD10, cyclinD1, CD23, CD30, CD15, kappa, lambda light chain, and anaplastic lymphoma kinase-1. Ep stein-Barr
virus (EBV)-encoded RNA in situ hybridization was performed in the cases indicated. Information including age, gender, path-ologic diagnosis, site of involvement, and immunophenotypes were obtained. The cases were classified into B-non-Hodgkin lymphoma (NHL), T/natural killer (NK)-NHL, and HL based on lymphoma type. The histologic and clinical results were compared with those of the previous study reported in 1998, which included studied cases diagnosed between January 1994 and October 1996.
RESULTS
The median age of the patients with malignant lymphoma was 52 years and the male to female ratio was 1:3. Biopsy sites included the lymph node (30.4% of cases) and extranodal sites (69.6% of cases). Malignant lymphomas arising in the lymph node account for 26.3% of B-cell NHL and 35.2% in T/NK-cell NHL.
The relative frequency of Hodgkin lymphomas and comparison with the previous nationwide study in 1998
(Tables 1 and 2)
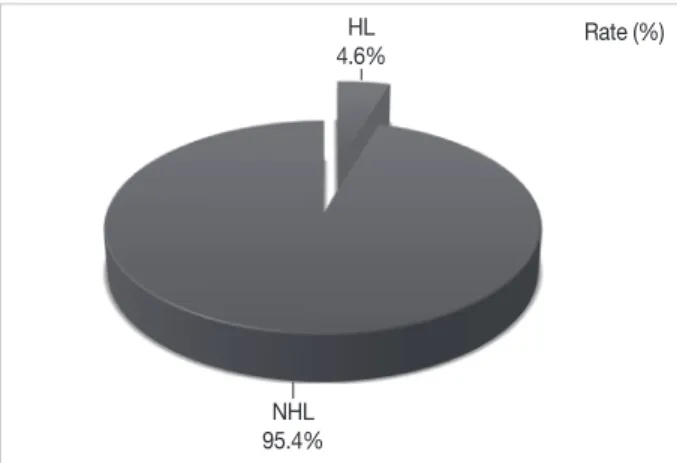
HL accounts for 4.6% of malignant lymphomas and the pro-portion between NHL was similar to that of data in 1998 (Fig. 1). Nodular sclerosis subtype was markedly increased, account-ing for 47.4% of HL while the relative frequency of mixed cel-lularity decreased (Fig. 2).
Relative frequency of NHL and comparison with the previous study in 1998 (Tables 1 and 2)
The ratio between T/NK-cell lymphoma and B-cell lympho-ma did not change and was similar to that of study in 1998. Diffuse large B-cell lymphoma (DLBCL) was the most frequent subtype (42.7%) of NHL, followed by extranodal marginal zone B-cell lymphoma (MZBCL) (19.0%), extranodal NK/T-cell lymphoma (6.3%), peripheral T-NK/T-cell lymphoma (PTCL), unspecified (6.3%) (Fig. 3). The rank in frequencies was similar to those of the previous study performed in 1998. Follicular lymphoma accounted for only 2.9% of NHL and seems to have decreased compared with the 1998 study (6.2%). PTCL, un-specified and extranodal NK/T-cell lymphoma were slightly decreased.
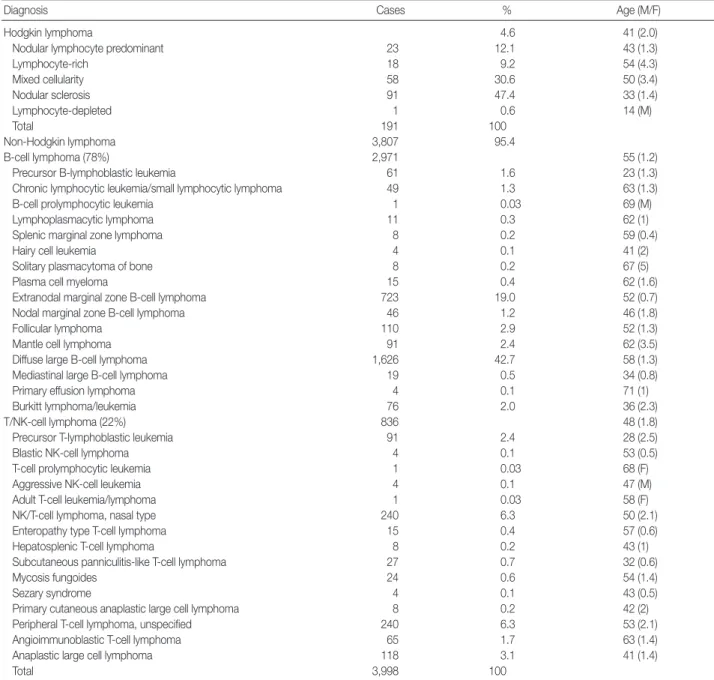
Table 1. Relative frequency of histologic subtypes of malignant lymphoma
Diagnosis Cases % Age (M/F)
Hodgkin lymphoma 4.6 41 (2.0)
Nodular lymphocyte predominant 23 12.1 43 (1.3)
Lymphocyte-rich 18 9.2 54 (4.3) Mixed cellularity 58 30.6 50 (3.4) Nodular sclerosis 91 47.4 33 (1.4) Lymphocyte-depleted 1 0.6 14 (M) Total 191 100 Non-Hodgkin lymphoma 3,807 95.4 B-cell lymphoma (78%) 2,971 55 (1.2)
Precursor B-lymphoblastic leukemia 61 1.6 23 (1.3)
Chronic lymphocytic leukemia/small lymphocytic lymphoma 49 1.3 63 (1.3)
B-cell prolymphocytic leukemia 1 0.03 69 (M)
Lymphoplasmacytic lymphoma 11 0.3 62 (1)
Splenic marginal zone lymphoma 8 0.2 59 (0.4)
Hairy cell leukemia 4 0.1 41 (2)
Solitary plasmacytoma of bone 8 0.2 67 (5)
Plasma cell myeloma 15 0.4 62 (1.6)
Extranodal marginal zone B-cell lymphoma 723 19.0 52 (0.7)
Nodal marginal zone B-cell lymphoma 46 1.2 46 (1.8)
Follicular lymphoma 110 2.9 52 (1.3)
Mantle cell lymphoma 91 2.4 62 (3.5)
Diffuse large B-cell lymphoma 1,626 42.7 58 (1.3)
Mediastinal large B-cell lymphoma 19 0.5 34 (0.8)
Primary effusion lymphoma 4 0.1 71 (1)
Burkitt lymphoma/leukemia 76 2.0 36 (2.3)
T/NK-cell lymphoma (22%) 836 48 (1.8)
Precursor T-lymphoblastic leukemia 91 2.4 28 (2.5)
Blastic NK-cell lymphoma 4 0.1 53 (0.5)
T-cell prolymphocytic leukemia 1 0.03 68 (F)
Aggressive NK-cell leukemia 4 0.1 47 (M)
Adult T-cell leukemia/lymphoma 1 0.03 58 (F)
NK/T-cell lymphoma, nasal type 240 6.3 50 (2.1)
Enteropathy type T-cell lymphoma 15 0.4 57 (0.6)
Hepatosplenic T-cell lymphoma 8 0.2 43 (1)
Subcutaneous panniculitis-like T-cell lymphoma 27 0.7 32 (0.6)
Mycosis fungoides 24 0.6 54 (1.4)
Sezary syndrome 4 0.1 43 (0.5)
Primary cutaneous anaplastic large cell lymphoma 8 0.2 42 (2)
Peripheral T-cell lymphoma, unspecified 240 6.3 53 (2.1)
Angioimmunoblastic T-cell lymphoma 65 1.7 63 (1.4)
Anaplastic large cell lymphoma 118 3.1 41 (1.4)
Total 3,998 100
NK, natural killer.
Table 2. Comparison with the data collected in 1998
Diagnosis 19988 (%) Present (%) Diagnosis 1998 (%) Present (%)
Hodgkin lymphoma 5.3 4.6 Subtypes of NHL
Nodular lymphocyte predominant 9.8 12.1 MZBCL of MALT 16.7 19.0
Lymphocyte-rich NA 9.2 Mantle cell lymphoma 1.5 2.4
Mixed cellularity 46.3 30.6 Follicular lymphoma 6.2 2.9
Nodular sclerosis 31.7 47.4 Diffuse large B-cell 43.2 42.7
Lymphocyte-depleted 7.3 0.6 Burkitt lymphoma 1.1 2.0
Non-Hodgkin lymphoma 94.7 95.4 NK/T-cell lymphoma 8.7 6.3
B-cell NHL 74.8 78.0 PTCL, unspecified 9.4 6.3
T-cell NHL 25 22.0 Anaplastic large cell 1.5 3.1
NHL, non-Hodgkin lymphoma; MZBCL, marginal zone B-cell lymphoma; NK, natural killer; MALT, mucosa-associated lymphoid tissue; NA, not applicable; PTCL, peripheral T-cell lymphoma.
Fig. 1. Relative frequencies of non-Hodgkin lymphoma (NHL) and Hodgkin lymphoma (HL). Rate (%) HL 4.6% NHL 95.4% 50 45 40 35 30 25 20 15 10 5 0 Nodular lymphocyte predominant HL Nodular sclerosis classical HL Lymphocyte-rich classical HL Mixed cellularity classical HL Lymphocyte-depleted classical HL 12.1 47.4 9.2 30.6 0.6
Fig. 2. Relative frequencies of the histologic subtypes of Hodgkin lymphoma.
HL, Hodgkin lymphoma.
Rate (%)
Fig. 3. Relative frequencies of the histologic subtypes of non-Hodgkin lymphoma.
MALT, mucosa-associated lymphoid tissue; NK, natural killer; CLL/SLL, chronic lymphocytic leukemia/small lymphocytic lymphoma.
Diffuse large B-cell lymphoma Extranodal marginal zone B-cell lymphoma of MALT Extranodal NK/T-cell lymphoma, nasal type Peripheral T-cell lymphoma, unspecified Plasma cell myeloma Anaplastic large cell lymphoma Follicular lymphoma Precursor T-lymphoblastic leukemia/lymphoma Mantle cell lymphoma Burkitt lymphoma/leukemia Angioimmunoblastic T-cell lymphoma Precursor B-lymphoblastic lymphoma/leukemia CLL/SLL Nodal marginal zone B-cell lymphoma Subcutaneous panniculitis like T-cell lymphoma Mycosis fungoides Mediastinal large B-cell lymphoma Extraosseous plasmacytoma Enteropathy type T-cell lymphoma Lymphoplasmacytic lymphoma Hepatosplenic T-cell lymphoma Splenic marginal zone lymphoma Primary cutaneous anaplastic large cell lymphoma Solitary plasmacytoma of bone Sezary syndrome Blastic NK-cell lymphoma Hairy cell leukemia Aggressive NK-cell leukemia Primary effusion lymphoma Adult T-cell leukemia/lymphoma T-cell prolymphocytic leukemia B-cell prolymphocytic leukemia
0 5 10 15 20 25 30 35 40 45 42.7 19.0 6.3 6.3 3.3 3.1 2.9 2.4 2.4 2.0 1.7 1.6 1.3 1.2 0.7 0.6 0.5 0.4 0.4 0.3 0.2 0.2 0.2 0.2 0.1 0.1 0.1 0.1 0.1 0.0 0.0 0.0 Rate (%) Comparison of the relative frequency of lymphoma
subtypes among Asian countries (Table 3)
To compare the relative frequency of lymphoma subtypes bas-ed on WHO classification among Asian countries, we have re-viewed the reports published since 2000. Among Asian coun-tries, the pattern of distribution was not uniform and showed
slight differences. Japan4 was similar to Korea in its lower rate
of Hodgkin lymphoma, but was different in its higher rate of adult T-cell leukemia/lymphoma (ATLL), and lower rate of EBV-associated extranodal T/NK-cell lymphoma and extranodal MZ-BCL. The lymphomas from Shanghai3 were characterized by
relatively frequent Hodgkin lymphoma, lower rate of NK/T-cell lymphoma, and rare ATLL. In Taiwan, a relatively high rate
of follicular lymphoma was noted.10,11 In Thailand, HL and
fol-licular lymphoma showed higher rates compared with Korea.5
Relative frequency of primary site of involvement in NHL and comparison with the 1998 study (Table 4)
The relative frequency of nodal and extranodal lymphomas was 30.4% and 69.6%, respectively. For extranodal lymphomas, the most frequent sites of involvement included the stomach, Waldeyer’s ring, eye, sinonasal cavity, and small intestine, in
decreasing order. Compared with the 1998 study, the relative frequency of extranodal, gastric, and ocular lymphomas increased.
Table 3. Comparison of the relative frequency of malignant lym-phoma in Asian countries
Diagnosis (2010)Korea Japan(2000)4 Shanghai(2008)3 Taiwan(2006)10 Tailand(2004)5 No. of cases 3,998 3,194 831 598 1,983 Hodgkin lymphoma 4.6 4.41 12.4 7.0 7.9 B-cell NHL 74.4 68.53 68.4 80.6 69 T/NK-cell NHL 21.0 24.92 18.2 12.4 23 Diffuse large B-cell
lymphoma 42.7 33.34 29.1 39 50.5 MZBCL of MALT 19.0 8.45 2.5 5.7 4.1 Follicular lymphoma 2.9 6.70 7.0 16.4 8.4 NK/T-cell lymphoma 6.3 2.60 0.6 2.8 NA ATLL <1 7.45 NA 0 NA PTCL, unspecified 6.3 6.67 5.5 3.8 13 NHL, non-Hodgkin lymphoma; NK, natural killer; NA, not applicable; MZB-CL, marginal zone B-cell lymphoma; MALT, mucosa-associated lymphoid tissue; ATLL, adult T-cell leukemia/lymphoma; PTCL, peripheral T-cell lym-phoma.
Table 4. Relative frequency of site of involvement in NHL and com-parison with the data in 1998
Site 19988 2010 No. of cases % No. of cases % Age (yr)/Sex ratio (M/F) Lymph node 538 36.7 1,157 30.4 54/1.4 Extranodal 926 63.3 2,650 69.6 53/1.2 Waldeyer’s ring 210 10.2 340 9.0 56/1.7 Nasal and PNS 81 5.5 221 5.8 52/1.7 Oral cavity 43 2.9 72 1.9 59/1.5 Gastrointestinal 303 20.7 1,112 29.2 55/1.2 Stomach 196 13.4 761 20.0 56/1.0 Small intestine 60 4.1 209 5.5 54/1.6 Large intestine 47 3.2 145 3.8 56/1.4 Eye 57 3.9 247 6.5 46/0.6 Skin 58 4.0 160 4.2 49/1.1 Soft tissue 55 3.8 76 2.0 58/1.2 CNS 39 2.7 133 3.5 55/1.6 Bone 26 1.8 61 1.6 48/1.3 Breast 14 1.0 23 0.6 50/0.2 Mediastinum 14 1.0 42 1.1 28/1.4 Lung 12 0.8 42 1.1 53/1.5 Salivary 12 0.8 8 0.2 53/0.3 Ovary NA NA 15 0.4 51/0 Uterus NA NA 15 0.4 60/0 Liver NA NA 53 1.4 54/1.5 Spleen NA NA 27 0.7 53/1.6
NHL, non-Hodgkin lymphoma; PNS, paranasal sinus; CNS, central nervous system; NA, not applicable.
Table 5. Relative frequency of the histologic subtypes in NHL according to the site of involvement
LN Waldeyer ring Nasal and PNS Stomach intestineSmall Colorectum CNS Skin Eye Bone No. of cases (%) 1,157 (100) 340 (100) 221 (100) 761 (100) 209 (100) 145 (100) 133 (100) 160 (100) 247 (100) 61 (100) CLL/SLL 35 (4.2) 3 (0.9) 0 (0) 1 (0.1) 1 (0.5) 0 (0) 0 (0) 1 (0.6) 2 (0.8) 6 (9.8) MCL 45 (3.9) 10 (2.9) 0 (0) 7 (0.9) 11 (5.3) 8 (5.5) 1 (0.8) 0 (0) 1 (0) 2 (3.3) FL 93 (8.0) 10 (2.9) 0 (0) 0 (0) 0 (0) 3 (2.1) 0 (0) 0 (0) 2 (0.8) 0 (0) DLBCL 579 (50) 208 (61.2) 32 (14.5) 267 (35.1) 118 (56.5) 88 (60.7) 115 (86.5) 25 (15.6) 9 (3.6) 24 (39.3) MZBCL 4 (0.3) 7 (2.1) 1 (0.5) 427 (56.1) 29 (13.9) 25 (17.2) 3 (2.3) 7 (4.4) 215 (87.0) 0 (0) PTCL 131 (11.3) 27 (7.9) 13 (5.9) 16 (2.1) 8 (3.8) 7 (4.8) 9 (6.8) 19 (11.9) 0 (0) 5 (8.2) NK/T 5 (0.4) 29 (8.5) 153 (69.2) 2 (0.3) 4 (1.9) 4 (2.8) 0 (0) 15 (9.4) 3 (1.2) 2 (0) AITCL 62 (5.4) 1 (0.3) 1 (0.5) 0 (0) 0 (0) 0 (0) 0 (0) 1 (0.6) 0 (0) 0 (0) ALCL 78 (6.7) 3 (0.9) 1 (0.5) 4 (0.5) 4 (1.9) 1 (0.7) 1 (0.8) 18 (11.3) 0 (0) 2 (3.3) MF 1 (0.1) 0 (0) 0 (0) 0 (0) 0 (0) 0 (0) 0 (0) 23 (14.4) 0 (0) 0 (0) SQPTCL 0 (0) 0 (0) 0 (0) 0 (0) 0 (0) 0 (0) 0 (0) 27 (16.9) 0 (0) 0 (0) ETCL 0 (0) 0 (0) 0 (0) 1 (0.1) 9 (4.3) 3 (2.1) 0 (0) 0 (0) 0 (0) 0 (0) LBL-B 14 (1.2) 6 (1.8) 2 (0.9) 1 (0.1) 0 (0) 0 (0) 1 (0.8) 6 (3.8) 0 (0) 7 (11.5) LBL-T 40 (3.5) 6 (1.8) 0 (0) 1 (0.1) 0 (0) 1 (0.7) 0 (0) 0 (0) 0 (0) 8 (0) Others 70 (6.1) 30 (8.8) 18 (8.1) 34 (4.5) 25 (12.0) 5 (3.4) 3 (2.3) 18 (11.3) 15 (6.1) 5 (8.2) Values are presented as number (%).
NHL, non-Hodgkin lymphoma; LN, lymph node; PNS, paranasal sinus; CNS, central nervous system; CLL/SLL, chronic lymphocytic leukemia/small lympho-cytic lymphoma; MCL, mantle cell lymphoma; FL, follicular lymphoma; DLBCL, diffuse large B-cell lymphoma; MZBCL, marginal zone B-cell lymphoma; PTCL, peripheral T-cell lymphoma; NK, natural killer; AITCL, angioimmunoblastic T-cell lymphoma; ALCL, anaplastic large cell lymphoma; MF, mycosis fungoides; SQPTCL, subcutaneous panniculitis-like T-cell lymphoma; ETCL, enteropathy type T-cell lymphoma; LBL, lymphoblastic lymphoma/leukemia.
Relative frequency of subtypes in NHL according to site of involvement (Table 5)
In nodal lymphoma, half of the cases were DLBCL, followed by PTCL, unspecified, follicular lymphoma, anaplastic large cell lymphoma, angioimmunoblastic T-cell lymphoma, and mantle cell lymphoma, in decreasing order. For gastric lym-phoma, the most common type was extranodal MZBCL of mu-cosa-associated lymphoid tissue, followed by DLBCL, Burkitt lymphoma, PTCL, unspecified, and mantle cell lymphoma, in decreasing order. In small and large intestinal lymphomas, the most common type was DLBCL, followed by extranodal MZB-CL. The most common central nervous system (CNS) lympho-ma was DLBCL. Other types were very rare in CNS.
DISCUSSION
This study confirms characteristics of malignant lymphoma in Korea, which shows a higher rate of extranodal lymphoma, lower rate of HL and follicular lymphoma, and a relatively high-er rate of T/NK-cell lymphoma and extranodal MZBCL com-pared with Western countries. The overall distribution pattern of malignant lymphoma types was similar to those of the previ-ous nationwide study performed in 1998;8 however, several
changes were notable. Although the frequency of HL remained unchanged, the relative frequency of the nodular sclerosis sub-type showed a marked increase from 31.7% in 1998 to 47.4% in 2010, whereas the frequency of mixed cellularity markedly decreased. Such a change in frequency for the HL subtype is at-tributed to the accumulation of knowledge on the morphologic spectrum of nodular sclerosis. Many cases, which were previ-ously diagnosed as mixed cellularity, were reclassified as nodular sclerosis subtype this time. In addition, there was a slight de-crease in frequency for PTCL, unspecified. The changes are more likely because of better defined diagnostic criteria for T-lineage lymphomas in the 2001 WHO classification compared with the REAL classification. Further, the application of an antibody panel for immunohistochemistry makes it possible to better classify a T-lineage lymphoma of unspecified subtype to other subtypes. Interestingly, the frequency of follicular lymphoma decreased. Follicular lymphoma only accounts for 2.9% of non-Hodgkin lymphoma, which is the lowest among Asian coun-tries. An increase in gastric lymphoma and extranodal MZBCL compared with the data in 1998 may reflect a screening effect caused by the wide use of endoscopic examinations by the
tional Cancer Screening program which is covered by the Na-tional Insurance System since 2005.
In comparison with other East Asian countries, the Korean data showed both similarities and differences. The differences may be partly derived from case selection bias. Alternatively, the differences in subtype distribution in Asian countries may reflect differences in environmental factors, as well as racial fac-tors related to disease. For example, the prevalence of the EBV, which is the major contributing factor related to NK/T-cell lymphoma, is different between regions, even within the Asian countries. And, it should reflect the significant differences in the incidence of NK/T-cell lymphoma. Interestingly, the fre-quency of NK/T-cell lymphoma is relatively high in Korea. Moreover, the overall frequency of NK/T-cell lymphoma rela-tive to Korea, was lower in Shanghai, Japan, and Taiwan.3,4,10,11
ATLL associated with HTLV-1 is very rare in Asian countries except Japan.4 One of the unique findings in the distribution of
non-HL in Korea is the high frequency of extranodal MZBCL associated with Helicobacter pylori infections. Korea has the high-est prevalence of H. pylori infections. A nationwide survey con-ducted in Korea in 1998 on the serologic prevalence of H. pylori concluded that the overall seroprevalence of H. pylori infection was 46.6%, and dichotomized this to 17.2% among children (<16 years), and 66.9% among adults (>16 years).12
The present study has limitations because the lymphoid neo-plasm presented in the bone marrow was missing. Such cases are usually not submitted to the surgical pathology department in most hospitals in Korea and the real incidence of bone mar-row origin tumors such as lymphoblastic leukaemia/lymphoma and multiple myeloma should be underestimated. Aside from these limitations, our data are collected from all hospitals where the hematopathologists diagnose cases and the results represent the current status of lymphoma subtypes in Korea.
In conclusion, the relative frequency of malignant lymphoma in Korea was not significantly changed and shows similarities with a previous nationwide study performed in 1998. Never-theless, there were slight differences in the relative frequency of some subtypes, which may be caused by refined diagnostic cri-teria or a change of national healthcare policy. A population-based epidemiologic study would be helpful to determine the true incidence of malignant lymphoma subtypes.
REFERENCES
IARC -19.2.2011. Lyon: International Agency for Research on Can-cer, 2010. 2. Swerdlow S, Campo E, Harris NL, et al. WHO classification of tu-mours of haematopoietic and lymphoid tissues. 4th ed. Lyon: IARC Press, 2008. 3. Wang JF, Wang YZ, Chen ZW, Taylor RC. Prevalence of lymphoma subtypes in Shanxi according to latest WHO classification. Zhong-hua Bing Li Xue Za Zhi 2006; 35: 218-23. 4. The world health organization classification of malignant lympho-mas in Japan: incidence of recently recognized entities. Lymphoma Study Group of Japanese Pathologists. Pathol Int 2000; 50: 696-702. 5. Sukpanichnant S. Analysis of 1983 cases of malignant lymphoma in Thailand according to the World Health Organization classification. Hum Pathol 2004; 35: 224-30. 6. Kim CW, Kim I, Ko YH, et al. Clinicopathologic and immunophe- notypic study of non-Hodgkin’s lymphoma in Korea. Lymphore-ticular Study Group of the Korean Society of Pathologists. J Korean Med Sci 1992; 7: 193-8. 7. Yoon SO, Suh C, Lee DH, et al. Distribution of lymphoid neoplasms in the Republic of Korea: analysis of 5318 cases according to the World Health Organization classification. Am J Hematol 2010; 85: 760-4. 8. Ko YH, Kim CW, Park CS, et al. REAL classification of malignant lymphomas in the Republic of Korea: incidence of recently recog- nized entities and changes in clinicopathologic features. Hemato-lymphoreticular Study Group of the Korean Society of Pathologists. Revised European-American lymphoma. Cancer 1998; 83: 806-12. 9. Jaffe ES, Harris NL, Stein H, Vardiman JW. Pathology and genetics of tumours of haematopoietic and lymphoid tissues. Lyon: IARC Press, 2001. 10. Chen WL, Tsai WC, Chao TY, et al. The clinicopathological analysis of 303 cases with malignant lymphoma classified according to the World Health Organization classification system in a single insti-tute of Taiwan. Ann Hematol 2010; 89: 553-62. 11. Lee MY, Tan TD, Feng AC, Liu MC. Clinicopathological analysis of 598 malignant lymphomas in Taiwan: seven-year experience in a single institution. Am J Hematol 2006; 81: 568-75. 12. Kim JH, Kim HY, Kim NY, et al. Seroepidemiological study of Heli-cobacter pylori infection in asymptomatic people in South Korea. J Gastroenterol Hepatol 2001; 16: 969-75.