저작자표시-비영리-변경금지 2.0 대한민국 이용자는 아래의 조건을 따르는 경우에 한하여 자유롭게 l 이 저작물을 복제, 배포, 전송, 전시, 공연 및 방송할 수 있습니다. 다음과 같은 조건을 따라야 합니다: l 귀하는, 이 저작물의 재이용이나 배포의 경우, 이 저작물에 적용된 이용허락조건 을 명확하게 나타내어야 합니다. l 저작권자로부터 별도의 허가를 받으면 이러한 조건들은 적용되지 않습니다. 저작권법에 따른 이용자의 권리는 위의 내용에 의하여 영향을 받지 않습니다. 이것은 이용허락규약(Legal Code)을 이해하기 쉽게 요약한 것입니다. Disclaimer 저작자표시. 귀하는 원저작자를 표시하여야 합니다. 비영리. 귀하는 이 저작물을 영리 목적으로 이용할 수 없습니다. 변경금지. 귀하는 이 저작물을 개작, 변형 또는 가공할 수 없습니다.
Master’s Thesis of Science
Visual stimuli of foods increase
academic performance and create high
beta and gamma EEG oscillations.
식품의 시각적 요소의 하이베타, 감마 파워
증가 및 학업 성취도 향상 효과
February, 2018
By
June Lee
Department of Agricultural Biotechnology
Seoul National University
Visual stimuli of foods increase
academic performance and create high
beta and gamma EEG oscillations.
식품의 시각적 요소의 하이베타, 감마 파워 증가
및 학업 성취도 향상 효과
지도 교수 이 기 원
이 논문을 이 준의 석사 학위논문으로 제출함
2018 년 02 월
서울대학교 대학원
농생명공학부 바이오모듈레이션 전공
이 준
이 준의 석사 학위논문을 인준함
2018 년 02 월
위 원 장 : 서 정 용 (인)
부위원장 : 이 기 원 (인)
위 원 : 안 용 준 (인)
ii
Abstract
Food and cooking have long been widely used as educational tools (McAfee, 1974); however, they have focused on cooking and pre-school children which causes too many limitations for wide use (Caraher, Michelle, & Seeley, 2010). There is too little scientific background and evidence to prove the efficacy of food in education (Caraher, Michelle, & Seeley, 2010).
This study is designed to scientifically evaluate how food as concepts and visual stimuli are effective for learning science. In this study, 99 people were collected in total from four middle schools in Suwon city. Every participant was in the first grade of the middle school with normal visual activity, hearing ability and motor activity. Participants only visited the laboratory on one occasion. The participants with a BMI over 23 were excluded from the study and all food intake was prohibited for two hours before the experiment. First, participants were divided into three groups: a control group, an experimental group and an active control group. Grouping was conducted such that each group had a similar level of scientific attitude and knowledge of “heat energy and temperature” as determined by testing with Test of Science-Related Attitudes(TOSRA) and a pre-knowledge test. After grouping, brain waves were recorded by EEG methods while participants watched education videos. Film clips for experimental group had many pictures of food to explain “heat energy and temperature” in opposition to the two other groups. After learning, participants submitted a Course Interest Survey(CIS) and post-knowledge test.
In conclusion, the experimental group showed a high frequency of “high beta and gamma” EEG oscillations, which are considered as complex mental activities. Those correlated with the results of CIS and the comparison of pre and post knowledge tests. The experimental group had especially improved their academic performance indifficult problem solving situations. In summary, visual stimuli and concepts of food can be effective tools in adolescents’ science education.
Key words: Visual stimuli, Food, Academic performance, High beta, Gamma, EEG
iv
Table of Contents
Chapter 1. Introduction ... 1
1.1 Educational Effects of Food
... 11.2 My hypotheses
... 2Chapter 2. Materials and Procedures ... 3
2.1 Participants
... 52.2 Grouping
... 62.3 Test of Science-Related Attitudes (TOSRA)
... 72.4 Film Clips
... 82.5 Course Interest Survey (CIS)
... 102.6 Pre-and-Post Knowledge Tests
... 112.7 Electrophysiological Recordings
... 12Chapter 3. Results ... 15
3.1 Comparison of pre-and post-knowledge tests
... 163.2 Test of Science-Related Attitudes (TOSRA) Scores
... 203.3 Course Interest Survey (CIS) Scores
... 213.4 Relative High Beta Power Spectrum
... 223.5 Relative Gamma Power Spectrum
... 24Chapter 4. Discussion ... 26
Reference ...………..28
Chapter 1. Introduction
1.1 Educational Effects of Food
Food and cooking have long been applied in educational fields (McAfee, 1974). Based on an extensive review of education, many researchers have investigated that food and cooking are great for raising children’s confidence, creativity and scientific attitudes (Boals, 1992). Numerous research papers have shown the educational effects of food there was no result that evaluated the effects of food scientifically (Caraher, Michelle, & Seeley, 2010).
However, teachers and educational researchers, have focused on “pre-school children” and “cooking” to understand the efficacy of food in learning and most classes were taught to children under six years old (Partridge, Austin, Wadlington & Bitner, 1996). Children were led to touch, smell, and taste food ingredients and make some simple menu items such as sandwiches (Partridge, Austin, Wadlington & Bitner, 1996). Since cooking classes need numerous facilities and cookware, they were limitedly conducted to teach students (Partridge, Austin, Wadlington, & Bitner, 1996). In addition, cooking classes demand significant time compared to most school classes (McGee, 2007). The two factors of the expensive setting and significant time requirement have prohibited food in education from being used in middle schools and high schools (Levy, Joshua, & Garry Auld, 2004).
2
1.2 My hypotheses
The hypotheses of the study are follows.
H1. The educational effect of food and cooking can be evaluated by scientific
and objective methods.
H2. Food can be a good tool in science education among adolescents.
H3. Without cooking, only using stimuli (concepts) of food as examples in education raises learners’ achievements and satisfaction.
Both conventional methods and neuro-physiological methods were used to evaluate the efficacy of food in education (Hersch, Derek, 2014). Pre- and post tests and surveys were used as conventional methods and EEG was used as a neuro-physiological method (Lewis, Gregory, David & Ryan-Jones, 1998). The study participants were middle school students. In this study, participants were only taught by film clips. Participants could observe pictures of foods, but they could not touch, smell or taste the foods.
Chapter 2. Materials and Procedures
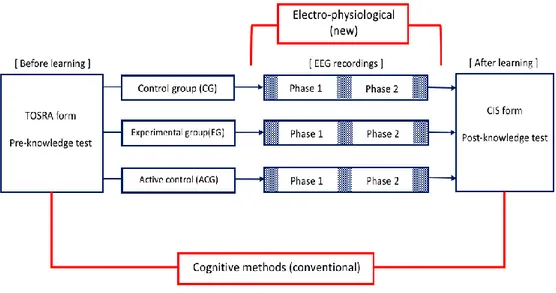
The table above shows the study’s experimental design. After informing and agreeing signatures, Test of Science-Related Attitudes (TOSRA) and pre-knowledge tests were conducted to place subjects into three groups. After grouping, students were directed to watch film clips and their EEGs were recorded simultaneously. The EEG recordings were about 15 minutes long and students closed and opened their eyes repeatedly, which the researcher noted. After watching the video and recording the EEG, students submitted CIS and post-knowledge tests that led them to evaluate the efficacy of the film clips. It usually took subjects one hour to go from the experiments’ first step to its final step. All experiments took place in the XO Center of the Advanced Institutes of Convergence Technology (AICT).
4
Figure 1 In this study, both conventional methods and electro-physiological methods were used in experimental design. For cognitive methods, Test of Science-Related Attitudes and Course Interest Survey are used. For electro-physiological methods, EEG oscillations are used.
2.1 Participants
In this study, 99 people (44 males and 45 females) were recruited from four middle schools in Suwon city. Every participant was in the first grade of middle school aged 1213 with normal visual activity, hearing ability, and motor activity. All participants were voluntarily involved in the study and they received the reward $5 and a free stress checking service.
All subjects provided informed consent before the experimental procedure, and the study was approved by the Institutional Review Board (IRB No. 1705/002-005) at Seoul National University, Korea. Participants only visited the laboratory on one occasion. Participants with BMI greater than 23 were excluded from the study and any food intake was prohibited for two hours before the experiment.
All participants in each group were involved in the same experimental design. Participants were instructed about the experiment’s fundamental principles and the procedures. In a quiet room, each participant was instructed to sit on a comfortable armchair with a neutral shoulder position and the elbow at 90 flexion front of a 56-inch wide monitor to watch the introductions and stress evoking film.
6
2.2 Grouping
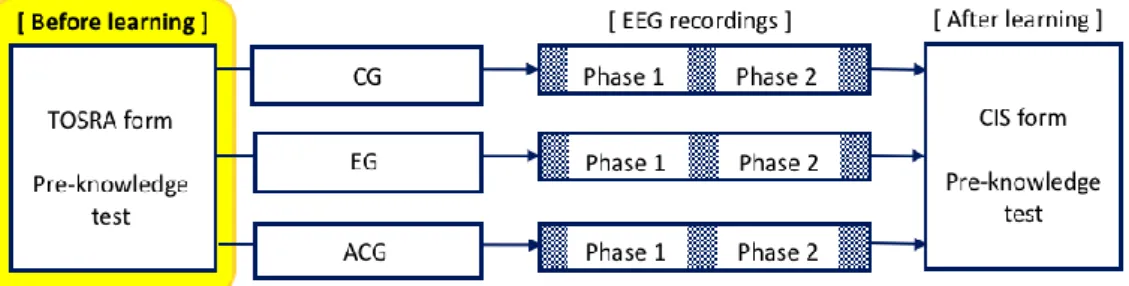
Figure 2 To eliminate all kinds of variables without film clips, Test of Science-Related Attitudes (TOSRA) and Pre-knowledge test were conducted. Synthesizing scores of TOSRA and Pre-knowledge test, subjects were divided into three groups.
Grouping was conducted such that each group had a similar level of scientific attitude and knowledge of the “heat energy and temperature” chapter. Students’ scientific attitudes were evaluated using TOSRA form after translation into Korean. In addition, students’ levels of knowledge of the chapter about which they would be educated was checked by applying a pre-knowledge test.
After taking the TOSRA and pre-knowledge test, subjects were separated by their total scores for those two tests. Therefore, each group had 33 participants; the control group (Group 1) included 16 males and 17 females, the experimental group (Group 2) included 17 males and 16 females and the active control group (Group 3) included19 males and 14 females.
2.3 Test of Science-Related Attitudes (TOSRA)
In this study, we evaluated participants’ attitudes toward science as a control variable and used Test of Science-Related Attitudes (TOSRA) to evaluate it (Koballa, 1988). TOSRA is designed to measure seven distinct science-related attitudes which were recorded by Likert-type scales among students (Fraser, 1981). The scales were composed of the Social Implications of Science, Normality of Scientists, Attitude to Scientific Inquiry, Adoption of Scientific Attitudes, Enjoyment of Science Lessons, Leisure Interest in Science, and Career Interest in Science (Fraser, 1981). The seven scales are suitable for group administration and all can be administered in ordinary class lessons (Fraser, 1981). Furthermore, TOSRA has been used since the 1970s and has been shown to be high reliability (Fraser, 1981).
It was noted that TOSRA could be used by teachers or researchers to observe students’ progress towards achieving attitude aims (Fraser, 1981). It could be conducted at one specific time or could involve changes in attitudes that occur over time. A great advantage of TOSRA is that it yields a separate score for several distinct attitudinal aims instead of a single overall score. This study used all 70 questions from the original form of TOSRA form which were translated into Korean. Some questions were transformed into the experimental environments.
8
2.4 Film Clips
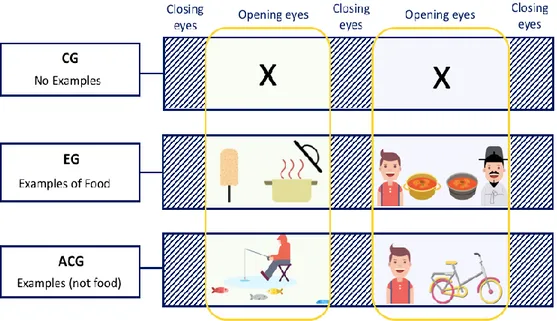
Figure 3 Control group (CG) watched film clip without any example, experimental group watched film clip with many examples of food, active control group watched film clip with many examples but not food. All film clips explain the same scientific concepts. Film clip for the control group is 5’ 30’’ minutes long and film clips for the experimental group and active control group are 8’ minutes long.
This study uses three types of film clips; film #1 was for the control group, film #2 was for the experimental group, and film #3 was for the active control group. All film clips were about the “heat energy and temperature” chapter in the standard science textbook for middle school students.
In detail, all film clips were composed of two parts; the first part was about “heat energy” and the second was about “temperature.” After students had watched the first part of the film clip, they were directed to close their eyes for three minutes. After whichstudents watched the second part of the video.
Film #1 was 5 minutes and 40 seconds long without any examples to explain the scientific concepts. Film #2 was eight minutes long and had many examples of food such as “fried ice-cream” and “Korean BBQ.” Film #3 was also eight minutes long and included various examples such as “bicycles” and “fishing” but no examples of food. The examples in films #2 and #3 were used to help students understand the scientific concepts involving “heat energy and temperature.”
10
2.5 Course Interest Survey (CIS)
According to reviews of the motivational literature that led to a clustering of motivational concepts based on their shared attributes, Keller (1979, 1983b) found they could be sorted into four categories.
Course Interest Survey (CIS) is a measurement tool that can be used in conjunction with the ACRS model (Keller, 1987). CIS was composed of four Likert-type sub-scales which were attention, relevance, confidence, and satisfaction. It was created to estimate students’ reactions to instructor-led instruction (Keller & Subhiyah, 1993). The great advantage of CIS was that it is a situation specific self-report that could be used to evaluate students’ motivational attitudes in the context of virtually any delivery system, unlike most surveys (Keller & Subhiyah, 1993).. Therefore, it can be used in face-to-face classroom instruction and in both synchronous and asynchronous online courses (Keller & Subhiyah, 1993).
As situational instruments, CIS does not have the purpose of measuring learners’ general levels of motivation toward school learning, which means that it measures how motivated students are with respect to a particular course (Keller & Subhiyah, 1993). This can be changed to fit the specific situation that is being assessed, such as “this lecture” “this computer-based instruction or “this workshop” (Keller & Subhiyah, 1993). This study asked 34 questions in total,
which was the same number as the original test, and these were translated into Korean (Keller & Subhiyah, 1993).
2.6 Pre-and-Post Knowledge Tests
This study, pre-knowledge tests were used to compare students’ scores between before and after education. These two tests were composed of 10 questions asking “heat energy and temperature” which the film clips explained for subjects. These questions were from Lee’s original research paper two kinds of textbooks from “Chunjae kyoyook” and “Daegyo.”
The two test forms were almost the same, but had minor changes to prohibit students’ cheating. The questions included three levels: easy, standard and high. Easy-level questions involved four problems. Standard-level questions involved four problems and high-level questions involved two problems. The easy-level of questions were three multiple choice and one short-answer question. The standard-level questions were all multiple choice, and the high-level questions were one multiple choice and one basic descriptive type.
12
2.7 Electrophysiological Recordings
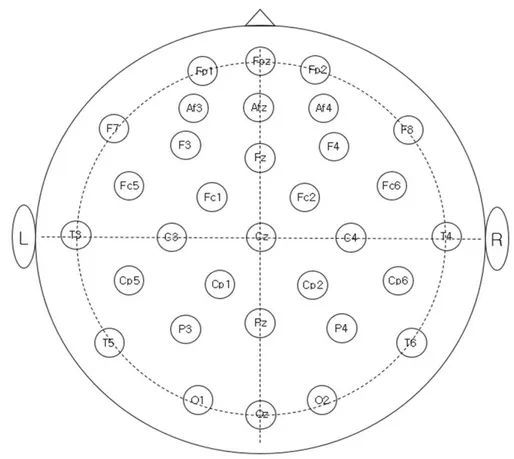
Figure 4 Location of 32 electrodes based on 10/20 system. Prefrontal regions (Fp1, Fp2) and frontal regions (F3, F4) were regions of interest. High beta EEG oscillations (23-35 Hz) in these area were analyzed to measure stress related signal, and theta EEG oscillations (4-7 Hz) were analyzed to measure working memory-related signals.
Electroencephalography (EEG) is the measurement of potentials that reflect the human brain’s electrical activities (Gasser, Theo, et al). It is an available method that provides evidence of how the brain functions over time. EEGs are widely used in hospitals and by scientists to study brain functions and to diagnose neurological disorders.
The history of electroencephalography (EEG) began in the late 1800s after a German neuro-psychiatrist called Hans Berger invented it. EEG has increasingly led to clinical, experimental, and computational studies since it has enabled the observation, understanding, recognition, diagnosis, and treatment of neurophysiological abnormalities and critical illnesses in the brain and spinal cord.
Neuro-education is a field of study that converges neuroscience, psychology, and pedagogy. Some researchers refer this field “mind, brain and education” or “educational neuroscience”. There are various reasons for this international drive to forge tighter bidirectional links between neuroscience and education. Most importantly, many educational researchers agreed that objective and more scientific evaluation of the educational effects is required.
There are various types of measurement for describing brain activities, such as: fMRI, NIRS, and PET; however, EEG is the most appropriate tool in education. More specifically, EEG and ERP allow extremely high temporal resolution, which reflects simultaneous changes in brain electrodes and behaviors. Unlike
14
EEGs, FMRI and PET show great performance for location resonance as they provide better spatial resolution and whole brain coverage. Moreover, researchers could spend a reasonable amount to set up EEG measurement capabilities, whereas utilizing FMRI and PET facilities is much more expensive.
A 32-channel EEG system (WEEG 32a) and customized EEG-based real-time brain mapping software (Telescan, LAXTHA Inc., Korea) were used to acquire data on cortical activity in the regions of interest (ROI) during the experiment. Scalp electrodes (Ag-AgCl) on specific locations were used for detection according to an extended 10/20 system. The procedure was conducted in an electrically shielded and sound attenuated experimental room; 32 scalp sites including Fz, Cz, and Pz were recorded using an electrode cap (ECI. Inc., USA) and all scalp electrodes were referred to linked electrodes placed on the left and right mastoids (right-reference, left-ground). Eye movements and blinks were eliminated by the EOG filtering system and impedance was maintained at 10 kΩ or less. The EEG was recorded continuously with 0.7-46 Hz analogue band-pass and a 256 Hz sampling rate. After data collection, the EEG was segmented into 16 bits with respect to event markers. The epochs were baseline-corrected, and those contaminated with artifacts were rejected prior to averaging. The threshold for artifact rejection was ±90 µV (EOG-filtering) in all channels. The epoch was averaged for the target and standard stimulus separately.
EEG signals were divided into seven categories: delta, theta, alpha, SMR, middle beta, high beta, and gamma.
Chapter 3. Results
Male
Female
Total
Control group
17
16
33
Experiment group
16
17
33
Active control group
19
14
33
Total
52
47
99
Table 1 Total 99 subjects were recruited in the study. Control group had 33 participants, experiment group had 33 participants and active control group had 33 participants.
Male
Female
Total
Control group
14
12
26
Experiment group
15
12
27
Active control group
13
12
25
Total
42
36
78
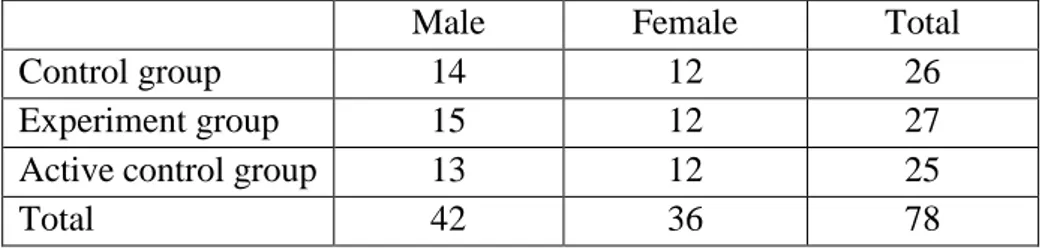
Table 2 In the study, 78 subjects' data were analyzed. Subjects who have dozed during EEG recordings and who did not write down all problems of questionnaires were deleted from the analysis.
16
3.1 Comparison of pre-and post-knowledge tests
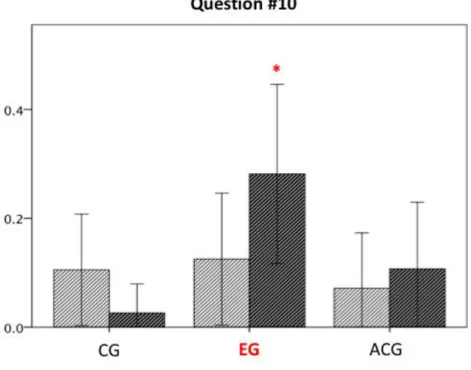
Figure 5 Experimental group showed high performance on question number 10. Question number 10 was short-answer question which was the highest level from the pre-post knowledge.
In the study, subjects got one point for each question they answered correctly. In questions that required that a short or descriptive answer, some subjects obtained 0.5 points when they answered with minor errors. In the situation in which a participant checked the wrong answer for multiple choices or did not write anything for a short answer question or descriptive problem, they got 0 points. Therefore, the maximum point score was 10 and the minimum was 0.
18 CG EG ACG Question #2 * * * CG EG ACG Question #3 * * CG EG ACG Question #5 * * *
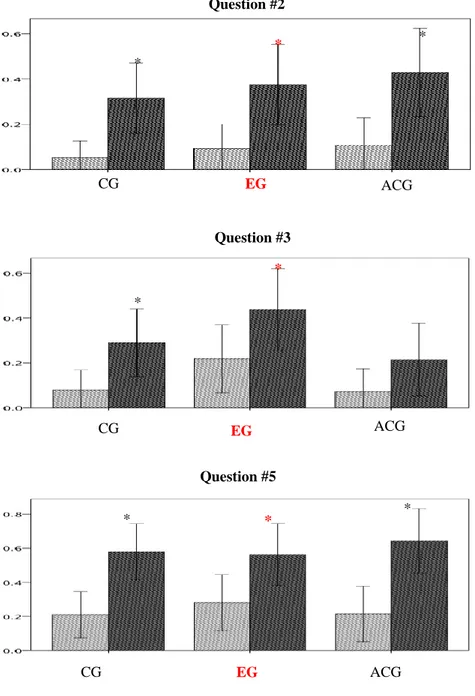
Figure 6 Question number 2, 3 and 5 were all multiple choice questions. They were all easy level. In question number 2 and 5, all groups had significant difference from pre-knowledge test and post-knowledge test. In question number 3, only experimental group and control group showed significant difference from pre-knowledge test and post-knowledge test.
The scores of pre-and post-knowledge tests were compared by groups using paired t-tests for each question in SPSS (IBM Inc., USA). There were significant differences in four questions between the pre-and post post-tests: Questions#1, #2, #5, and #10. Questions#1, 2, and 5 were easy level and Qustion#10 was high level. In Questions#1, #2 and #5, all groups had significant increases after watching the film clips. Compared to those problems, only the experimental group showed a significant increase for Question #10 after watching the video that had numerous examples of food.
20
3.2 Test of Science-Related Attitudes (TOSRA) Scores
The TOSRA form was conducted to check each participant’s attitudes toward science. This data was used to decrease variables without different education programs. Subjects were separated into different group considering to their TOSRA scores. Each group has similar standard TOSRA scores that there was no difference of attitudes toward science between groups.
Sub-scales # of questions Reliability (cronbach’s α) Social implications of science 10 0.678 Normality of scientists 10 0.718 Attitude to Science Inquiry 10 0.779 Adoption of scientific attitudes 10 0.711 Enjoyment of science lessons 10 0.925 Leisure interest in science 10 0.748 Career interest in science 10 0.631
Total 70 0.940
3.3 Course Interest Survey (CIS) Scores
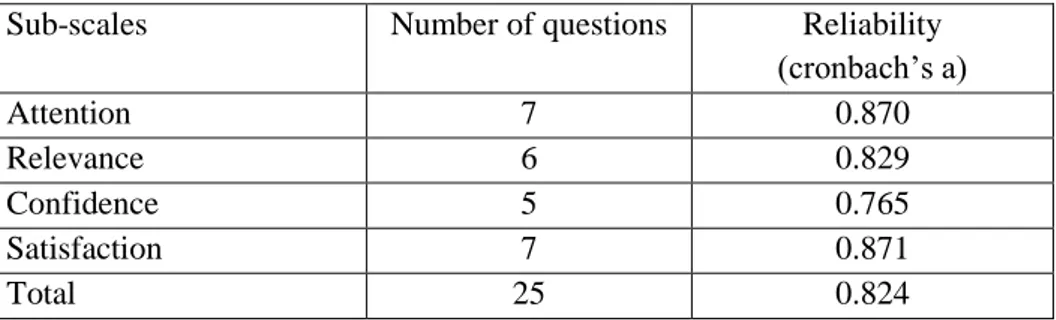
Table 4 The table shows the a reliability of Course Interest Survey in this study.
The CIS scores were analyzed after categorizing questions into four sub-scales: attention, relevance, confidence and satisfaction. The points of questions were added according to each sub-scale, and scores were analyzed by groups after calculating each sub-scale’s points and total scores.
There were no significant differences between the three groups in the sub-scales of attention, relevance, and confidence; however, the experimental group showed significantly high scores compared to the two other groups in the sub-scale of satisfaction.
Sub-scales Number of questions Reliability (cronbach’s a) Attention 7 0.870 Relevance 6 0.829 Confidence 5 0.765 Satisfaction 7 0.871 Total 25 0.824
22
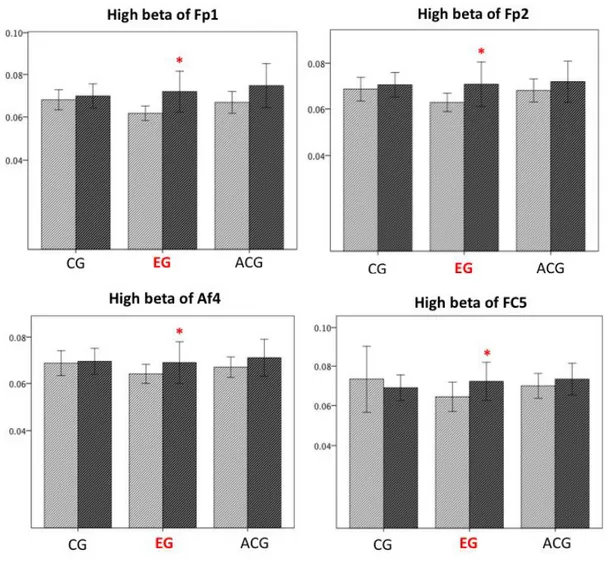
3.4 Relative High Beta Power Spectrum
Figure 7 Fp1, Fp2, Af4 and FC5 are the electrode channels located in pre-frontal lobe and frontal lobe. In these four locations, there were significant difference of high beta from baseline to being educated only in the experimental group.
I analyzed the high beta EEG oscillation to measure the high level of concentration. High beta (20-30 Hz) data in the prefrontal cortex were analyzed because it was related to high brain activities and concentration. The high beta activity in the prefrontal region was analyzed to examine whether high beta activation increased when watching education film clips, particularly among the experimental group. High beta activity significantly increased in the prefrontal area while watching the video (p<0.05).
24
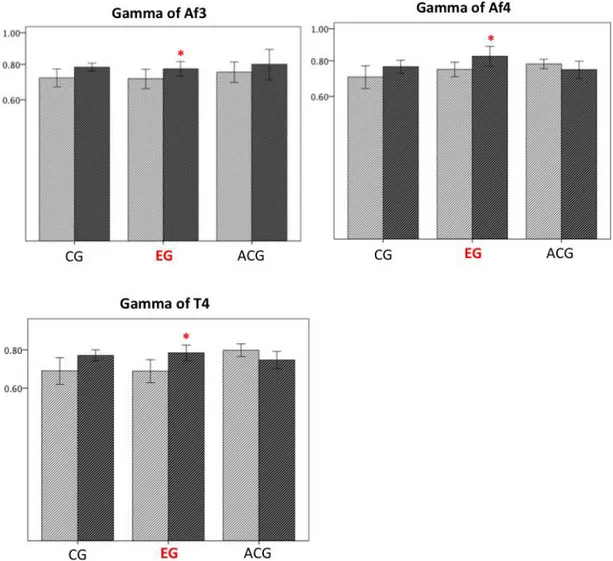
3.5 Relative Gamma Power Spectrum
Figure 8 In channel of Af3, Af4 and T4, there were significant difference from pre-education and being educated situation only in experimental group.
I analyzed the gamma EEG oscillation to measure the high level of concentration. Gamma (30-50 Hz) data in the prefrontal cortex were analyzed since they were related to high brain activities and concentration. The gamma activity in the prefrontal region was analyzed to examine whether gamma activation increased when watching education film clips, especially among the experimental group. Gamma activity significantly increased in the prefrontal area while watching the video (p<0.05).
26
Chapter 4. Discussion
The relatively high beta and gamma power were the highest frequency brain waves and refer to high brain activity; but frontal lobe is related to learning abilities. Therefore, the high beta and gamma in the frontal lobes were mainly analyzed in this study. While analyzing the high beta, the experimental group showed significant high levels in the frontal lobe. Analyzing the gamma, the experimental group showed significantly high levels in the frontal and right-temporal lobes.
In conclusion, cognitive measurements which were CIS and the comparison of pre-and post knowledge tests and EEG methods explained the same message that experimental group differed significantly from the other two groups. Therefore, using food stimuli in education is effective in adolescents and its efficacy can be evaluated by scientific methods.
The study has some limitations. First, only 78 participants’ data were analyzed, even though 99 subjects were collected in total from the beginning; students who dozed during the EEG recordings were eliminated from the final analysis. In addition, some students who missed too many questions in the surveys (TOSRA and CIS) were deleted. A small number of participants had lower reliability levels in the results of their pre-and post-knowledge tests for TOSRA and CIS. For further study, the study’s bigger sample size could be taken and there should be better control of dozing. Second, the film clip’s contents only
explained “heat energy and temperature” and the length of those films were less than 10 minutes. For further study, contents with different scientific concepts could be created and evaluated with a longer learning period.
28
Reference
1. Caraher, M., Michelle Wu, and A. Seeley. "Should we teach cooking in schools? A systematic review of the literature of school-based cooking interventions." Journal of the Home Economics Institute of Australia 17.1 (2010): 10-18.
2. Keller, John M. "Development and use of the ARCS model of instructional design." Journal of instructional development 10.3 (1987): 2-10.
3. Wongwiwatthananukit, Supakit, and Nicholas G. Popovich. "Applying the ARCS model of motivational design to pharmaceutical education." American Journal of Pharmaceutical Education 64.2 (2000): 188.
4. Keller, John M. "How to integrate learner motivation planning into lesson planning: The ARCS model approach." VII Semanario, Santiago, Cuba (2000): 1-13.
5. Altenmüller, Eckart, et al. "The impact of music education on brain networks: evidence from EEG-studies." International journal of music education 1 (2000): 47-53.
6. Bensalem-Owen, Meriem, et al. "Education Research: Evaluating the use of podcasting for residents during EEG instruction A pilot study." Neurology 77.8 (2011): e42-e44.
7. Van Cott, Anne, and Richard P. Brenner. "Technical advantages of digital EEG." Journal of clinical neurophysiology 15.6 (1998): 464-475.
8. Green, RICHARD M., et al. "Benefits, shortcomings, and costs of EEG monitoring." Annals of surgery 201.6 (1985): 785.
9. Levy, Joshua, and Garry Auld. "Cooking classes outperform cooking demonstrations for college sophomores." Journal of nutrition education and behavior 36.4 (2004): 197-203.
10. Hersch, Derek, et al. "Peer reviewed: the impact of cooking classes on food-related preferences, attitudes, and behaviors of school-aged children: a systematic review of the evidence, 2003–2014." Preventing Chronic Disease 11 (2014).
11. Lewis, Gregory W., and David L. Ryan-Jones. "Evaluation of a subject's interest in education, training and other materials using brain activity patterns." U.S. Patent No. 5,762,611. 9 Jun. 1998.
12. Lubar, Joel F., et al. "Evaluation of the effectiveness of EEG neurofeedback training for ADHD in a clinical setting as measured by changes in TOVA scores, behavioral ratings, and WISC-R performance." Applied Psychophysiology and Biofeedback 20.1 (1995): 83-99.
13. Rowland, N., M. J. Meile, and S. Nicolaidis. "EEG alpha activity reflects attentional demands, and beta activity reflects emotional and cognitive processes." Science 228.4700 (1985): 750-752.
14. Chapotot, Florian, et al. "High frequency waking EEG: reflection of a slow ultradian rhythm in daytime arousal." Neuroreport 11.10 (2000): 2223-2227. 15. Haenschel, Corinna, et al. "Gamma and beta frequency oscillations in response to novel auditory stimuli: a comparison of human electroencephalogram (EEG) data with in vitro models." Proceedings of the National Academy of Sciences 97.13 (2000): 7645-7650.
16. Harmony, Thalia, et al. "Correlation between EEG spectral parameters and an educational evaluation." International Journal of Neuroscience 54.1-2 (1990): 147-155.
17. Gola, Mateusz, et al. "EEG beta band activity is related to attention and attentional deficits in the visual performance of elderly subjects." International Journal of Psychophysiology 89.3 (2013): 334-341.
18. Gola, Mateusz, et al. "EEG beta band activity is related to attention and attentional deficits in the visual performance of elderly subjects." International Journal of Psychophysiology 89.3 (2013): 334-341.
19. Kropotov, Jury D., et al. "ERPs correlates of EEG relative beta training in ADHD children." International journal of psychophysiology 55.1 (2005): 23-34.
20. Lubar, Judith O., and Joel F. Lubar. "Electroencephalographic biofeedback of SMR and beta for treatment of attention deficit disorders in a clinical setting." Applied Psychophysiology and Biofeedback 9.1 (1984): 1-23. 21. Gevins, Alan, et al. "High-resolution EEG mapping of cortical activation related to working memory: effects of task difficulty, type of processing, and practice." Cerebral cortex (New York, NY: 1991) 7.4 (1997): 374-385.
22. Miyake, Akira, et al. "The unity and diversity of executive functions and their contributions to complex “frontal lobe” tasks: A latent variable analysis." Cognitive psychology 41.1 (2000): 49-100.
23. Barkley, Russell A., Gail Grodzinsky, and George J. DuPaul. "Frontal lobe functions in attention deficit disorder with and without hyperactivity: A review
30
and research report." Journal of abnormal child psychology 20.2 (1992): 163-188.
24. Barkley, Russell A., and Gail M. Grodzinsky. "Are tests of frontal lobe functions useful in the diagnosis of attention deficit disorders?." The Clinical Neuropsychologist 8.2 (1994): 121-139.
25. Zhang, Zhiqiang, et al. "Impaired attention network in temporal lobe epilepsy: a resting FMRI study." Neuroscience letters 458.3 (2009): 97-101. 26. Kimura, Doreen. "Some effects of temporal-lobe damage on auditory perception." Canadian Journal of Psychology/Revue canadienne de psychologie 15.3 (1961): 156.
27. Binder, Jeffrey R., et al. "Human temporal lobe activation by speech and nonspeech sounds." Cerebral cortex 10.5 (2000): 512-528.
28. Eichenbaum, Howard, Andrew P. Yonelinas, and Charan Ranganath. "The medial temporal lobe and recognition memory." Annu. Rev. Neurosci. 30 (2007): 123-152.
29. Nobre, Anna C., Truett Allison, and Gregory McCarthy. "Word recognition in the human inferior temporal lobe." Nature 372.6503 (1994): 260-263. 30. Gajraj, R. J., et al. "Analysis of the EEG bispectrum, auditory evoked potentials and the EEG power spectrum during repeated transitions from consciousness to unconsciousness." British Journal of Anaesthesia 80.1 (1998): 46-52.
31. Jung, Tzyy-Ping, et al. "Estimating alertness from the EEG power spectrum." IEEE transactions on biomedical engineering 44.1 (1997): 60-69. 32. Gasser, Theo, et al. "Development of the EEG of school-age children and adolescents. I. Analysis of band power." Electroencephalography and clinical neurophysiology 69.2 (1988): 91-99.
33. Howard, Marc W., et al. "Gamma oscillations correlate with working memory load in humans." Cerebral cortex 13.12 (2003): 1369-1374.
34. Lundqvist, Mikael, et al. "Gamma and beta bursts underlie working memory." Neuron 90.1 (2016): 152-164.
35. Roux, Frédéric, et al. "Gamma-band activity in human prefrontal cortex codes for the number of relevant items maintained in working memory." Journal of Neuroscience 32.36 (2012): 12411-12420.
36. Tallon-Baudry, Catherine, Andreas Kreiter, and Olivier Bertrand. "Sustained and transient oscillatory responses in the gamma and beta bands in
a visual short-term memory task in humans." Visual neuroscience 16.3 (1999): 449-459.
32
국문 초록
음식과 요리 활동은 교육 현장에서 오랜 기간 동안 교육의 도구로 활용되어 왔다(McAfee, 1974). 그러나 대부분의 경우, 음식 자체의 특성보다는 요리 활동 자체에 학습이 편중되어 있었고, 초등학교 저학년 혹은 미취학 아동들을 대상으로 하는 활동에 초점이 맞춰져 있었다(Caraher, Michelle, & Seeley, 2010). 또한, 음식과 요리 활동이 학생들의 창의력, 과학적 소양, 사고력 등 학습 능력을 증가시킨다는 많은 주장이 있었지만 이에 대한 객관적인 연구 결과가 부족한 실정이다(Caraher, Michelle, & Seeley, 2010).
본 연구는 식품 자체에 담긴 속성과 식품의 시각적 자극이 과학 학습에서 효과적인지를 증명하기 위해 고안되었다. 본 연구에서는 수원시 4 개 중학교에서 1 학년 총 99 명의 학생들을 연구 피험자로 모집했고, 모든 참가자는 정상적인 시각 활동, 청력 및 운동 능력을 지녔다. 또한, BMI 가 23 이상인 참가자는 연구에서 제외되었으며, 모든 음식 섭취는 실험 전 2 시간 동안 금지되었다. 실험 참가자는, 연구 장소에 총 1 회 방문하였다. 실험 참가자는 TOSRA (과학 관련 태도 시험) 및 사전 지식 테스트 (pre-knowledge test)를 통해 세 그룹으로 나뉘었다. 위 두 가지 테스트는 시험 자극 이외의 변수가 될 수 있는 과학 관련 태도와 사전 지식을 배제하기 위해 사용되었다. 이후, 실험참가자는 교육 동영상을 시청하며, 동시에 뇌파를 측정하였다. 실험 그룹을 위한 교육 동영상은 다양한 식품을 통해 ‘열과 에너지’를 설명하였으며, 통제 그룹을 위한 동영상에서는 아무런 예시 없이 동일 개념을 설명하였으며, 적극적 통제 그룹을 위한 동영상에서는 식품이
아닌 다양한 예시를 이용해 동일 개념을 설명하였다. 동영상 시청 후 실험 참가자들은 학습 만족도 조사 (CIS) 및 사후 지식 테스트를 제출했다. 결론적으로, 실험 그룹은 하이베타 및 감마 EEG 발진의 빈도가 높았으며, 이는 복잡한 정신 활동으로 간주되었다. 또한 이는 학습만족도 조사 (CIS)의 결과와 사전-사후 지식 테스트와 양의 상관 관계가 있다. 사전-사후 지식테스트 결과, 실험 그룹은 특히 어려운 문제 해결 상황에서 학업 성취도가 다른 그룹에 비해 높게 나타났다. 따라서, 본 연구는 식품의 시각적인 자극을 통해 효과적인 과학 학습을 고안하는데 도움을 줄 수 있다는 결론을 도출하였다.
Key words: Visual stimuli, Food, Academic performance, High beta, Gamma, EEG