Journal of Magnetics 22(2), 220-226 (2017) https://doi.org/10.4283/JMAG.2017.22.2.220
©2017 Journal of Magnetics
A Study on the Difference Method of Magnetic Resonance Signal Measurement
when Using Multi-channel Coil and Parallel Imaging
Kwan-Woo Choi1, Ho-Beom Lee1, Soon-Yong Son2, and Mi-Ae Jeong3*
1Asan Medical Center, 88, Olympic-ro 43-gil, Songpa-gu, Seoul 05505, Korea
2Wonkwang Health Science University, 514, Iksan-daero, Iksan-si, Jeollabuk-do 54538, Republic of Korea 3Department of Dental Hygiene, Kangwon National University, Samcheok 25913, South Korea
(Received 2 February 2017, Received in final form 21 April 2017, Accepted 24 April 2017)
SNR (signal to ratio) is a criterion for providing objective information for evaluating the performance of a magnetic resonance imaging device, and is an important measurement standard for evaluating the quality of MR (Magnetic Resonance) image. The purpose of our study is to evaluate the correct SNR measurement for multi-channel coil and parallel imaging. As a result of research, we found that both T1 and T2 weighted images show the narrowest confidence interval of the method recommended by NEMA (The National Electrical man-ufacturers Association) 1 having a single measurement method, whereas the ACR (American College of Radiol-ogy) measurement method using a multi-channel coil and a parallel imaging technique shows the widest confidence interval. There is a significance in that we quantitatively verified the inaccurate problems of a sig-nal to noise ratio using a ACR measurement method when using a multi-channel coil and a parallel imaging technique of which method does not satisfy the preconditions that researchers could overlook.
Keywords : magnetic resonance, signal to ratio, parallel technique
1. Introduction
Signal to noise ratio (SNR) is a criterion for providing objective information for evaluating the performance of a magnetic resonance imaging device, and is an important measurement standard for evaluating the quality of MR image [1, 2].
As the technology developed in the single channel coil at the beginning of development, multi-channel coils are used now, and the method of calculating the signals of various channels comprehensively, and the method of measuring SNR becomes complicated.
In parallel imaging, differential weighting of signals from multiple small surface coils are used to determine the spatial origin of the signal, thus reducing the need for time-consuming gradient-encoding steps. Most modern MR systems are built in a parallel architecture, consisting of a body transmit coil and set of local receiver coils that feed into parallel channels for signal amplification and processing (Fig. 1).
That is, if a parallel imaging technique is applied to reduce imaging acquisition time, SNR of image is declined by (The square root of acceleration factor) due to the loss of phase encoding signal. In order to compensate for this decline, the noise of image is amplified during the process of image reconstruction. The degree of amplification of noise may vary depending on the geometrical structure of an RF coil, and thus does not follow the conventional rician noise distribution any more [4, 7, 10-12].
©The Korean Magnetics Society. All rights reserved. *Corresponding author: Tel: +82-33-540-3391
Fax: +82-33-540-3399, e-mail: [email protected]
Fig. 1. Array coil systems are collections of small surface coils whose signals may be combined but generally feed into independent receiver circuitry.
MR equipment is managed by special medical equip-ment and medical law. All MR equipequip-ment installed in the domestic are commonly used for ACR (American College of Radiology) quality control method (Fig. 2). In the ACR MRI Quality Control Manual an SNR measurement method which uses a single image is suggested: the mean signal taken from a region of interest (ROI) in the central portion of the ACR phantom and the standard deviation (SD) from pixels located in the background of the image. Currently, most clinical institution in Korea use the ACR manual of SNR measurement method.
ACR method approaches used to acquire MR images produce a Rician noise distribution. However, with the implementation of multi-channel coil and parallel imaging the noise in MR images does not follow this distribution. Incorrect SNR calculation cannot be an index for inspecting performance of a magnetic resonance imaging device, and cannot be a reliable answer with respect to physical and biochemical characteristics and changes of lesions and tissues [13]. In addition, the information that can be obtained therefrom is reduced, and thus there is a difficulty in sensing lesions, which leads to a bad influence on diagnosis and treatment of patients.
The purpose of our study is to evaluate the correct SNR measurement for multi-channel coil and parallel imaging.
2. Materials and Methods
We compared and evaluated the calculated SNR by using ACR and NEMA (The National Electrical manu-facturers Association, hereinafter) methods recommen-dations. The recommended methods of NEMA are to compensate for the application of multi-channel and parallel imaging techniques.
2.1. Image acquisition
As an image acquisition device, we used a 3.0T super-conductive magnetic resonance imaging device (Achieva,
Philips medical system, Netherlands). As a single channel head coil for calculating the ACR method. We used 1 channel transmit receive head coil. As a multi-channel coil for comparing each method, we used 8 channel SENSE head coil. The standard T2, T1 technique of the ACR manual, which is currently defined as MR quality control, is used.
Regarding a parameter of images, in case of T1 weighted image, we used repetition time = 500 ms, echo time = 10 ms, slice thickness = 5 mm, gap = 2 mm, field of view = 230 mm, flip angle = 70, number of excitation = 1, and in case of T2 weighted image, we used repetition time = 3000 ms, echo time = 80 ms, slice thickness = 5 mm, gap = 2 mm, field of view = 230 mm, flip angle = 90, number of excitation = 1 in order to acquire an axial image of ACR phantom (J10470, J.M specialty, San Diego, CA.).
2.2. Image Evaluation methods
SNR was calculated by using the following formulas after measuring the signal intensity depending on each method by using Image J (Ver. 1.47v, NIH, USA), which is an image evaluation program. The SNR is determined by:
SNR =
1. ACR method : The mean signal taken from a ROI in the central portion of the ACR phantom and the standard deviation (SD) from pixels located in the background of the image
2. NEMA method 1 : To calculate the signal, the two images were added and divided by two to get an average image. Following this process, the average pixel value from a circular ROI that encompassed 75 % of the phantom volume was used as the signal.
Noise: To calculate noise, the two images were sub-tracted to produce a third image. An ROI of the same
S image noise ---Fig. 2. (Color online) ACR phantom and scanning the phantom.
geometry, which was used in the above signal calculation, was drawn in the subtraction image. The SD from this ROI was taken as the image noise where R is the average of an ROI, R(i, j) is an individual pixel within the ROI, and n and m are pixel numbers in the row and column direction At the time of measuring the signal intensity, ROI was set to 100 mm2.
3. NEMA method 2: This method used a single image to find signal and the non-signal image to find the noise. The average of an ROI encompassing 75 % of the signal producing volume of one of the acquired signal producing images was used as the signal. The noise computation was performed using data from the non-signal-producing image. On the MRI system used in this study, the signal was eliminated by setting the transmit RF coil voltage to 0 V. In other scanners, images without signal may be obtained by setting the flip angle to 0. The standard deviation of the ROI with the same geometry used to compute the signal was then measured on the non-signal image and divided by 0.66.
image noise =
4. NEMA method 3: The signal used was the average of an ROI encompassing 75 % of the signal-producing
region of the image. The Noise of four rectangular ROIs adding to a total of 1024 pixels were drawn outside of the phantom and away from any artifacts in the background of the image. The noise ROIs in both the frequency-encoding and phase-frequency-encoding directions were well removed from the signal-producing phantom(4) (Fig. 3).
2.3. Statistical Analysis
For statistical analysis method, we compared each relative standard deviation (RSD) which is divided by the average (Avg) of the standard deviation (SD) for direct comparison of the SNR calculated by each method. We prepared Blend–Altman plot according to each method based on ACR measurement method using a single channel coil to compare 95 % confidence interval (CIs). In case of Blend-Altman Plot, when the interval of 95 % Cis is narrower, the conformity degree with the ACR measurement method using the single channel coil is higher.
3. Results
In case of a relative standard deviation that is used as an index of the degree of precision and shows a high reproducibility as a value becomes smaller, the method recommended by NEMA 1 having a SNR measurement method shows a low relative standard deviation both in T2 and T1 weighted images, and thus shows a high degree of precision. On the other hand, ACR method at the time of using multi-channel coil and a parallel imaging technique shows the highest relative standard deviation both in T1 and T2 weighted images, and thus shows a low degree of precision.
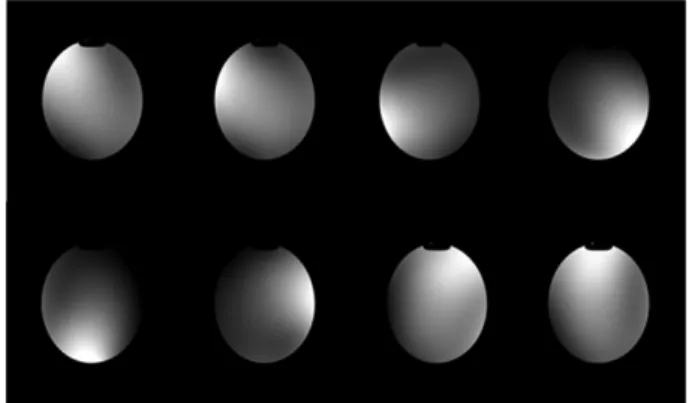
It can be understood that the method recommended by NEMA1 shows a spatially uniform noise distribution because the difference between SNR according to the location and a relative standard deviation is low just like a ACR measurement method using the single channel head coil. However, in case of ACR measurement method using a multi-channel coil and a parallel imaging technique, it can be understood that spatial noise distribution is not uniform because it shows the difference of a minimum of 34.02 % and a maximum of 176.60 % depending on the locations.
Regarding the measurement result of T2 weighted image, just like the measurement result of T1 weighted image, it can be understood that ACR measurement method using a single channel head coil and the method recommended by NEMA1 show spatially uniform noise distribution because the difference between SNR according to the location and a relative standard deviation is small. SD = Σi=0 n Σ i=1 m−1 V i, j+1( ) V i, j( ) – ( )2 2Σi=1n (mi–1) ---1 2 ---SD 0.66
---Fig. 3. (Color online) Method NEMA1 is the subtraction method. Method NEMA 2 is the no signal method, while ACR and NEMA3 are ACR method and the background method that NEMA recommends.
However, in case of ACR measurement method using a multi-channel coil and a parallel imaging technique, spatial noise distribution is not uniform because the method shows the difference of a minimum of 144.56 % and a maximum of 358.60 % depending on the locations (Tables 1, 2).
All of the above-referenced results well represent the problems of ACR measurement method using a multi-channel coil and a parallel imaging technique of which method does not satisfy the preconditions. In case of the methods recommended by NEMA, the methods show SNR value regardless of where a person who is measur-ing the target object locates ROI in order to measure the standard deviation of background. However, in case of ACR method using a multi-channel coil and a parallel imaging technique, it brings a big difference of SNR depending on where the ROI is located, thereby reducing reproducibility and accuracy according to the location which would result in inaccurate results.
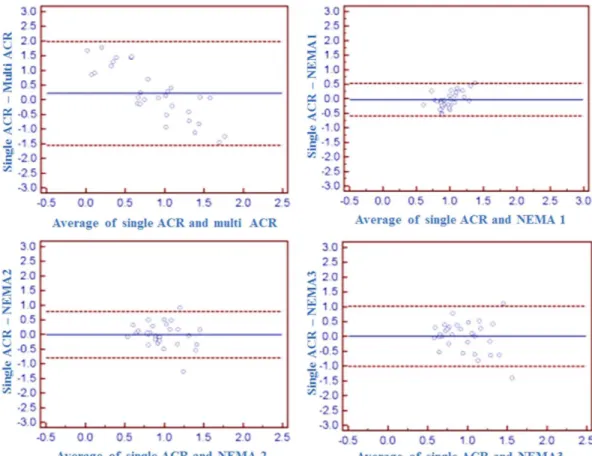
As can also be understood from Blend-Altman plot, as a result of preparing Blend-Altman plot according to each recommended method on the basis of ACR measurement method using a single channel head coil, and comparing 95 % confidence interval, we found that both T1 and T2 weighted images show the narrowest confidence interval of the method recommended by NEMA1 having a single measurement method, whereas the ACR measurement method using a multi-channel coil and a parallel imaging technique shows the widest confidence interval.
It means that as the interval of Blend-Altman plot becomes narrower, a criterion method and a conformity degree are high. Thus, the above results show that the method recommended by NEMA1 has the highest con-formity degree as compared to the ACR measurement method using the single channel head coil, and that the ACR measurement method using a multi-channel coil and a parallel imaging technique has the lowest conformity degree. This also well represents the problem of the ACR measurement method using a multi-channel coil and a parallel imaging technique of which method does not satisfy the preconditions.
4. Discussion
SNR is an object index for evaluating the performance of a magnetic resonance imaging device and the quality of image. Many researches in method of calculation have been conducted thus far [1, 2]. The ACR method is commonly used by clinical physicists in the field because it is considered to be the easiest and quickest measure-ment. However, owing to the development of hardware and software of a magnetic resonance imaging device, a multi-channel coil and a parallel imaging technique have been introduced, and they have influenced the spatial distribution of noise. Due to this, at the time of using a multi-channel coil and a parallel imaging technique, the accuracy of a ACR measurement method has been reduced [7-12].
NEMA methods have recognized the above-mentioned problems, and separately recommended an SNR measure-ment method at the time of using a multi-channel coil and a parallel imaging technique. Individually, Olaf Dietrich et al. [4] and Michael C et al. [9] compared an SNR measurement method and a self-developed SNR measure-ment method according to the Reconfigurable Filter at the time of using a multi-channel coil and a parallel imaging technique with the conventional method. However, the methods recommended by NEMA and the research methods of Olaf Dietrich et al. [4] and Michael C et al. [9] merely recommend the measurement methods determined by the pertinent institutions without offering any quantitative material for the problems of a ACR measurement method that arises when applying a multi-channel coil and a parallel imaging technique and providing any direct relative comparison.
Furthermore, these methods do not even mention what problem could arise when researchers use ACR measure-ment method as a general practice in researches using a multi-channel coil and a parallel imaging technique as an experimentally simple comparative research for the Table 1. SNR measurement of single channel head coil.
Single channel
Pulse sequence Method SNR
Avg SD RSD
T2 weighted image ACR 152.62 9.89 6.48 T1 weighted image ACR 433.19 40.71 9.40 Table 2. SNR measurement of 8-channel head coil.
Multi 8-channel Pulse sequence Method SNR Avg SD RSD T2 weighted image ACR 356.74 104.81 29.38 NEMA 1 109.40 3.65 3.34 NEMA 2 255.95. 33.32 6.80 NEMA 3 356.74 84.61 20.68 T1 weighted image ACR 552.46 161.32 29.20 NEMA 1 293.11 13.27 4.53 NEMA 2 154.27 29.79 15.34 NEMA 3 552.46 129.79 25.34
researches of themselves.
In this regard, in the present study, we quantitatively compared the methods that are suggested for the calcu-lation of SNR performed in ACR, NEMA organizations except individual researches. In the present study, we aimed at figuring out the problems of ACR measurement method that is conventionally used when using a multi-channel coil and a parallel imaging technique.
As a result of research, we found that a ACR measure-ment method using a multi-channel coil and a parallel imaging technique shows the highest relative standard deviation both in T1 and T2 weighted images, and thus shows a low degree of precision. Furthermore, it can also be understood that as to the difference of SNR according to ROI location for obtaining the standard deviation of noise, a ACR measurement method using a multi-channel coil and a parallel imaging technique does not show a spatially uniform noise distribution because it shows the difference of a minimum of 34.02 % and a maximum of 176.60 % in T1 weighted image and the difference of a minimum of 144.56 % and a maximum of 358.60 % in T2 weighted image. The above-referenced results well represent the problems of ACR measurement method using a multi-channel coil and a parallel imaging technique
of which method does not satisfy the preconditions. This can also be understood from Blend-Altman plot. It can be understood that 95 % confidence interval of ACR measurement method using a multi-channel coil and a parallel imaging technique is the widest, and thus that the conformity degree with ACR measurement method using the single channel head coil is low (Figs. 4, 5).
There was a limit to the progress of the present study. Many researches [4, 13, 16-18] have presented a replace-able SNR measurement method for supplementing a limit to the ACR measurement method and measuring a more accurate SNR. However, it was a self-developed indivi-dual research method. Furthermore, each of the replace-able methods also has limits and requirements to be applied to all of the parallel imaging technique and the reconstitution method [4]. For this reason, we compared only the measurement methods of NEMA organizations.
However, by directly comparing an SNR calculation method [19] presented by ACR manual, which serves as a standard of a performance evaluation test of a magnetic resonance imaging device under the same image acqui-sition conditions and an SNR calculation method [20] using the difference of neighbor pixels of NEMA1 which can accurately determine the noise level in a signal region
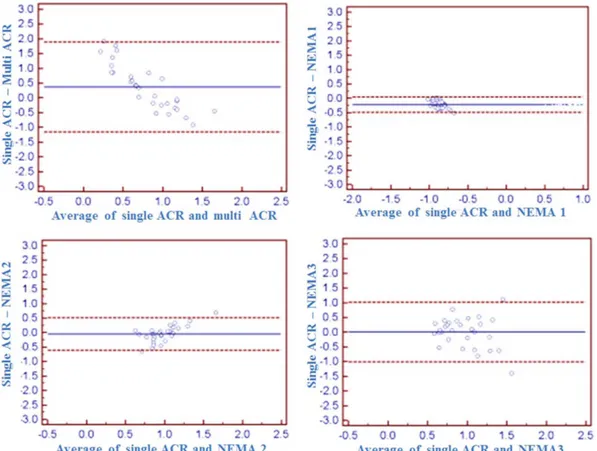
Fig. 4. (Color online) Blend-Altman plots showing the agreement with ACR measurement method using the multi-channel head coil in the T2 weighted image.
throughout a noise region for covering a wide range, a non-uniform image and an artifact region with the methods recommended by manufacturers of a magnetic resonance imaging device, there is a significance in that we quantita-tively verified the problems of a ACR measurement method using a multi-channel coil and a parallel imaging technique of which method does not satisfy the pre-conditions that researchers could overlook.
5. Conclusion
There is a significance in that we quantitatively verified the problems of a ACR measurement method using a multi-channel coil and a parallel imaging technique of which method does not satisfy the preconditions that researchers could overlook.
The recommended method of NEMA 1 is to com-pensate for the application of multi-channel and parallel imaging techniques.
References
[1] D. W. McRobbie, Br. J. Radiol. 69, 827 (1996).
[2] M. Firbank, A. Coulthard, R. Harrison, and E. Williams, Phys. Med. Biol. 44, 12 (1999).
[3] L. Kaufman, D. M. Kramer, L. E. Crooks, and D. A. Ortendahl, Radiology 173, 1 (1989).
[4] O. Dietrich, J. G. Raya, S. B. Reeder, M. F. Reiser, and S. O. Schoenberg, J. Magn. Reson. Imaging 26, 2 (2007). [5] P. M. Robson, A. K. Grant, A. J. Madhuranthakam, R.
Lattanzi, D. K. Sodickson, and C. A. McKenzie, Magn. Reson. Med. 60, 4 (2008).
[6] B. W. Murphy, P. L. Carson, J. H. Ellis, Y. Zhang, R. J. Hyde, and T. L. Chenevert, J. Magn. Reson. Imaging 11, 3 (1993).
[7] F. L. Goerner and G. D. Clarke, Med. Phys. 38, 9 (2011). [8] H. Gudbjartsson and S. Patz, Magn. Reson. Med. 34, 6
(1995).
[9] M. C. Steckner, B. Liu, and L. Ying, Med. Phys. 36, 2 (2009).
[10] A. Deshmane, V. Gulani, M. A. Griswold, and N. Seiber-lich, J. Magn. Reson. Imaging 36, 1 (2012).
[11] D. K. Sodickson and W. J. Manning, Magn. Reson. Med. 38, 4 (1997).
[12] K. P. Pruessmann, M. Weiger, M. B. Scheidegger, and P. Boesiger, Magn. Reson. Med. 42, 5 (1999).
[13] P. Kellman and E. R. McVeigh, Magn. Reson. Med. 54, 6 (2015).
Fig. 5. (Color online) Blend-Altman plots showing the agreement with ACR measurement method using the multi-channel head coil in the T1 weighted image.
[14] Medicine AAoPi. Acceptance Testing and Quality Assur-ance Procedures for Magnetic ResonAssur-ance Imaging Facil-ities. AAPM Report No.100 (2010).
[15] Association NEM. Determination of signal-to-noise ratio (SNR) in diagnostic magnetic resonance imaging. NEMA standard publication MS. (2008).
[16] E. G. Larsson, D. Erdogmus, R. Yan, J. C. Principe, and J. R. Fitzsimmons, J. Magn. Reson. 163, 1 (2003). [17] C. N. Wiens, S. J. Kisch, J. D. Willig-Onwuachi, and C.
A. McKenzie, Official Journal of the Society of Magnetic Resonance in Medicine 66, 4 (2011).
[18] H. Imai, T. Miyati, A. Ogura, T. Doi, T. Tsuchihashi, and Y. Machida, Nihon Hoshasen Gijutsu Gakkai Zasshi 64, 8 (2008).
[19] No.1 ATG. Quality assurance methods and phantoms for magnetic resonance imaging: Report of AAPM nuclear magnetic resonance Task Group No.1 (1989).