R E S E A R C H A R T I C L E
Open Access
Association between the DNA methylations
of POMC, MC4R, and HNF4A and metabolic
profiles in the blood of children aged 7
–
9 years
Eun Jin Kwon
1,3, Young-Ah You
1, Bohyun Park
2, Eun Hee Ha
3, Hae Soon Kim
4, Hyesook Park
2*and Young Ju Kim
5*Abstract
Background: Proopiomelanocortin (POMC), melanocortin 4 receptor (MC4R), and hepatocyte nuclear factor 4 alpha (HNF4A) are closely associated with weight gain and metabolic traits. In a previous study, we demonstrated associations between the methylations of POMC, MC4R, and HNF4A and metabolic profiles at birth. However, little is known about these associations in obese children. To evaluate the clinical utility of epigenetic biomarkers, we investigated to determine whether an association exists between the methylations of POMC, MC4R, and HNF4A and metabolic profiles in blood of normal weight and overweight and obese children.
Methods: We selected 79 normal weight children and 41 overweight and obese children aged 7–9 years in the Ewha Birth and Growth Cohort study. POMC methylation levels at exon 3, and MC4R and HNF4A methylation levels in promoter regions were measured by pyrosequencing. Serum glucose, total cholesterol (TC), triglyceride, high-density lipoprotein cholesterol (HDL–c), and insulin levels were analyzed using a biochemical analyzer and an immunoradiometric assay. Partial correlation and multiple regression analysis were used to assess relationships between POMC, MC4R, and HNF4A methylation levels and metabolic profiles.
Results: Significant correlations were found between POMC methylation and HDL–c levels, and between HNF4A methylation and both TC and HDL–c levels. Interestingly, associations were found between POMC methylation status and HDL–c levels, and between HNF4A methylation status and TC levels independent of body mass index. Conclusions: These findings show that POMC, MC4R, and HNF4A methylation status in the blood of children are associated with metabolic profiles. Therefore, we suggest that the DNA methylation status might serve as a potential epigenetic biomarkers of metabolic syndrome.
Keywords: POMC, MC4R, HNF4A, DNA methylation, Metabolic profiles, Children Background
The prevalence of obesity and its related disorders have been increasing worldwide over the last few decades [1]. In particular, the rates of childhood obesity has increased dramatically in many countries, including South Korea [2, 3]. It has been noted that around 40% of overweight children continue to be overweight during adolescence
and that up to 80% of obese adolescents become obese adults [4]. Obesity in childhood can therefore severely impact future health outcomes [5].
Obesity is also an important risk factor for the devel-opments of type 2 diabetes, metabolic syndrome (MetS), and cardiovascular disease [6]. Although, the molecular mechanisms underlying the pathogenesis of obesity re-main largely unknown, one study concluded that herit-ability could account for 85% of obesity [7], whereas in another it was estimated heredity accounted for < 2% [8]. The diversity of these findings suggests that obesity
* Correspondence:[email protected];[email protected]
2
Department of Preventive Medicine, Ewha Womans University Medical School, Seoul 07985, South Korea
5Department of Obstetrics and Gynecology, Ewha Womans University Medical School, Seoul 07985, South Korea
Full list of author information is available at the end of the article
© The Author(s). 2018 Open Access This article is distributed under the terms of the Creative Commons Attribution 4.0 International License (http://creativecommons.org/licenses/by/4.0/), which permits unrestricted use, distribution, and reproduction in any medium, provided you give appropriate credit to the original author(s) and the source, provide a link to the Creative Commons license, and indicate if changes were made. The Creative Commons Public Domain Dedication waiver (http://creativecommons.org/publicdomain/zero/1.0/) applies to the data made available in this article, unless otherwise stated.
is the result of complex interactions between genetic and environment factors.
Epigenetic modifications, especially DNA methylation, are associated with changes of gene expression through binding of transcription factor [9]. The establishment and maintenance of methylation are known to be sensi-tive to various environmental factors and to be heritable, although the mechanism underlying this inheritance in mammals remains unclear [10]. In rats, maternal diet during pregnancy has been shown to alter DNA methy-lation patterns and to affect phenotypic consequences [11]. Similarly, human studies have shown that prenatal exposure to famine led to changes in the methylation patterns of genes involved in lipid metabolism [12].
We previously reported that the methylation levels of proopiomelanocortin (POMC), melanocortin 4 receptor (MC4R), and hepatocyte nuclear factor 4 alpha (HNF4A) in cord blood were associated with metabolic profiles [13, 14]. POMC and MC4R genes play critical roles in the regulation of appetite, body weight, and energy homeostasis [15]. The disruptions of POMC or MC4R in humans have been linked to early onset obesity [16,
17]. POMC is cleaved into α-melanocortin stimulating hormones that acts on MC4R in the hypothalamus [17]. MC4R deficiency has been shown to be associated with elevated insulin levels and accelerated linear growth in childhood [17]. HNF4A encodes a transcription factor relevant to glucose and lipid metabolism and has two distinct promoters, P1 and P2, which are separated by more than 45.6 kb [18,19]. Furthermore, HNF4A muta-tion has been reported to be associated with impaired insulin secretion, resulting in maturity-onset diabetes of the young [20], and the expression of genes involved in liver and beta-cell functions, such as, glucose transport and glycolysis [20]. To date, most studies have focused on the associations between genetic variants of POMC, MC4R, and HNF4A and metabolic phenotypes [20–22].
In the present study, we analyzed methylation levels of POMC, MC4R, and HNF4A in the blood of normal weight and overweight and obese children aged 7– 9 years. We also evaluated associations between these methylation status and metabolic profiles.
Methods Study design
This study was performed on 79 normal weight and 41 overweight and obese children aged 7–9 years that were selected in the Ewha Birth and Growth Cohort study. Methodological details of the cohort study have been reported elsewhere [13, 23]. We choose those with an age- and gender-matched body mass index (BMI)≥ 85th percentile as overweight and obese children, and those with BMI < 85th percentile as normal weight children based on the 2007 Korean Children and Adolescent
Growth Standards [24]. Written informed consent was obtained from parents or guardians with respect to par-ticipation in the study. The study was approved by the Institutional Review Board of the Ewha Womans University Hospital (ECT 13-01A-13).
Anthropometric measurements
Anthropometric measurements and blood sampling were carried out according to the standard procedures by trained researchers. Height and weight were mea-sured to the nearest 0.1 cm and 0.1 kg using an auto-matic electronic scale (Dong Sahn Jenix Co. Ltd., Seoul, Korea). BMI was calculated by dividing weight by height squared (kg/m2).
Biochemical assessments
Fasting blood samples were collected in 10 ml Vacutai-ner tubes containing EDTA or serum tubes (BD Biosci-ences, San Jose, CA). Blood samples were centrifuged at 3000 rpm for 10 min, and the serum so obtained was stored at − 80 °C until required for chemical analysis. Serum glucose, triglyceride (TG), total cholesterol (TC), and high-density lipoprotein cholesterol (HDL-c) were analyzed by an automatic analyzer (model 7180; Hitachi, Tokyo, Japan). Insulin levels were measured using an immunoradiometric assay kit (MyBiosource, San Diego, CA). Insulin resistance was determined by the com-monly used homeostasis model assessment of insulin re-sistance (HOMA-IR) method, which was calculated as (plasma glucose [mmol/L] × insulin [μIU/mL]) /22.5.
DNA methylation analysis by pyrosequencing
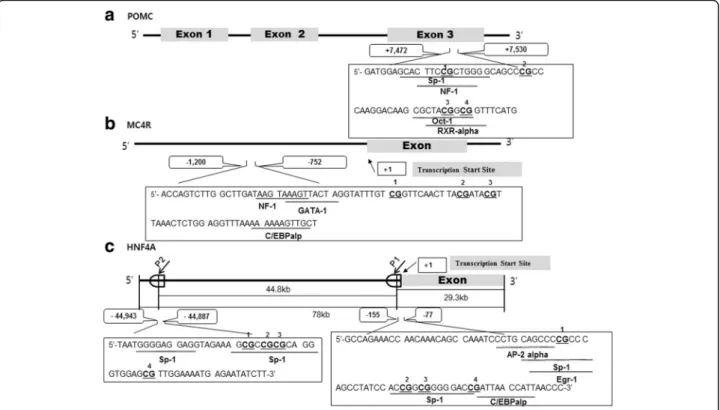
Genomic DNA samples were extracted from blood sam-ples of children using the DNeasy Blood and Tissue kit (Qiagen, Hilden, Germany), according to manufacturer’s protocols. Concentrations and purities of DNA were measured using a Nanodrop spectrophotometer (Nano-drop Technologies, Wilmington, DE). Methylation target regions of the POMC, MC4R, and HNF4A were ampli-fied by primer sets designed using the PSQ Assay Design software (Biotage AB, Uppsala, Sweden) [13, 14]. In POMC, the 4 CpG sites are located in the exon 3 region up to 7485 to 7520 bp downstream of the transcription start site (TSS) (Fig. 1a, 13). In MC4R, the 3 CpG sites are located in the promoter region up to − 800 to − 783 bp upstream of the TSS (Fig. 1b, 14). The HNF4A gene has 2 promoters (P1 and P2). The 4 CpG sites in P1 promoter region are located up to − 119 to − 92 bp and 4 CpG sites in P2 promoter region are located up to − 44,924 to − 44,907 bp upstream of the TSS (Fig. 1c, 14). Of these, the CpG2 site in P2 promoter of HNF4A was almost fully methylated (> 99%), and thus, was ex-cluded from this study. Details of pyrosequencing ana-lysis have been described in our previous study [13,14].
The PCR conditions were as follows; 94 °C for 10 min, followed by 45 amplification cycles (denaturation 94 °C for 30 s, annealing for 30 s, and extension 72 °C for 30 s). For the annealing step, the temperature were set at 52, 53, 54, or 56 °C for POMC, MC4R, HNF4A-P1, and HNF4A-P2, respectively. After amplification, all re-action were incubated at 72 °C for 10 min and then cooled to 4 °C.
Statistical analysis
Quantitative data were expressed as means ± standard deviations and were analyzed using the Student t-test or analysis of covariance, adjusted for age. TG and insulin levels were analyzed as log-transformed values to satisfy normality. Partial correlation was used to identify the re-lationship between POMC, MC4R, and HNF4A methy-lation levels and metabolic profiles after adjusting for age in all subjects. To control for the effects of BMI as a major risk factor of MetS, multiple linear regression ana-lysis was used to assess the associations between DNA methylations of the three genes and metabolic profiles in all subjects. In addition, age and gender were adjusted in the analysis. The statistical analysis was conducted using SAS software (ver. 9.4; SAS Institute Inc., Cary, NC). All analyses were two-tailed, and p values of < 0.05 were considered as significant.
Results
General characteristics of the study subjects
Seventy-nine normal weight and 41overweight and obese children were included in this study (Table1). There were significant differences between the two groups in age, height, weight, BMI, and waist circumference (p < 0.001). After adjusting for age, average TG, TC, insulin, glucose levels and HOMA index were significantly higher in over-weight and obese children (p < 0.05), whereas mean HDL-c level was significantly lower (p < 0.001).
Average DNA methylation levels
The following methylation levels were significantly less methylated in overweight and obese children (p < 0.05): POMC methylation at 4 CpG sites, MC4R methylation at CpG3, and HNF4A methylation levels at CpG2, 3, and 4 in P1. On the contrary, the following methylation levels were significantly more methylated in overweight and obese children (p < 0.05): MC4R methylation at CpG1 and 2, and HNF4A methylation at CpG1 in P1 and at CpG1 and 3 in P2, after adjusting for age (Table2).
The relationship between DNA methylation and blood metabolic profiles
Table3shows significant correlations between hyperme-thylation of POMC at 4 CpG sites, and between Fig. 1 Schematic representation of proopiomelanocortin (POMC) (a), melanocortin 4 receptor (MC4R) (b), and hepatocyte nuclear factor 4 alpha (HNF4A) (c) genes at individual CpG site
Table 1 General characteristics of the normal weight and overweight and obese children
Characteristics Normal weight children
(n = 79)
Overweight and obese children (n = 41) Mean ± SD or N (%) Mean ± SD or N (%) p Children features Age (years) 7.03 ± 0.16 8.24 ± 0.83 < 0.001 Gender (male, n) 39 (49.4%) 21 (51.2%) 0.85 Height (cm) 123.98 ± 5.46 134.06 ± 6.68 < 0.001 Weight (kg) 24.14 ± 3.94 38.32 ± 7.03 < 0.001 BMI(kg/m2) 15.61 ± 1.22 21.47 ± 1.83 < 0.001 Waist circumference(cm) 53.56 ± 3.98 69.84 ± 7.55 < 0.001
Blood metabolic profiles*,‡
TG (mg/dL)a 58.26 ± 1.61 79.18 ± 1.53 < 0.001 TC (mg/dL) 159.56 ± 24.93 165.22 ± 19.34 < 0.001 HDL-c (mg/dL) 61.89 ± 12.00 56.22 ± 9.94 < 0.001 Insulin (μU/mL)a 6.96 ± 1.27 10.80 ± 1.39 0.03 Glucose (mg/dL) 77.94 ± 6.35 78.22 ± 5.72 < 0.001 HOMA‡ 1.36 ± 0.42 2.22 ± 0.92 < 0.001
p values in children features were calculated using the Student t-test and‡p values in metabolic profiles were calculated using ANCOVA adjusted for age*
a
TG and insulin levels were analyzed as log-transformed values and results are presented as back-transformed means TG triglyceride, TC total cholesterol, HDL–c high-density lipoprotein cholesterol, HOMA homeostasis model assessment
Table 2 Average methylation levels of POMC, MC4R, and HNF4A in normal weight children and overweight and obese children CpG
methylation+
Normal weight children (n = 79)
Overweight and obese children (n = 41) Mean ± SD Mean ± SD p POMC POMC–CpG1a 57.07 ± 9.75 54.90 ± 8.10 < 0.001 POMC–CpG2a 50.30 ± 9.58 49.07 ± 7.41 < 0.001 POMC–CpG3a 51.71 ± 10.25 50.42 ± 7.46 0.002 POMC–CpG4a 50.83 ± 9.15 49.20 ± 7.05 < 0.001 MC4R MC4R–CpG1 95.19 ± 3.00 95.49 ± 2.51 0.02 MC4R–CpG2 91.03 ± 1.33 91.05 ± 1.61 < 0.001 MC4R–CpG3a 83.20 ± 1.71 83.18 ± 1.31 0.01 HNF4A–P1 HNF4A–CpG1 91.62 ± 4.68 91.73 ± 3.74 < 0.001 HNF4A–CpG2a 80.64 ± 6.30 80.53 ± 4.25 0.01 HNF4A–CpG3a 85.83 ± 2.96 85.32 ± 2.37 0.001 HNF4A–CpG4a 86.24 ± 2.79 85.18 ± 2.99 0.02 HNF4A–P2 HNF4A–CpG1 96.93 ± 1.07 97.55 ± 0.91 0.01 HNF4A–CpG3 94.79 ± 1.28 95.40 ± 1.05 0.03 HNF4A–CpG4a 91.44 ± 1.84 91.29 ± 1.80 0.05 +
P values were calculated using ANCOVA adjusting for age
a
indicate lower methylation
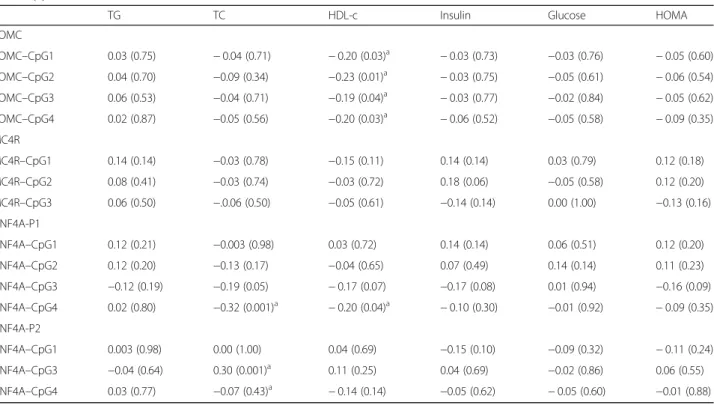
hypermethylation of HNF4A at CpG4 in P1 and lower HDL-c levels (r = − 0.19 ~ 0.23, p < 0.05). In addition, hypomethylation of HNF4A at CpG4 in P1, and hyper-methylation of HNF4A at CpG3 in P2 were significantly correlated with higher TC levels (r = − 0.32, p = 0.001, r = 0.30, p = 0.001, respectively). Hence, we focused on these 6 CpG sites and 2 metabolic profiles showing sig-nificant relation (p < 0.05).
The association between DNA methylation and blood metabolic profiles in all subjects
To control for the effect of BMI on metabolic profiles, we analyzed associations between the methylation status of POMC, MC4R, and HNF4A and metabolic profiles after adjusting for age, gender, and BMI in all subjects (Table4). We observed a hypermethylation of POMC-CpG2 was significantly related to a lower HDL-c level (β = − 0. 23, p = 0.048). Hypomethylation of HNF4A-CpG4 in P1 and hypermethylation of HNF4A-CpG3 in P2 were significantly associated with higher TC levels (β = − 2.79, p = 0.001; β = 5.70, p = 0.002).
Discussion
Epigenetic variations in metabolism–related genes partly contributed to the development of obesity and MetS. Most studies have reported the associations between POMC, MC4R, and HNF4A variants and obesity and MetS-related
phenotypes [16–20]. In this study, we identified significant correlations between the methylation status of POMC and HNF4A and metabolic profiles in the blood of normal weight and overweight and obese children. Moreover, BMI-independent associations were found between the methylation status of POMC and HNF4A, and TC and HDL–c levels in Korean children. These findings suggest that epigenetic changes in metabolism-related genes may
Table 3 Partial correlations between the methylations of POMC, MC4R, and HNF4A and metabolic profiles adjusted for age, Unit: r (P)
TG TC HDL-c Insulin Glucose HOMA
POMC POMC–CpG1 0.03 (0.75) − 0.04 (0.71) − 0.20 (0.03)a − 0.03 (0.73) −0.03 (0.76) − 0.05 (0.60) POMC–CpG2 0.04 (0.70) −0.09 (0.34) −0.23 (0.01)a − 0.03 (0.75) −0.05 (0.61) − 0.06 (0.54) POMC–CpG3 0.06 (0.53) −0.04 (0.71) −0.19 (0.04)a − 0.03 (0.77) −0.02 (0.84) − 0.05 (0.62) POMC–CpG4 0.02 (0.87) −0.05 (0.56) −0.20 (0.03)a − 0.06 (0.52) −0.05 (0.58) − 0.09 (0.35) MC4R MC4R–CpG1 0.14 (0.14) −0.03 (0.78) −0.15 (0.11) 0.14 (0.14) 0.03 (0.79) 0.12 (0.18) MC4R–CpG2 0.08 (0.41) −0.03 (0.74) −0.03 (0.72) 0.18 (0.06) −0.05 (0.58) 0.12 (0.20) MC4R–CpG3 0.06 (0.50) −.0.06 (0.50) −0.05 (0.61) −0.14 (0.14) 0.00 (1.00) −0.13 (0.16) HNF4A-P1 HNF4A–CpG1 0.12 (0.21) −0.003 (0.98) 0.03 (0.72) 0.14 (0.14) 0.06 (0.51) 0.12 (0.20) HNF4A–CpG2 0.12 (0.20) −0.13 (0.17) −0.04 (0.65) 0.07 (0.49) 0.14 (0.14) 0.11 (0.23) HNF4A–CpG3 −0.12 (0.19) −0.19 (0.05) − 0.17 (0.07) −0.17 (0.08) 0.01 (0.94) −0.16 (0.09) HNF4A–CpG4 0.02 (0.80) −0.32 (0.001)a − 0.20 (0.04)a − 0.10 (0.30) −0.01 (0.92) − 0.09 (0.35) HNF4A-P2 HNF4A–CpG1 0.003 (0.98) 0.00 (1.00) 0.04 (0.69) −0.15 (0.10) −0.09 (0.32) − 0.11 (0.24) HNF4A–CpG3 −0.04 (0.64) 0.30 (0.001)a 0.11 (0.25) 0.04 (0.69) −0.02 (0.86) 0.06 (0.55) HNF4A–CpG4 0.03 (0.77) −0.07 (0.43)a − 0.14 (0.14) −0.05 (0.62) − 0.05 (0.60) −0.01 (0.88) a
indicate statistically significant correlations
POMC proopiomelanocortin, MC4R melanocortin 4 receptor, HNF4A hepatocyte nuclear 4 alpha, P promoter region, TG triglyceride, TC total cholesterol, HDL–c high-density lipoprotein cholesterol
Table 4 Associations between DNA methylation status at CpG sites and metabolic profiles adjusted for age, gender, and BMI
TC HDL–c β (SE) p β (SE) p POMC POMC–CpG1 −0.15 (0.24)* 0.52 −0.20 (0.11)* 0.08 POMC–CpG2 −0.32 (0.25)* 0.20 −0.23 (0.12)*,a 0.048a POMC–CpG3 − 0.16 (0.24)* 0.50 − 0.18 (0.11)* 0.12 POMC–CpG4 −0.23 (0.26)* 0.39 −0.20 (0.12)* 0.10 HNF4A–P1 HNF4A–CpG4 −2.79 (0.76)*,a 0.001† −0.67 (0.37)* 0.07 HNF4A–P2 HNF4A–CpG3 5.70 (1.76)*,a 0.002† 1.14 (0.86) 0.19
Results are presented as coefficients (β) and SE after adjusting for age, gender, and BMI
a
influence metabolic profiles and could serve as potential epigenetic biomarkers for MetS.
In the present study, mean TG, TC, insulin, and glu-cose levels and HOMA index were significantly higher in overweight and obese children, whereas mean HDL–c levels had significantly lower than in normal weight chil-dren. Ba et al. also found that mean TG, TC, and insulin levels and HOMA index were significantly higher in obese children than in normal children [25]. Similarly, Azab et al. reported that obese children had significantly higher TG and TC levels, and lower HDL-c levels than non-obese children [26]. However, Woo et al. reported that mean TC levels were not different between obese and non-obese children, although mean TG and insulin levels were significantly different [27].
Furthermore, our results indicate average POMC, MC4R, and HNF4A methylation levels at CpG sites were significantly different in overweight and obese and nor-mal weight children. Interestingly, our earlier study found that POMC, MC4R, and HNF4A methylation in specific CpG sites were significantly different in term and preterm infants [14].
In this study, the methylation levels at some CpG sites differed by < 1% in the two groups. Although these dif-ferences were quite marginal, they were found to be sta-tistically significant. These results may be due to higher rate of overweight and obese children (34.2%) in this study rather than in the general population. A lower rate of overweight and obese children may have reduced the bias and possibly increased the difference in methylation levels between the two groups. After adjusting for age, we found a negative correlation between POMC methy-lation levels and HDL–c levels in children. In a previous study, we identified that high POMC methylation levels were marginally related to lower HDL–c levels [13]. Al-though there is no significant association between MC4R methylation and insulin levels in this study, larger sample size and further study are needed to clarify this association. Martinelli et al. reported that MC4R–defi-cient children had considerably higher insulin level [17]. Furthermore, a study on MC4R–null mice reported ele-vated insulin levels [28]. In this study, negative correla-tions were found between HNF4A methylation levels in P1 and TC and HDL–c levels, whereas HNF4A methylation levels in P2 were positively correlated with TC levels. Hayhurst et al. found that HNF4A– null mice showed markedly lower TC and TG levels [29]. In addition, we previously reported significant associations between the hypomethylation status of MC4R and HNF4A and higher TG levels in term in-fants and preterm inin-fants [14]. These findings suggest that the methylation status of POMC, MC4R, and HNF4A may contribute to the metabolic phenotypes of children.
Interestingly, we observed a significant association be-tween hypermethylation of POMC–CpG2 in exon 3 and lower HDL–c levels after adjusting for age, gender, and BMI. Crujeiras et al. showed hypermethylation of the pro-moter region of POMC was associated with weight gain after an energy-restricted diet [30]. In addition, hyperme-thylation of exon 3 of POMC has been shown to be highly related to childhood BMI, and to be a relatively stable re-gion in different cell types [31]. Biological actions of POMC–derived peptides are mediated by melanocortin receptors [17]. Perez-Tilve et al. reported that inhibition of melanocortin signaling led to higher HDL-c levels inde-pendent of body weight [32]. In the current study, hyper-methylation of the promoter of MC4R-CpG1 tended to be related to higher insulin levels in children, although not statistically significant. In contrast, Widiker et al. found the hypomethylation status of MC4R was related with obesity in mice fed a high–fat diet [33]. Likewise, the hy-pomethylation of MC4R was found to be significantly linked with elevated TG levels in cord blood of term in-fants and preterm inin-fants [14]. These observations suggest that at some CpG sites, MC4R methylation patterns in early life may be influenced by environmental factors ra-ther than by heritable traits. Longitudinal studies and lar-ger sample sizes are required to determine whether MC4R methylation status could impair metabolic profiles and possibly increase the risk of MetS. This study demon-strated BMI-independent associations between the methy-lation status of HNF4A-CpG4 in P1 and of HNF4A-CpG3 in P2, and TC levels. In humans, HNF4A methylation levels have been reported to differ in neonates with intra-uterine growth restriction [34]. These findings concur with those of Ribel–Madsen et al. who found HNF4A was hypermethylated in individuals with type 2 diabetes [35].
This study had several limitations. First, we did not exam-ine methylation levels in target organ tissues, such as, hypo-thalamus or liver. In addition, we did not take into account cellular heterogeneity in blood samples which may influ-ence methylation levels. Because the study was conducted on children, it was difficult to obtain tissues and samples sizes were limited, and thus, we evaluated DNA methyla-tion levels in whole blood, which is a readily accessible for the assessment of biomarkers. Second, we did not evaluate the environment or social-economic factors, which may affect methylation. Nonetheless, it was identified the methylation status of POMC, MC4R and HNF4A were re-lated to metabolic profiles in Korean children. We also con-firmed the associations between the methylation status of three genes and metabolic profiles in 1) cord blood of term and preterm infants in a case-control study [14]; 2) cord blood and blood in 90 children aged 7–9 years in a cohort study [13]. Additionally, these methylation status could in-fluence metabolic profiles. Consequently, we suggest that changes in DNA methylation patterns in childhood may
increase the risk of MetS, and longitudinal studies with lar-ger sample sizes would be needed to investigate further.
Conclusions
This study demonstrates the associations between the methylation status of POMC, MC4R, and HNF4A and metabolic profiles in Korean children. Furthermore, we found BMI–independent associations between DNA methylations of three genes and TC and HDL–c levels. These findings indicate the clinical utility as potential epigenetic biomarkers of MetS, and larger cohort studies are required for further evaluation and verification. Abbreviations
BMI:Body mass index; HDL-c: High-density lipoprotein cholesterol; HNF4A: Hepatocyte nuclear factor 4 alpha; MC4R: Melanocortin 4 receptor; MetS: Metabolic syndrome; P: Promoter region; POMC: Pro-opiomelanocortin; TC: Total cholesterol; TG: Triglyceride; TSS: Transcription start site
Acknowledgements
The authors are thankful to all of the consultants from the Cohort group. Funding
This study was supported by the Basic Science Research Program through the National Research Foundation of Korea funded by the Ministry of Education (2016 R1D1A1A09918620) and by the Ministry of Health & Welfare of the Republic of Korea (HI15C2059) through the Korea Health Industry Development Institute.
Availability of data and materials
The datasets used and/or analyzed during the current study available from the corresponding author on reasonable request.
Authors’ contributions
EJK, HP and YJK designed the study and wrote the manuscript. YAY performed the data analysis and interpretation. BP contributed to research design. EHH, and HSK interpreted the result and revised the manuscript. HP and YJK are the guarantor of this work and had full access to all data in the study and takes responsibility for the integrity of the data. All the authors approved the final version of the paper for submission.
Ethics approval and consent to participate
We obtained written informed consent from parents or guardians before enrollment of the participant in this study. This study was approved by the Institutional Review Board of the Ewha Womans University Hospital (ECT 13-01A-13). Consent for publication
Not applicable. Competing interests
All authors declare that they have no competing interests.
Publisher’s Note
Springer Nature remains neutral with regard to jurisdictional claims in published maps and institutional affiliations.
Author details
1Department of Obstetrics and Gynecology and Ewha Medical Research Institute, Ewha Womans University Medical School, Seoul 07985, South Korea. 2Department of Preventive Medicine, Ewha Womans University Medical School, Seoul 07985, South Korea.3Department of Occupational and Environmental Medicine, Ewha Womans University Medical School, Seoul 07985, South Korea.4Department of Pediatrics, Ewha Womans University Medical School, Seoul 07985, South Korea.5Department of Obstetrics and Gynecology, Ewha Womans University Medical School, Seoul 07985, South Korea.
Received: 21 February 2017 Accepted: 27 March 2018
References
1. Ebbeling CB, Db P, Ludwig DS. Childhood obesity: public-health crisis, common sense cure. Lancet. 2002;360:473–782.
2. Jang M, Berry D. Overweight, obesity, and metabolic syndrome in adults and children in South Korea: a review of the literature. Clin Nurs Res. 2011; 20:276–91.
3. Moon JS. Secular trends of body sizes in Korean children and adolescents: from 1965 to 2010. Korean J Pediatr. 2011;54:436–42.
4. Lifshitz F. Obesity in children. J Clin Res Pediatr Endocrinol. 2008;1:53–60. 5. Freedman DS, Khan LK, Serdula MK, Dietz WH, Srinivasan SR, Berenson GS.
The relation of childhood BMI to adult adiposity: the Bogalusa heart study. Pediatrics. 2005;115:22–7.
6. Ford ES, Giles WH, Dietz WH. Prevalence of the metabolic syndrome among US adults: findings from the third National Health and nutrition examination survey. JAMA. 2002;287:356–9.
7. Yang W, Kelly T, He J. Genetic epidemiology of obesity. Epidemiol Rev. 2007; 29:49–61.
8. Waalen J. The genetics of human obesity. Transl Res. 2014;164:293–301. 9. Henikoff S, Matzke MA. Exploring and explaining epigenetic effects. Trends
Genet. 1997;13:293–5.
10. Heard E, Martienssen RA. Transgenerational epigenetic inheritance: myths and mechanisms. Cell. 2014;157:95–109.
11. Lillycrop KA, Slater-Jefferies JL, Hanson MA, Godfrey KM, Jackson AA, Burdge GC. Induction of altered epigenetic regulation of the hepatic glucocorticoid receptor in the offspring of rats fed a protein-restricted diet during pregnancy suggests that reduced DNA methyltransferase-1 expression is involved in impaired DNA methylation and changes in histone modifications. Br J Nutr. 2007;97:1064–73.
12. Tobi EW, Goeman JJ, Monajemi R, Gu H, Putter H, Zhang Y, Slieker RC, Stok AP, Thijssen PE, Müller F, van Zwet EW, Bock C, Meissner A, Lumey LH, Eline Slagboom P, Heijmans BT. DNA methylation signatures link prenatal famine exposure to growth and metabolism. Nat Commun. 2014;5:5592. 13. Yoo JY, Lee S, Lee HA, Park H, Park YJ, Ha EH, Kim YJ. Can
proopiomelanocortin methylation be used as an early predictor of metabolic syndrome? Diabetes Care. 2014;37:734–9.
14. Kwon EJ, Lee HA, You YA, Park H, Cho SJ, Ha EH, Kim YJ. DNA methylations of MC4R and HNF4α are associated with increased triglyceride levels in cord blood of preterm infants. Medicine (Baltimore). 2016;95:e4590.
15. Berthoud HR, Morrison C. The brain, appetite, and obesity. Annu Rev Psychol. 2008;59:55–92.
16. Farooqi IS, Drop S, Clements A, Keogh JM, Biernacka J, Lowenbein S, Challis BG, O'Rahilly S. Heterozygosity for a POMC-null mutation and increased obesity risk in humans. Diabetes. 2006;55:2549–53.
17. Martinelli CE, Keogh JM, Greenfield JR, Henning E, van der Klaauw AA, Blackwood A, O'Rahilly S, Roelfsema F, Camacho-Hübner C, Pijl H, Farooqi IS. Obesity due to melanocortin 4 receptor (MC4R) deficiency is associated with increased linear growth and final height, fasting hyperinsulinemia, and incompletely suppressed growth hormone secretion. J Clin Endocrinol Metab. 2011;96:E181–8.
18. Stoffel M, Duncan SA. The maturity-onset diabetes of the young (MODY1) transcription factor HNF4alpha regulates expression of genes required for glucose transport and metabolism. Proc Natl Acad Sci U S A. 1997;94: 13209–14.
19. Love-Gregory LD, Wasson J, Ma J, Jin CH, Glaser B, Suarez BK, Permutt MA. A common polymorphism in the upstream promoter region of the hepatocyte nuclear factor-4 alpha gene on chromosome 20q is associated with type 2 diabetes and appears to contribute to the evidence for linkage in an ashkenazi jewish population. Diabetes. 2004;53:1134–40.
20. Lehto M, Bitzén PO, Isomaa B, Wipemo C, Wessman Y, Forsblom C, Tuomi T, Taskinen MR, Groop L. Mutation in the HNF-4alpha gene affects insulin secretion and triglyceride metabolism. Diabetes. 1999;48:423–5.
21. Pritchard LE, Turnbull AV, White A. Pro-opiomelanocortin processing in the hypothalamus: impact on melanocortin signaling and obesity. J Endocrinol. 2002;172:411–21.
22. Farooqi IS, Keogh JM, Yeo GS, Lank EJ, Cheetham T, O'Rahilly S. Clinical spectrum of obesity and mutations in the melanocortin 4 receptor gene. N Engl J Med. 2003;348:1085–95.
23. Min JW, Kong KA, Park BH, Hong JH, Park EA, Cho SJ, Ha EH, Park H. Effect of postnatal catch-up growth on blood pressure in children at 3 years of age. J Hum Hypertens. 2007;21:868–74.
24. Korea Pediatric Society: Korean infants and adolescents growth standards. Available from:http://www.cdc.go.kr/CDC/notice/CdcKrInfo0301. jsp?menuIds=HOME001-MNU0004-MNU0036-MNU0037&cid=12103. Accessed Novermber 2007.
25. Ba HJ, Chen HS, Su Z, Du ML, Chen QL, Li YH, Ma HM. Associations between serum apelin-12 levels and obesity-related markers in Chinese children. PLoS One. 2014;9:e86577.
26. Azab SF, Saleh SH, Elsaeed WF, Elshafie MA, Sherief LM, Esh AM. Serum trace elements in obese Egyptian children: a case-control study. Ital J Pediatr. 2014;40:20.
27. Woo KS, Chook P, Yu CW, Sung RY, Qiao M, Leung SS, Lam CW, Metreweli C, Celermajer DS. Overweight in children is associated with arterial endothelial dysfunction and intima-media thickening. Int J Obes Relat Metab Disord. 2004;28:852–7.
28. Fan W, Dinulescu DM, Butler AA, Zhou J, Marks DL, Cone RD. The central melanocortin system can directly regulate serum insulin levels. Endocrinology. 2000;141(9):3072.
29. Hayhurst GP, Lee YH, Lambert G, Ward JM, Gonzalez FJ. Hepatocyte nuclear factor alpha (nuclear receptor 2A1) is essential for maintenance of hepatic gene expression and lipid homeostasis. Mol Cell Biol. 2001;21:1393–403. 30. Crujeiras AB, Campion J, Díaz-Lagares A, Milagro FI, Goyenechea E, Abete I,
Casanueva FF, Martínez JA. Association of weight regain with specific methylation levels in the NPY and POMC promoters in leukocytes of obese men: a translational study. Regul Pept. 2013;186:1–6.
31. Kuehnen P, Mischke M, Wiegand S, Sers C, Horsthemke B, Lau S, Keil T, Lee YA, Grueters A, Krude H. An Alu element-associated hypermethylation variant of the POMC gene is associated with childhood obesity. PLoS Genet. 2012;8:e1002543.
32. Perez-Martinez P, Garcia-Rios A, Delgado-Lista J, Delgado-Casado N, Malagon MM, Marin C, Gomez-Luna P, Caballero J, Perez-Jimenez F, Lopez-Miranda J. A variant near the melanocortin-4 receptor gene regulates postprandial lipid metabolism in a healthy Caucasian population. Br J Nutr. 2011;106:468–71.
33. Widiker S, Karst S, Wagener A, Brockmann GA. High-fat diet leads to a decreased methylation of the Mc4r gene in the obese BFMI and the lean B6 mouse lines. J Appl Genet. 2010;51:193–7.
34. Einstein F, Thompson RF, Bhagat TD, Fazzari MJ, Verma A, Barzilai N, Greally JM. Cytosine methylation dysregulation in neonates following intrauterine growth restriction. PLoS One. 2010;5:e8887.
35. Ribel-Madsen R, Fraga MF, Jacobsen S, Bork-Jensen J, Lara E, Calvanese V, Fernandez AF, Friedrichsen M, Vind BF, Højlund K, Beck-Nielsen H, Esteller M, Vaag A, Poulsen P. Genome-wide analysis of DNA methylation differences in muscle and fat from monozygotic twins discordant for type 2 diabetes. PLoS One. 2012;7:e51302.
• We accept pre-submission inquiries
• Our selector tool helps you to find the most relevant journal
• We provide round the clock customer support
• Convenient online submission
• Thorough peer review
• Inclusion in PubMed and all major indexing services
• Maximum visibility for your research Submit your manuscript at
www.biomedcentral.com/submit