Assessing the R&D Effectiveness and
Business Performance: A Review of Their
Mechanisms and Metrics
Yonghee Cho*
Abstract
With the constant growth of R&D investment, it has been increasingly necessary to evaluate the effectiveness of R&D performance and there is a high emphasis on ensuring the accountability and effectiveness of R&D programs. The evaluation of performance of a firm is especially necessary in times of economic downturn to justify R&D investment. However, there is a marked shortage of clear guidelines as to where and how particular metrics are used to measure the output and outcome of R&D activity in firms. Many firms have difficulties in selecting appropriate indicators for their R&D and financial performances. To fill this gap, this article discusses and presents the findings from the literature in such a way that they become useful for researchers or managers who are in charge of measuring the R&D and business performances arising from innovation activities. Finally, based on the findings about metrics of R&D performance, this article proposes the hypothetical framework to investigate the relationship between technology forecasting, strategic technol-ogy planning, and business performance. The framework of this article will assist policy makers, universities, research institutes/national laboratories, and companies to enhance their decision making process in tech-nology development.
Keywords
R&D performance, Business performance, R&D effectiveness, R&D assessment, Strategic technology planning
Acknowledgements
* Research Associate, Department of Engineering and Technology Management, Portland State University, OR 97207, USA, E-mail: [email protected]
1. INTRODUCTION
Economists and strategic management researchers have been paying constant attention to firm per-formances over a century. In the earlier studies, Joseph Schumpeter created the relevant theoretical concepts and tools in his most famous book titled “[T]he Theory of Economic Development”. In the book, he explored the evolution of economic development and this Schumpeterian effort for-mulated a remarkable notion of economic development. In this notion, those firms equipped with R&D divisions became the central innovative actors in Schumpeter’s theory (Nelson, 1991). Also, in neoclassical theory of firm, neoclassical theorists tried to look inside the “black box” of firm, and economists regarded technology as an exogenous or endogenous factor in the aggregate production function in order to investigate the economic growth (Romer, 1990; and Solow, 1956, 1957). In this regard, extensive theoretical and empirical research has been conducted in relation to productivity growth and they measured technical changes at the levels of single industries and entire macro and micro-economies. This approach of focusing on industries and economies, however, carries a limi-tation in that it is difficult to explain and accommodate a role and influence of differences between firms in assessing their performances because the approach’s underlying economic theories assume the homogeneity of economic entities’ behaviors in markets.
Penrose, meanwhile, pioneered the foundation of resource based theory and regarded firm growth as a dynamic process of management’s interaction with resources (Penrose, 1959). She applied this theory to the growth and diversification of firms. In the same vein, Rubin also viewed a firm as a collection of particular resources (Rubin, 1973). Unlike the above-mentioned approach of focusing on industries and economies, the resource based theory focuses on the heterogeneity of a firm’s set of capabilities and performances. Under this theory, strategy formulation focuses on organizational resources and competencies aligned with environmental opportunities (Andrews, 1971). In this regard, Teece explored the efficiency rationale of firm diversification by incorporating economies of scope and transaction cost economics (Teece, 1980, 1982). Wernerfelt advanced resource-based perspectives on both competitive advantage and firm growth (Wernerfelt, 1984) in which he pro-posed a new focus on technology in strategy. Moreover, Barney emphasized that firms can attempt to develop better expectations about the future value of strategic resources by investigating their competitive environments or by analyzing the skills and capabilities for which they already control (Barney, 1986). He further indicated that strategic choices must come from the analysis of competi-tive advantages based on strategic resources instead of competicompeti-tive environments. However, like the above-mentioned approach of focusing on industries and economies, the resource based theory carries some limitations in conducting an empirical study on measuring firms’ performances since its assumption of heterogeneity conflicts with composing a homogeneous sample for testing spe-cific resource-based views and hypotheses (Lockett, Thompson, & Morgenstern, 2009).
It is also notable that Nelson introduced the emerging theory of dynamic firm capabilities (Nelson, 1991). However, Teece and Pisano triggered a series of discussion on the theory of dynamic capa-bilities in their earlier studies (Teece & Pisano, 1994; Teece, Pisano, & Shuen, 1997) by defining dynamic capabilities as an idiosyncratic set of learned processes and activities that enable firms to
generate particular outcomes. Teece also stressed three forms of managerial activities in the form of sensing, seizing, and transforming in order to generate dynamic capabilities. These approaches un-derstand firm performance to be a result of the efficient use of unique company capabilities. In this regard, the resource-based view can help managers to understand the types of resources that gener-ate sustained competitive advantages and to employ this understanding to evalugener-ate the resources in their firms’ possession (Barney, 1991, 2001). On the other hand, however, the resource-based view has a limited ability to make reliable predictions (Priem & Butler, 2001).
It has been a growing practice since early 1980s to measure the outcomes and impacts of R&D (Bozeman & Melkers, 1993). In other words, firms have been focusing on the effectiveness of their R&D investment as well as uses of R&D. An effective R&D operation is considered as a primary enabler of competitive advantage in today’s rapidly and drastically changing business environ-ment (Foster, 1982; Roussel, Saad, & Erickson, 1991). Since R&D consists of creative, unique, and unstructured processes, it is difficult to evaluate its performance. Certain elements inherent in R&D such as time lag, joint costs and returns, and imputation of a given cost or return item to a given project or program raise challenges and problems in measuring its performance (Galloway, 1971; Rubenstein & Geisler, 1991). Unfortunately, there is still no method that is widely accepted for measuring the causes and effects of such inventive activities because performance measurement systems for R&D vary in accordance with the characteristics of technology, stages of R&D process, and the relevant firm’s internal and external contexts (Bremser & Barsky, 2004; Chiesa, Frattini, Lazzarotti, & Manzini, 2009; Coccia, 2001; Drongelen & Bilderbeek, 1999; Karlsson, Trygg, & Elfström, 2004; Lazzarotti, Manzini, & Mari, 2011; Mendigorri, Valderrama, & Cornejo, 2016; Neely, Gregory, & ..., 2005; Nilsson & Ritzén, 2014; Ojanen & Vuola, 2006; Pakes, 1985; Szak-onyi, 1994; and Werner & Souder, 1997).
However, especially in times of economic downturn, the evaluation of performance in firms is re-quired to justify R&D investments thereto, and furthermore, there is a high emphasis on ensuring the accountability and effectiveness of R&D programs. In this regard, the use of innovative perfor-mance measurement generates substantial discussions on the types of innovation that create and contribute values to the organization concerned (Nilsson & Ritzén, 2014). Thus, it can be said that measurement of R&D performance has been developed by employing different methodologies – in response to the needs of various organizations.
Yet, very little research has been conducted to suggest appropriate metrics for the purpose of determination of the impact of technology planning on R&D performance as well as economic (financial) performance of firms. Thus, the primary objective of this article is to provide more com-prehensive summary of metrics on firms’ R&D performances as well as financial performances. Moreover, this article aims at developing propositions regarding the nature of strategic technology planning.
This article is divided into three sections. In the first section, the article will address theoretical backgrounds of this study followed by descriptions of performance measurement indicators
associ-ated with R&D and financial performance of firms. In the last section, the article will propose the related conceptualized propositions based on the literature review.
2. LITERATURE REVIEW 2.1. Measuring R&D performance
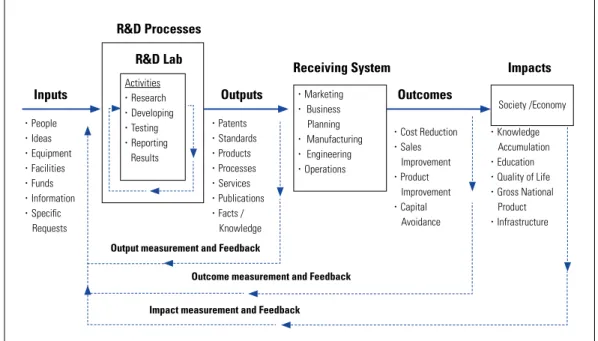
With regard to R&D performance, the literature has focused on three forms of contributions, which are improvements in the capabilities and quality of existing products and processes, new product or process developments, and advancement in knowledge for future improvements in products or pro-cesses (Gold, 1989). The fact that there are various forms of R&D performance as described above presents difficulties in determining which elements should be measured (Loch & Tapper, 2002). A variety of outputs, outcomes, and impacts of R&D are illustrated in Figure 1. “Output” is the instant and direct result of R&D. “Outcome” is the expected result that will be realized through a receiv-ing system based on the output (M. G. Brown & Svenson, 1998). “Impact” is the long-term effect of R&D on the society and economy (Bøler, Moxnes, & Ulltveit-Moe, 2015; Wiesenthal, Mercier, Schade, Petric, & Dowling, 2012).
There is no single approach or method that provides an entirely satisfactory evaluation (Bozeman & Melkers, 1993). In addition, it is always difficult to compare subjective data to quantitative in-dexes. In this article, therefore, the measurement of R&D performance focuses on output indicators instead of outcomes or social impact indicators – because output indicators are not only countable and quantifiable and can be measured at any given time but they are also replicable based on verifi-able sources.
As for the types of output indicators, Rubenstein and Geisler suggested that any index to measure R&D performance should be defined on the basis of the information-gathering system (Rubenstein & Geisler, 1991). In this regard, typical output indicators are patents, new products, new processes, publications, or simply facts, principles, or knowledge that were unknown before (Pappas & Re-mer, 1985). R&D performance can, however, be measured by several variables depending on the focus of the analysis. This article will focus on evaluating the technological performances of R&D efforts of firms. In addition, the article will review the literature to seek an objective measurement of R&D effectiveness.
FIGURE 1. The R&D Performance as a System
Source: modified and adapted from (M. G. Brown & Svenson, 1998; Geisler, 1994; Mansfield, 1992; and Rubenstein & Geisler, 1991)
2.1.1. Patents
As descried above, one can use technical performance to measure the effectiveness of R&D, and patents can be considered as an output of successful technical performance (i.e., technically suc-cessful innovative activities). Several studies indicated a positive relationship between patents and R&D investment in U.S corporations – by varying degrees depending on industry sectors (Ernst, 1995; Griliches, 1981; and Scherer, 1983). Jaffe indicated that the number of patents and the degree of effectiveness of R&D tend to be correlated to each other without a time lag (Jaffe, 1986). How-ever, there are other studies, which still show a little correlation between the level of R&D invest-ment and financial success (Morbey, 1988). Consequently, there is not sufficient evidence to sug-gest that making more R&D investment is always better for firms’ successes (McGrath & Romeri, 1994).
There have been discussions in the literature as to whether patents are simply an indicator of R&D expenditure or whether they measure the output of invention. Prior research indicated that patents have a strong relationship with ratings of basic research excellence (Narin & Noma, 1985; Narin, Noma, & Perry, 1987; Pavitt, 1991). However, there has been mixed support for the association between patents and patent citations (Artz, Norman, Hatfield, & Cardinal, 2010). There is also a finding that more R&D intensive firms have a greater tendency to patent (Grabowski, 1968). In this regard, Comanor and Scherer suggested that the number of patents is highly correlated with the number of research personnel (Comanor & Scherer, 1969). Mansfield’s view is also notable in that it was indicated that the propensity to patent has inter-industry and inter-firm difference and
dif-• Marketing • Business Planning • ㆍManufacturing • Engineering • Operations Society /Economy Activities • Research • Developing • Testing • Reporting Results • People • Ideas • Equipment • Facilities • Funds • Information • Specific Requests • Patents • Standards • Products • Processes • Services • Publications • Facts / Knowledge • Cost Reduction • Sales Improvement • Product Improvement • Capital Avoidance • Knowledge Accumulation • Education • Quality of Life • Gross National Product • Infrastructure
Inputs Outputs Outcomes
R&D Processes
Receiving System Impacts
Output measurement and Feedback
Outcome measurement and Feedback Impact measurement and Feedback
ference over time (Branch, 1974; Mansfield, 1986), and the qualities of patents vary enormously. Lastly, not all inventions or innovations are patented. In fact, the percentage of innovations patented is limited for the purpose of maintenance of confidentiality among other reasons (Arundel & Kabla, 1998).
Patents of a proprietary nature have been used for identifying inventions, innovations, and innova-tiveness in a number of studies (Arundel & Kabla, 1998; Coombs, Narandren, & Richards, 1996; Mansfield, 1986) – despite the fact that they, as intermediate elements, are not a direct measurement of their commercialization potential (Archibugi, 1992). Patents can be regarded as a medium to reflect the relevant firm’s intention to commercialize an innovative idea or invention. Thus, there has been a variety of index to estimate R&D performance by patents such as a total number of pat-ents filed or granted and a total number of patent citations with the most common output indicator being the total number of patents filed or granted. For the virtue of easy accessibility via objective databases, this article will select the total number of patents as an output variable to examine the relationships between technology forecast, technology planning activity, R&D performance, and business performance.
2.1.2. Products
Product innovations are outputs or services that are introduced for the benefit of customers or cli-ents (Utterback & Abernathy, 1975). Product innovations have a market focus and are primarily customer driven (Utterback & Abernathy, 1975). To gain or maintain a competitive advantage, a firm has to innovate for new products or services. The sustainable and profitable growth arises from new or improved products and services, new or improved processes, or new business models. In this regard, Francis indicated that corporate R&D should focus on upstream and final product engineering (Francis, 1992), and Wernerfelt also explained that a firm needs to keep growing its technological capability to protect its position (Wernerfelt, 1984). It is also important to note that the concept of new products should be determined first in order to measure R&D performance since “new” products can be defined in various ways based on a firm’s strategy and competitive environ-ment (Whiteley, Parish, Dressler, & Nicholson, 1998).
Notably, several studies of successful technological innovations indicated that they are most fre-quently applied to new products rather than processes (N. R. Baker, Siegman, & Rubenstein, 1967). In this regard, Kleinschmidt and Cooper examined the association between product innovativeness and profits at the product level (Kleinschmidt & Cooper, 1991). Moreover, many studies used “the number of new products released to the market” as a common quantitative index to measure R&D outputs (Francis, 1992; Galloway, 1971; Geisler, 1994; Rubenstein & Geisler, 1991; and Werner & Souder, 1997).
2.1.3. Processes
Process innovation can be defined as “new elements introduced into an organization’s production or service operations in order to produce a product or provide a service” (Barras, 1986; Damanpour & Gopalakrishnan, 2001; and Gopalakrishnan & Damanpour, 1997). Process innovations have an
internal focus and are primarily efficiency driven (Utterback & Abernathy, 1975). Under this view, R&D efforts should be directed toward enabling manufacturing processes that use new and differ-ent technology (Francis, 1992). Tushman, Abernathy and Utterback indicated that as an industry matures, the rate of product innovations diminishes and more efforts are focused on process inno-vations and manufacturing process improvements (Abernathy & Utterback, 1978; Tushman, 1997; and Utterback, 1994). Process innovation is important in that it is the central type of research that produces rapid effects on corporate profits (Kline, 1985). In particular, Davenport differentiated process innovation from process improvement, which seeks a lower level of change (Davenport, 1993); to measure the entire list of process contributions from R&D would be relatively complex (Galloway, 1971).
Geisler suggested the followings as intermediate R&D outputs: improved performance of process-es, processes used by others, and number of processes transferred to users or clients (Geisler, 1994). Galloway also indicated that R&D resources make a critical contribution for process improvement or the elaboration of an established product line for evaluation of R&D (Galloway, 1971). In addi-tion, Gold pointed out the following three types of contributions from R&D with respect to process: improvements in the capability and quality of existing processes, development of new processes yielding major commercial advantages over competitors, and advances in knowledge likely to gen-erate future improvements in processes (Gold, 1989).
2.1.4. Cost reduction
R&D tends to be applied to existing product extensions and process refinements as competitors try to reduce their production costs (Utterback & Abernathy, 1975); it is because cost reduction in existing products contributes to competitive performance. Patterson also indicated that technical in-novations may reduce the cost of existing operations (Patterson, 1983). In this regard, while cost re-duction seems to be an evident benefit for major R&D accomplishments, short-term cost rere-duction and short-term sales are often considered to be less significant for overall growth (Mitchell, 1990). As a result, Geisler proposed new indicators for R&D performance in this area including changes in the manufacturing cost of products and actual cost reduction in user’s performance/processes by considering the clients and the impactees (Geisler, 1994).
2.1.5. Publications
Publications are a common means by which technical knowledge circulates. Scientific publications may lead to technological innovations, which are a catalyst for new product or process develop-ment (Narin et al., 1987). In this regard, there is a view that the number of elite scientists in a firm is more highly correlated with publications rather than patents (Halperin & Chakrabarti, 1987), and resource intensive industries have more propensity to publish papers rather than patents when com-pared with capital intensive industries (Halperin & Chakrabarti, 1987). There is, however, a strong relationship between publications and patents in biotechnology (Narin & Noma, 1985).
as-sess both a university’s performance and an individual scientist’s performance as well as to measure scientific and technical outputs (Carpenter, Cooper, & Narin, 1980; Geisler, 1994; Hodge, 1963). Narin et al. suggested that papers can be a valuable indicator for the pharmaceutical industry (Narin et al., 1987) and Gambardella used the number of scientific publications as a proxy for the R&D capabilities of a firm (Gambardella, 1992). To overcome any potential limitation of the assessment based on a number of publications, Sher and Garfield examined the number and variety of citing publications for evaluating the work of individuals and organizations from a qualitative perspective (I. H. Sher & Garfield, 1965).
2.1.6. Standards
For polymer science and standards, Rubenstein and Geisler suggested a number of new or im-proved standards as an immediate output from federal laboratory science and technology programs (Rubenstein & Geisler, 1991). Their focused and in-depth study of one particular field demonstrates the emphasis of this article – that managers or researchers must develop R&D performance indexes suited for their own organizational settings.
2.1.7. Professional recognition
Professional recognition includes public speeches, prizes, honors, awards, press and media cover-age, reviewing and publishing articles and books, and serving in professional societies and gov-ernmental committees. In this regard, Francis suggested that such professional recognitions or technical accomplishments are useful for measurement of R&D effectiveness when an organization emphasizes basic and applied research over development engineering (Francis, 1992).
2.1.8. Technology transfer
Autio and Laamanen defined technology transfer as the “intentional and goal-oriented interaction between two or more social entities, during which the pool of technological knowledge remains stable or increases through transfer of one or more components of technology” (Autio & Laamanen, 1995). Technology transfer is a typical form of research transformation and the result of technol-ogy diffusion activities. Technoltechnol-ogy transfer is distinct and may be readily identifiable. Azzone and Maccarrone introduced the indices of tacit technology transfer in an informal form (Azzone & Maccarrone, 1997).
For an output indicator of R&D effectiveness, Geisler suggested a number of outputs transferred to users or clients (for example, products, ideas, and improvements) (Geisler, 1994). Autio and Laa-manen also addressed three types of output indicators of technology transfer: research and technol-ogy outputs, commercial outputs, and monetary and resource outputs (Autio & Laamanen, 1995). This output indicator includes economic senses in that firms’ net income can also be generated from royalties arising in relation to technology transfer.
2.1.9. Facts/Knowledge
Facts and knowledge include the number of technologies and practices formally transferred into operating units, number of requests of consultation on projects, participation in design review, and
improved capability of user to absorb/utilize technical knowledge (Francis, 1992; and Geisler, 1994). This indicator is also one of the technically driven criteria. However, there is a little research on this index to assess outputs from R&D performance. The non-availability of such information may cause difficulty in adopting this indicator for R&D measurement.
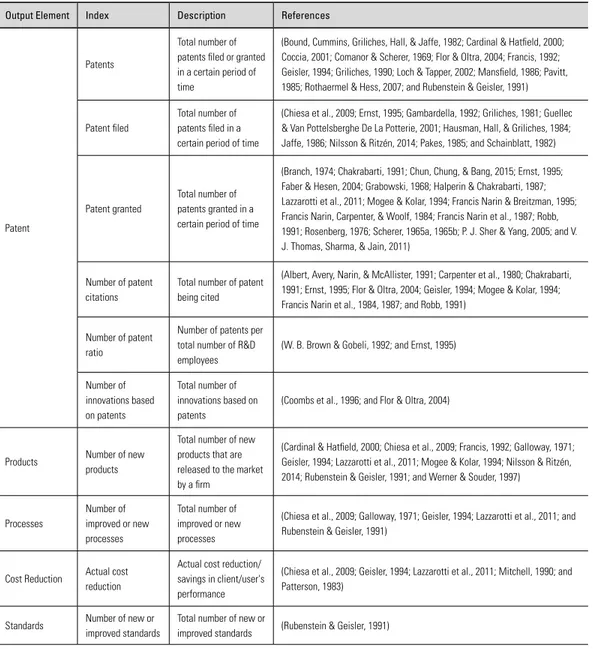
The following table summarizes the details of output indicators examined above.
TABLE 1. The Summary of Output Indicators from the Literature
Output Element Index Description References
Patent
Patents
Total number of patents filed or granted in a certain period of time
(Bound, Cummins, Griliches, Hall, & Jaffe, 1982; Cardinal & Hatfield, 2000; Coccia, 2001; Comanor & Scherer, 1969; Flor & Oltra, 2004; Francis, 1992; Geisler, 1994; Griliches, 1990; Loch & Tapper, 2002; Mansfield, 1986; Pavitt, 1985; Rothaermel & Hess, 2007; and Rubenstein & Geisler, 1991)
Patent filed
Total number of patents filed in a certain period of time
(Chiesa et al., 2009; Ernst, 1995; Gambardella, 1992; Griliches, 1981; Guellec & Van Pottelsberghe De La Potterie, 2001; Hausman, Hall, & Griliches, 1984; Jaffe, 1986; Nilsson & Ritzén, 2014; Pakes, 1985; and Schainblatt, 1982)
Patent granted
Total number of patents granted in a certain period of time
(Branch, 1974; Chakrabarti, 1991; Chun, Chung, & Bang, 2015; Ernst, 1995; Faber & Hesen, 2004; Grabowski, 1968; Halperin & Chakrabarti, 1987; Lazzarotti et al., 2011; Mogee & Kolar, 1994; Francis Narin & Breitzman, 1995; Francis Narin, Carpenter, & Woolf, 1984; Francis Narin et al., 1987; Robb, 1991; Rosenberg, 1976; Scherer, 1965a, 1965b; P. J. Sher & Yang, 2005; and V. J. Thomas, Sharma, & Jain, 2011)
Number of patent citations
Total number of patent being cited
(Albert, Avery, Narin, & McAllister, 1991; Carpenter et al., 1980; Chakrabarti, 1991; Ernst, 1995; Flor & Oltra, 2004; Geisler, 1994; Mogee & Kolar, 1994; Francis Narin et al., 1984, 1987; and Robb, 1991)
Number of patent ratio
Number of patents per total number of R&D employees
(W. B. Brown & Gobeli, 1992; and Ernst, 1995)
Number of innovations based on patents Total number of innovations based on patents
(Coombs et al., 1996; and Flor & Oltra, 2004)
Products Number of new products
Total number of new products that are released to the market by a firm
(Cardinal & Hatfield, 2000; Chiesa et al., 2009; Francis, 1992; Galloway, 1971; Geisler, 1994; Lazzarotti et al., 2011; Mogee & Kolar, 1994; Nilsson & Ritzén, 2014; Rubenstein & Geisler, 1991; and Werner & Souder, 1997)
Processes Number of improved or new processes Total number of improved or new processes
(Chiesa et al., 2009; Galloway, 1971; Geisler, 1994; Lazzarotti et al., 2011; and Rubenstein & Geisler, 1991)
Cost Reduction Actual cost reduction
Actual cost reduction/ savings in client/user's performance
(Chiesa et al., 2009; Geisler, 1994; Lazzarotti et al., 2011; Mitchell, 1990; and Patterson, 1983)
Standards Number of new or improved standards
Total number of new or
Professional
Recognition Awards and honors
Total number of awards and honors by a firm
(Francis, 1992; and Geisler, 1994)
Technology Transfer Number of technology transfer Overall transfer of outputs to external organizations
(Autio & Laamanen, 1995; and Geisler, 1994)
Number of alliances
Number of alliances dedicated to technological innovation
(Lazzarotti et al., 2011; and Nilsson & Ritzén, 2014)
Licensing Total licensing income (Autio & Laamanen, 1995; Balas & Elkin, 2013; Lazzarotti et al., 2011; and Robb, 1991)
Number of new jobs
Total number of new jobs created by spin-offs
(Autio & Laamanen, 1995)
Amounts of venture capital investment
Total number and amounts of venture capital investments in spin-offs
(Autio & Laamanen, 1995)
Publications Number of publications such as articles, reports, and books Total number of publications by a firm
(Chiesa et al., 2009; Coccia, 2001; Francis, 1992; Gambardella, 1992; Halperin & Chakrabarti, 1987; Hodge, 1963; Lazzarotti et al., 2011; Loch & Tapper, 2002; Mogee & Kolar, 1994; Francis Narin et al., 1987; Quinn, 1959; and V. J. Thomas et al., 2011) Number of requests of reports Total number of request of reports by elsewhere in the company and from outside
(Francis, 1992; and Geisler, 1994)
Number of publication citations
Total number of publication being cited
(Carpenter et al., 1980; Chiesa et al., 2009; Geisler, 1994; and I. H. Sher & Garfield, 1965)
Impact factor
Research impact is higher than the worldwide average in the subfield as a relative index
(Luwel, Noyons, & Moed, 1999)
Facts/ Knowledge Number of technologies and practices Total number of technologies and practices transferred into operating units
(Francis, 1992; and Quinn, 1959)
Number of requests of consulting Total number of requests of consultation on projects and participation in design review (Francis, 1992)
Information and its use by others
Improved capability of user to absorb/utilize technical knowledge
2.2. Measuring business performance
Mitchell suggested a single system for the strategic management of technology in planning frame-works, which helps firms to deal with the issues of technological change, and their impact on strategy (Mitchell, 1990). Cooper indicated that firms’ strategies reveal the nature of technology employed (Cooper, 1986), and conversely, emerging technology may lead to development of new businesses and even cause a significant change in corporate strategy (Tennenhouse, 2004). For firms in research-intensive industries, technology innovation is especially important in driving their growth and competitiveness.
Thus, strategy is one of the major determinants of business performance (Loch & Tapper, 2002), and R&D is a cornerstone of an effective innovation strategy (Holak, Parry, & Song, 1991). A firm must deploy R&D investments more strategically as well as effectively. In particular, technology-focused firms consider technology as their primary asset in business strategy. Furthermore, R&D must be connected with a firm’s overall business strategy, (Roussel et al., 1991) which in turn is coupled with technology strategy. In other words, technology strategy needs to be a subset of the strategic plan (Krajewski, 2003) – that is, a firm’s overall business strategy.
In the foregoing context, planning is an integral part of strategy formulation (Leontiades & Tezel, 1980). In technology-focused companies, the planning systems incorporate technology plans as an integral part of business plan (Frohman, 1982). In fact, one of significant contributing factors to corporate success is a formal planning system (Leontiades & Tezel, 1980). For example, Drucker indicated that planning should be an integral part of a well-managed company (Drucker, 1959). There are several studies conducted to measure the financial impact of strategic planning. Thune and House showed a strong relationship between formal planning and financial performance for firms in six industries (Thune & House, 1970). Karger and Malik also found a positive relation-ship between formal integrated long-range planning and economic performance involving capital spending, stock price, and distribution of earnings for seven industries (Karger & Malik, 1975). Wood and LaForge indicated a strong association between comprehensive long range planning and subsequent financial performance for a bank industry (Wood Jr & LaForge, 1979).
Meanwhile, Kudla indicated that there is no relationship between formal planning and financial performance (Kudla, 1980). Based on the comparative analysis, Armstrong found formal planners were superior in ten cases and concluded planning seemed most useful in situations involving large changes (Armstrong, 1982). However, although research on the relationship between planning and performance has yielded inconsistent results (Fulmer & Rue, 1974; Rhyne, 1986), a meta-analysis of 26 studies provides valuable insights by indicating that strategic planning has a positive relation-ship with firm performance (Miller & Cardinal, 1994). In a recent study, based on a meta-analysis of 46 studies, Brinckmann et al. also found a positive association between business planning and performance in small firms (Brinckmann, Grichnik, & Kapsa, 2010).
The technology planning and corporate strategic planning processes must complement each other in order to manage R&D purposefully and strategically (Fusfeld, 1989). Fusfeld emphasized that a firm must learn to integrate technology management with strategic planning (Fusfeld, 1989). In general, firms continue to manage and plan their strategies in a way that they are accustomed to rap-idly and drastically changing environment. Zahra and Covin investigated the relationships among business strategy, technology policy, and firm performance (Zahra & Covin, 1993) and Zahra also examined the association between technology strategy and financial performance while considering moderating effect of the environment (Zahra, 1996).
Additionally, Franko examined the effect of R&D factor in worldwide corporate performance and tested the association between corporate R&D intensity and sales growth and world market share (Franko, 1989). He stressed the crucial role of technology in the growth of individual industrial firms, and Mendigorri et al. selected four important factors in the form of firm’s R&D activities, in-tegration of R&D activities with business strategy, R&D planning, and cross-functional inin-tegration influence on the R&D effectiveness (Mendigorri et al., 2016). They also provided evidence of posi-tive relationship between R&D effecposi-tiveness and firms’ financial performance.
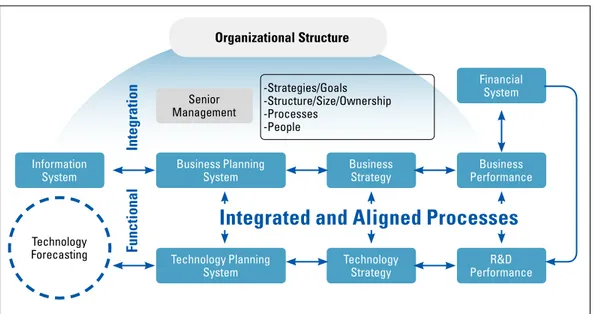
On this subject, Leonard indicated that there is a causal influence of R&D intensity on the rate of sales growth (Leonard, 1971). In fact, profit and R&D have a recursive relationship and influence to one another (Branch, 1974). The important question in this context is how to capture expected returns from R&D. Illustrated in Figure 2 are all of list-ups and associations among technology forecasting (TF), information system, technology planning, business planning, technology strategy, business strategy, R&D performance, business performance, and financial system as described above.
FIGURE 2. The Overview of Technology to Business Management
Information System Technology Forecasting ㆍ-Strategies/Goals ㆍ-Structure/Size/Ownership ㆍ-Processes ㆍ-People Business Strategy Senior Management Technology Strategy Business Performance Financial System R&D Performance Business Planning System Technology Planning System
Integrated and Aligned Processes
Functional
Integration
As explained above, a number of outcome indicators can be identified from the literature. Schol-ars and practitioners have been using partly different indicators to measure business performance (Griffin & Page, 1993). In this article, the measurement of business performance focuses more on outcome indicators than outputs or impact indicators since data conveys economic sense. For example, more patents lead to a subsequent change in business performances such as sales growth or profit increase (Pakes & Griliches, 1980; and Scherer, 1965a). Such new invention should lead, eventually, to the generation of financial profit.
There is no significant trend favoring a single measure of firm performance. Due to cost-effec-tiveness as well as absence of viable alternative, many studies employ subjective measurements of firm’s performance (Wall et al., 2004). In particular, Tit is difficult to obtain financial data from small firms (Dess & Robinson, 1984). In addition, several studies provide evidence that subjective measures of overall firm performance are closely associated with objective ones (Bommer, John-son, Rich, Podsakoff, & MacKenzie, 1995; Dess & RobinJohn-son, 1984; Robinson & Pearce II, 1988). In this regard, it is notable that Miller and Cardinal investigated 35 previous studies and suggested the most popular performance variables as follows: sales growth, earnings growth, deposit growth, return on assets, return on equity, return on sales, and return on total invested capital (Miller & Car-dinal, 1994). However, it is important to remember that Standards for firm’s effectiveness, however, vary widely from industry to industry (Rhyne, 1986). Consequently, the selection of a performance index is inevitably arbitrary, and this article will discuss the economic measures of firm perfor-mance.
2.2.1. Sales
The rationale for using sales as a measure of business performance is based on the fact that, despite its several limitations, this measure has been extensively used in the past research that examined the relationship between technology forecasting characteristics and business performance (Rhyne, 1986; Zahra, 1996). The most common indicator in relation thereto is sales growth. Growth in sales reflects how well organizations relate to their environment, (Hofer & Schendel, 1978) and many studies used sales growth as a measure of the extent to which a firm’s innovative activities stimulate revenue growth (Artz et al., 2010).
Like other business performance measures, sales indicators have limitations. However, sales indi-cators, which include total sales of a firm in a certain period, sales of new products, sales growth, sales per employee, and return on sales, are still useful. In fact, Parasuraman and Zeren suggested that sales may be a more meaningful yardstick than profits or earning for evaluating R&D effective-ness (Parasuraman & Zeren, 1983), and Fulmer and Rue, for example, used the average of annual percentage sales growth experienced over the last three years in their study (Fulmer & Rue, 1974). The sales growth figures are normally based on nominal sales, (Morbey, 1988) and Morbey found a strong relationship between R&D spending and growth in sales (Morbey, 1988). Meanwhile, there is a view that return on sales (ROS) fails to capture the relative effectiveness of firm’s use of assets (Harling & Funk, 1987).
2.2.2. Revenue
Few studies have used revenue to measure a firm’s business performance. Bracker and Pearson used revenue growth for financial performance data, which is the absolute annual percentage of growth rates during a certain period of time examined (Bracker & Pearson, 1986). Griffin and Page also indicated that revenue can be used to measure customer acceptance in both short (one-year) and long terms (four to five-years) (Griffin & Page, 1993).
2.2.3. Earning
The earnings per share (EPS) are the computed annual rates of change in percentage. Thune and House measured financial performance with earnings per common share, which is a portion of a firm’s profit allocated to each outstanding share of common stock (Thune & House, 1970). Narin et al. measured the increase in average annual percentage change in firm’s earnings per common share (current dollars) (Narin et al., 1987).
2.2.4. Profit
For the R&D effectiveness index, McGrath and Romeri suggested the new product profit, which can be calculated by multiplying the percentage of revenue from products introduced in the last three years by the rate of net profit combined with the percentage of R&D investment (McGrath & Romeri, 1994). Grabowski and Mueller used profit rates to determine profitability (Grabowski & Mueller, 1978) and they examined the association between profit rates and R&D intensities. Leon-ard also focused on the association between the firm’s profit and R&D intensity, which is measured by R&D investment over net sales (Leonard, 1971). With respect to the R&D effectiveness index from new products, McGrath and Romeri suggested a representative average profit from a new product rather than actual profit due to limited accuracy (McGrath & Romeri, 1994). They also in-dicated difficulties in identifying the actual profit of individual products. In fact, many studies use seven different types of profit for determining financial performance: profit of new products, total profits of a firm in a certain period of time, profit margins, net income after tax, net worth, profit rates, and profit growth.
2.2.5. Return on investment (ROI)
The private research sector is notorious for a close linkage between R&D and return on investment (ROI). This ROI approach is based on a comparison of the cost of R&D over a period of years with the earnings contribution made by products from R&D over the said period (Galloway, 1971). Unfortunately, an accurate measurement of ROI on R&D is not a clear-cut process. For measuring the R&D effectiveness, ROI can be a misleading indicator because it simply depends on a measure of net income or profit at a given time instead of over a certain period of time (Morbey, 1988). In other words, ROI accounts for only present activities focusing on short-term profitability. Mechlin and Berg also pointed out that the use of ROI criteria might lead to a decrease in R&D investment (Mechlin & Berg, 1980). One reason for this finding is that technological innovations usually take several years to produce a commercial – and most of times unpredictable – success (Mechlin & Berg, 1980). For example, Westinghouse spent over 30 years developing a superconducting genera-tor, (Mechlin & Berg, 1980) and Dupont took about ten years to introduce nylon products to
cus-tomers (American Chemical Society, 1995).
Furthermore, it is significant to note that R&D investment is embedded in ROI, which may cause artifactual results due to variable construction (Anderson & Paine, 1978). Also, some studies provided evidence to support that there is a positive relationship between market share and ROI (Buzzell, Gale, & Sultan, 1975; and Schoeffler, Buzzell, & Heany, 1974). Lastly, Wagner identified nineteen factors in subgroups of three categories such as competitive and market factors, sales and expense ratios, and investment and employment ratios, which affect ROI (Wagner, 1984).
2.2.6. Return on equity (ROE)
Several studies employed return on equity as a measure for determining firm performance. Rhyne used one year return on equity (both absolute and relative) to the planning (Rhyne, 1986). Thune and House also measured financial performance in terms of return on equity (Thune & House, 1970). Leontiades and Tezel used five different measures for investigating economic performance including return on equity (ROE) (Leontiades & Tezel, 1980). Lastly, Robinson and Pearce em-ployed a percentage change approach based on the average performance over time in ROE (Robin-son & Pearce II, 1983).
2.2.7. Asset
After tax return on total assets is commonly regarded as one operational measure of the efficiency of a firm regarding the profitable use of its total asset base (Bourgeois, 1980; Gale, 1972). In this regard, return on assets (ROA) is one of the easily obtainable and widely circulated measures of firm’s financial performance (McGuire, Schneeweis, & Branch, 1990). There are many innovation studies, which use ROA as a measure of profitability (Artz et al., 2010; Roberts & Amit, 2003; and P. J. Sher & Yang, 2005).
For example, Fredrickson and Mitchell used the average after tax return on assets for the most re-cent five years to assess financial performance (Fredrickson & Mitchell, 1984). Several studies used the average pretax ROA for the previous three-year period to measure economic performance (G. A. Baker, 2003; and Cho & Pucik, 2005). Baker proposed the ROA measure instead of sales growth or return on equity due to ROA’s common usage as well as its comprehensive nature as a financial measurement (G. A. Baker, 2003). He also pointed out that a three-year average return on assets is a good compromise measure rather than an one-year average return or an over four-year average return because of the issues of time sensitivity as well as data availability. ROA is a useful measure of how well a firm has used its funds (Harling & Funk, 1987) and ROA is highly associated with re-turn on sales (Steensma & Corley, 2000). Harling and Funk pointed out that ROA is free from bias imposed by differences in capital structure, which are caused by financial leverage through high debt/equity ratios (Harling & Funk, 1987).
Return on assets (ROA), however, also has limitations since it is distorted by previous spending decisions (Zahra, 1996). Several previous studies used different types of asset index such as assets growth and net assets per share. Grinyer and Norburn used net assets per share to assess the
effec-tiveness of planning on financial performance (Grinyer & Norburn, 1975).
2.2.8. Stock
Kudla used stock returns on average as a measure of effects of formal planning on financial perfor-mance (Kudla, 1980). He argued that financial perforperfor-mance is measured by common stock returns since business finance is heavily focused on maximizing stockholders’ wealth. Several studies em-ployed stock market values to determine the effects of planning on economic performance.
2.2.9. Market share
It has been widely accepted that one of the major measurements of business profitability is market share (Buzzell et al., 1975). Market share is positively related with financial performance (Capon, Farley, & Hoenig, 1990). For example, market share and ROI are strongly associated with each other (Buzzell et al., 1975), and Gale found a positive relationship between market share and the rate of profitability (Gale, 1972). Moorman used market share relative to its stated objective to measure new product performance (Moorman, 1995). Deshpandé et al. also measured financial per-formance using market share (Deshpandé, Farley, & Webster, 1993). However, market share, as an indicator, should be used carefully because a low market share is not necessarily indicative of poor performance for the R&D community; conversely, a high or growing market share almost certainly indicates effective technical efforts (Steele, 1988).
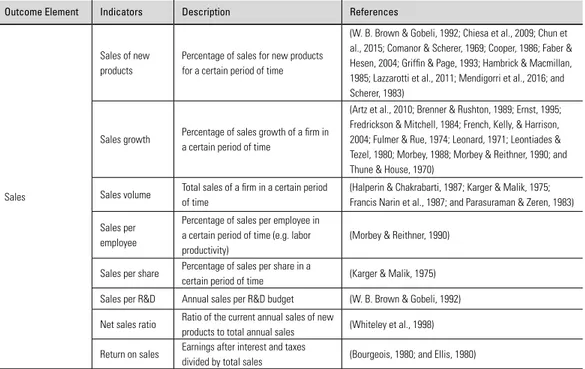
The following table summarizes the details of outcome indicators examined above.
TABLE 2. The Summary of Outcome Indicators from the Literature
Outcome Element Indicators Description References
Sales
Sales of new products
Percentage of sales for new products for a certain period of time
(W. B. Brown & Gobeli, 1992; Chiesa et al., 2009; Chun et al., 2015; Comanor & Scherer, 1969; Cooper, 1986; Faber & Hesen, 2004; Griffin & Page, 1993; Hambrick & Macmillan, 1985; Lazzarotti et al., 2011; Mendigorri et al., 2016; and Scherer, 1983)
Sales growth Percentage of sales growth of a firm in a certain period of time
(Artz et al., 2010; Brenner & Rushton, 1989; Ernst, 1995; Fredrickson & Mitchell, 1984; French, Kelly, & Harrison, 2004; Fulmer & Rue, 1974; Leonard, 1971; Leontiades & Tezel, 1980; Morbey, 1988; Morbey & Reithner, 1990; and Thune & House, 1970)
Sales volume Total sales of a firm in a certain period of time
(Halperin & Chakrabarti, 1987; Karger & Malik, 1975; Francis Narin et al., 1987; and Parasuraman & Zeren, 1983) Sales per
employee
Percentage of sales per employee in a certain period of time (e.g. labor productivity)
(Morbey & Reithner, 1990) Sales per share Percentage of sales per share in a
certain period of time (Karger & Malik, 1975) Sales per R&D Annual sales per R&D budget (W. B. Brown & Gobeli, 1992) Net sales ratio Ratio of the current annual sales of new
products to total annual sales (Whiteley et al., 1998) Return on sales Earnings after interest and taxes
Revenue Revenue growth Percentage of revenue growth of a firm
in a certain period of time (Bracker & Pearson, 1986; and Griffin & Page, 1993)
Earning
Earnings growth Average annual percentage earning growth in a certain period of time
(Bourgeois, 1980; Fulmer & Rue, 1974; and Francis Narin et al., 1987)
Earnings/sales ratio
Average value of the earning/sales ratio
over the last three years (Fulmer & Rue, 1974) Earnings/total
capital
Average earnings/total capital over the
last three years (Bourgeois, 1980; and Fulmer & Rue, 1974) Earnings per
share (EPS)
Portion of a firm's profit allocated to each outstanding share of common stock
(Bourgeois, 1980; Grinyer & Norburn, 1975; Karger & Malik, 1975; Francis Narin et al., 1987; and Thune & House, 1970)
Profit
Profit of new products
Percentage of profit of new products in
a certain period of time (McGrath & Romeri, 1994; and Quinn, 1959) Profits Total profits of a firm in a certain period
of time
(Galloway, 1971; Herold, 1972; and Parasuraman & Zeren, 1983)
Profit margins Percentage of profits of assets in a
certain period of time (Morbey & Reithner, 1990; and Robinson & Pearce II, 1983) Net income after
tax
Percentage of revenue that is reflected in net income after tax for a certain period of time
(French et al., 2004; Leonard, 1971; and Wood Jr & LaForge, 1979)
Net worth
Percentage of revenue that is reflected in net worth or profit for a certain period of time
(Leonard, 1971; and Reynard, 1979) Profit rates After tax profit rate (Grabowski & Mueller, 1978) Profit growth Percentage of profit growth of a
corporation in a certain period of time (Morbey, 1989)
Return on Investment (ROI)
ROI
Percentage of change of the ratio of net, pretax operating income to average investment for a certain period of time
(W. B. Brown & Gobeli, 1992; Chiesa et al., 2009; Cho & Pucik, 2005; Kleinschmidt & Cooper, 1991; Schoeffler et al., 1974; and Wagner, 1984)
ROI of new products
Number of years from the beginning of the investment
until it is paid off
(Boulding & Staelin, 1995)
Return on Equity ROE Net income divided by shareholder's equity
(Cho & Pucik, 2005; Leontiades & Tezel, 1980; Rhyne, 1986; Robinson & Pearce II, 1983; and Thune & House, 1970)
Asset
Return on Assets (ROA)
Net earnings before interest and taxes divided by total assets
(G. A. Baker, 2003; Bayona-Sáez & García-Marco, 2010; Bourgeois, 1980; Cho & Pucik, 2005; Fredrickson & Mitchell, 1984; Grinyer & Norburn, 1975; Hoskisson, Hitt, Johnson, & Moesel, 1993; Leontiades & Tezel, 1980; Michelino, Lamberti, Cammarano, & Caputo, 2015; Robinson & Pearce II, 1983; P. J. Sher & Yang, 2005; and Zahra, 1996)
Assets growth Percentage of assets growth of
companies in a certain period of time (Leonard, 1971) Net assets per
share
Net assets per share in a certain period
Stock
Stock Market Value
Value of stock market of a company and stock price, change in the stock market value.
(Brenner & Rushton, 1989; Karger & Malik, 1975; Pakes, 1985; and Thune & House, 1970)
Stock returns Total return including interest, capital
gains, dividends and distributions (Kudla, 1980)
Market share
Percentage of increased market share or the ratio of dollar sales by a business relative to its targeted objective in a given time period
(W. B. Brown & Gobeli, 1992; Buzzell et al., 1975; Deshpandé et al., 1993; Griffin & Page, 1993; Kleinschmidt & Cooper, 1991; Moorman, 1995; and Rosenberg, 1976)
3. CONCEPTUALIZATION
Based on the prior studies and strategic management theory, this section of the article will address the theoretical support for the development of the research hypotheses.
The environmental scanning element stands at the juncture of forecasting, foresight and strategy (Beat, 2000; Donald C. Hambrick, 1981; Fahey, King, & Narayanan, 1981; Martino, 2003; and Slaughter, 1999). Thomas classified environmental levels into the following three: general environ-ment (the national and global context of social, political, regulatory, economic and technological conditions); operating environment (the set of supplier and other interest groups with which the firm deals); and internal environment (within the firm’s official jurisdiction) (P. S. Thomas, 1974). Environmental scanning covers not only markets, products, competitors, suppliers, and customers, but also includes technology, economic conditions, political and regulatory environment, and so-cial and demographic trends (Slaughter, 1999; and Voros, Choo, & Slaughter, 2003). Furthermore, environmental scanning includes both cases of looking at information (viewing) and looking for information (searching) (Voros et al., 2003). ICT makes a firm easily accessible to acquire environ-mental information. Therefore, it is required for a firm to develop effective information processing capability for acquiring and using information about major breakthrough technologies and core technology improvements (Choudhury & Sampler, 1997; Dollinger, 1984; and Hambrick, 1982). Technology forecasting is integrated with information management system within firms. It is sig-nificant to note that firms must learn how to deploy technology forecasting with information system as a complementary organization process. Several studies have been carried out on the relation-ships between firm performance, information technology system, and the use of information system (Ahituv, Zif, & Machlin, 1998; Christmann, 2007; Dollinger, 1984; Li & Richard Ye, 1999; Moor-man, 1995). These studies found a positive association between information processing capability and firm performance.
Tushman, Abernathy and Utterback also argued that it is important to understand the life cycle of innovation or technology, which helps a firm to predict the timing of radical change (Abernathy & Utterback, 1978; Tushman, 1997; Utterback, 1994). Several studies described innovation streams
in both incremental and discontinuous innovations, which illustrate the evolutionary cycle of in-novations with the technological discontinuity phase, dominant design phase, and retention phase (Tushman, 1997; Utterback, 1994). If a firm manages innovation and change, it must acknowledge these streams of innovations. During the dominant design stage, R&D efforts shift from major product innovation to process innovation and incremental innovation (Afuah & Utterback, 1997). In this phase, technology monitoring and TF activities in technology or strategic planning would be reduced compared to the technological variation phase. These hypotheses are based on a belief that TF activities within a firm are more likely to focus on radical innovations instead of incremental in-novations from R&D efforts – due to increases of uncertainty and risk on business environment.
Proposition1a: Technology forecasting will be pursued most by firms, which develop radical technology, product, and service.
Proposition1b: Technology forecasting will be pursued least by firms, which develop in-cremental technology, product, and service.
Technology forecasting has evolved as a means for strategic planning in a firm (Linstone, 1989). Erich Jantsch categorized the scope of technological forecasting into the following three planning levels: policy planning, strategic planning, and tactical planning (Jantsch, 1969). At the strategic planning level, TF is used to enrich this basis for strategic selection (Jantsch, 1969). For tactical planning, TF involves the probabilistic assessment of future technology transfer (Jantsch, 1969). At the policy planning level, TF focuses more on basic scientific-technological potentials and limita-tions as well as ultimate outcomes in a large systematic context (Jantsch, 1969). Firms must be able to integrate technology planning with strategic planning so that they may deal with technological evolutions (Fusfeld, 1989). Fusfeld suggested that R&D managers and other senior management group should work together to formulate and execute complementary technology and strategic plans (Fusfeld, 1989). In this regard, TF plays a crucial role in developing a technology plan (Fusfeld, 1989). However, a variety of use of TF makes it difficult to measure its contribution as a source of R&D performance and business performance. R&D funding is allocated through tech-nology forecasting, techtech-nology evaluation for project selection, techtech-nology strategy, and strategic planning.
Technology planning is critical both for cost-competitiveness and differentiation in business strate-gies (McGaughey, 1990). TF plays a significant role to identify areas for research in many firms during their planning process (Quinn, 1961). Frederick Betz also described TF as a critical step in technology and business planning to predict and implement technological changes in a firm with the consideration of new product development, production, and marketing (Betz, 2003). It is sig-nificant to note that a structured process for technology planning should be established in a firm (Metz, 1996). This process helps a firm to identify its competitive advantage by providing a picture of R&D’s role in business success. Technology forecasting is necessary to predict promising alter-natives and assess alteralter-natives in the planning process (Hogarth & Makridakis, 1981). Technology forecasting, technology planning, technology strategy, business strategy, product lines, and R&D funding are all tied and interconnected together.
Proposition 2: The appropriate selection of data and technology forecasting methods will enhance a firm’s capability to compete in its market through effective technology planning.
Careful forecasting clearly identifies customer’s technological needs and the technological threats and opportunities relevant to the firm’s strategic goals (Quinn, 1961). Baker et al. suggested that a success of R&D projects highly depends on how to resolve the initial uncertainty associated with their technical and commercial goals and objectives (N. R. Baker, Green, & Bean, 1986). Although R&D progress also depends on non-technical factors such as investment, staff size, facilities, mo-rale, and top management support (Millett, 1990), it appears reasonable to expect that systematic forecasting exhibits varying degrees of effectiveness of R&D.
On the other hand, technical performance can be used as a measure of R&D. Technological inven-tions and innovainven-tions have been playing a significant role for a firm to compete in a targeted market. Patents would be regarded as an output of technically successful R&D activities. Scherer suggested a positive relationship between patents and R&D investment in U.S corporations by varying de-grees depending on industry sectors (Scherer, 1983). The more R&D intensive firms have a greater tendency to patent their inventions (Grabowski, 1968). However, there have been discussions in the literature as to whether patents are simply an indicator of R&D expenditure or whether they mea-sure the output of invention.
The objective probability of success ratings from technology forecasting on selected R&D proj-ects in the technology planning process is correlated with the eventual success and failure of these projects. Consequently, this research aims to investigate the effect of technology planning with TF on the R&D performance based on the proposition that technology planning activities will be posi-tively related to R&D performance.
Proposition 3: R&D performance is a positive function of firms that drive technology planning with TF activities most at the firm level
The participation of TF in long-range company goals setting is a good indicator of the degree to which R&D is integrated into the company as a whole (Poensgen & Hort, 1983). With deliberate attention to the foregoing, technology should be managed strategically. Quinn and Mueller em-phasized that a systematic planning process and management skills are required not only to align R&D efforts with the company’s business goals, but also to effectively transfer research outcomes to commercial success (Quinn & Mueller, 1963). Roy Rothwell pointed out that good technol-ogy planning and management techniques are one of the success factors for innovation (Rothwell, 1986). The empirical evidence for such a claim is thin, however.
TF plays various roles in formulating business strategy (Swager, 1972) as well as setting long-term goals. Technological opportunity captured by technology forecasting must have market reference. Cooper indicated that top performing firms possess the most active idea-search efforts across all firms to identify market needs, while poor performing firms have the most passive idea-search
ef-forts with the weakest R&D orientation of all firms (Cooper, 1986). A series of empirical studies have provided mixed support for the association between corporate planning and business per-formance (Fulmer & Rue, 1974; Kudla, 1980; Rhyne, 1986). Despite the wide recognition of the importance of technology planning, the association between technology planning and business per-formance has not, in general, been well documented empirically in the literature. This hypothesis is based on the belief that firms that have systematic technology planning activities are more likely to identify opportunities and threats that could significantly result in commercial successes from R&D efforts in the operation.
Proposition 4: Business performance is a positive function of firms that drive technol-ogy planning with technoltechnol-ogy forecasting activities most at corporate level
4. CONCLUSIONS
This article tackles the issue of how the outputs and outcomes of R&D activities can be measured. The main issue with measuring R&D outputs and outcomes arises from the fact that they are a multi-dimensional phenomenon. This article explores the metrics of R&D performance and busi-ness performance and proposes linkages between technology forecasting, technology planning, R&D performance, and business performance based on the literature review. An advantage of the proposed research is to provide an appropriate organizational decision making metrics to effective-ly assist in strategic technology planning and technology assessment.
The proposed hypothetical framework can be used not only to examine how firms across sectors implement and facilitate organizational functions and strategic technology planning in U.S. com-panies but also to improve the effectiveness of technology forecasting in strategic planning by capturing technology characteristics in various industries. This article provides a comprehensive il-lustration of some of the most common metrics used for evaluating R&D performance and business performance in order to assist policy makers, universities, research institutes/national laboratories, and companies to enhance the decision making process on technology development and new re-search fields.
REFERENCES
Abernathy, W. J., & Utterback, J. M. (1978). Patterns of industrial innovation. Technology Review, 80(7), 41–47.
Afu ah, A. N., & Utterback, J. M. (1997). Responding to structural industry changes: a technological evolution perspective.
Industrial and Corporate Change, 6(1), 183–202.
Ahi tuv, N., Zif, J., & Machlin, I. (1998). Environmental scanning and information systems in relation to success in introduc-ing new products. Information & Management, 33, 201–211.
Alb ert, M. B., Avery, D., Narin, F., & McAllister, P. (1991). Direct validation of citation counts as indicators of industrially important patents. Research Policy, 20(3), 251–259.
Am erican Chemical Society. (1995). The first nylon plant. Office of Public Outreach. Delaware.
And erson, C. R., & Paine, F. T. (1978). PIMS: a reexamination. The Academy of Management Review, 3(3), 602–612. Andrews, K. R. (1971). The Concept of Corporate Strategy. Homewood, Ill.: Dow Jones-Irwin.
Archibugi, D. (1992). Patenting as an indicator of technological innovation: a review. Science and Public Policy.
Ar mstrong, J. S. (1982). The value of formal planning for strategic decisions: review of empirical research. Strategic
Man-agement Journal, 3(3), 197–211.
Art z, K. W., Norman, P. M., Hatfield, D. E., & Cardinal, L. B. (2010). A longitudinal study of the impact of R&D, patents, and product innovation on firm performance. Journal of Product Innovation Management, 27(5), 725–740.
Ar undel, A., & Kabla, I. (1998). What percentage of innovations are patented? Empirical estimates for European firms.
Re-search Policy, 27(2), 127–141.
Au tio, E., & Laamanen, T. (1995). Measurement and evaluation of technology transfer: review of technology transfer mech-anisms and indicators. International Journal of Technology Mangement, 10(7/8), 643–664.
Az zone, G., & Maccarrone, P. (1997). The emerging role of lean infrastructures in technology transfer: The case of the In-novation Plaza project. TechIn-novation, 17(7), 391–402.
Ba ker, G. A. (2003). Strategic planning and financial performance in the food processing sector. Review of Agricultural
Eco-nomics, 25(2), 470–482.
Baker, N. R., Green, S. G., & Bean, A. S. (1986). Why R&D projects succeed or fail. Research Management, 29(6). Ba ker, N. R., Siegman, J., & Rubenstein, A. H. (1967). The effects of perceived needs and means on the generation of ideas
for industrial research and development projects. IEEE Transactions on Engineering Management, 14(4), 156–164. Ba las, E. A., & Elkin, P. L. (2013). Technology transfer from biomedical research to clinical practice: measuring innovation
performance. Evaluation & the Health Professions, 36(4), 505–517.
Ba rney, J. B. (1986). Strategic factor markets: Expectations, luck, and business strategy. Management Science, 32(10), 1231–1241.
Barney, J. B. (1991). Firm resources and sustained competitive advantage. Journal of Management, 17(1), 99–120. Ba rney, J. B. (2001). Resource-based theories of competitive advantage: a ten-year retrospective on the resource-based view.
Journal of Management, 27(6), 643–650.
Barras, R. (1986). Towards a theory of innovation in services. Research Policy, 15(4), 161–173.
Ba yona-Sáez, C., & García-Marco, T. (2010). Assessing the effectiveness of the Eureka Program. Research Policy, 39(10), 1375–1386.
Be at, R. M. (2000). Competing Effectively : Environmental Scanning , Competitive Strategy , and Organizational Perfor-mance in Small Manufacturing Eirms. Journal of Small Business Management, 38(1), 27.
Be tz, F. (2003). Managing Technological Innovation: Competitive Advantage from Change (2nd ed.). New Jersey: John Wi-ley & Sons, Inc.
Bø ler, E. A., Moxnes, A., & Ulltveit-Moe, K. H. (2015). R&D, international sourcing, and the joint impact on firm perfor-mance. American Economic Review, 105(12), 3704–3739.
Bo mmer, W. H., Johnson, J. L., Rich, G. A., Podsakoff, P. M., & MacKenzie, S. B. (1995). On the interchangeability of ob-jective and subob-jective measures of employee performance: a meta-analysis. Personnel Psychology, 48(3), 587–605. Bo ulding, W., & Staelin, R. (1995). Identifying generalizable effects of strategic actions on firm performance: the case of
demand-side returns to R&D spending. Marketing Science, 14(3 Supplement), G222–G236.
Bo und, J., Cummins, C., Griliches, Z., Hall, B. H., & Jaffe, A. B. (1982). Who does R&D and who patents? NBER Working
Papar Series.
Bo urgeois, L. J. (1980). Performance and consensus. Strategic Management Journal, 1(3), 227–248.
Bo zeman, B., & Melkers, J. (1993). Evaluating R&D Impacts: Methods and Practice. (B. Bozeman & J. Melkers, Eds.). Kluewer Academic Publishers.
Br acker, J. S., & Pearson, J. N. (1986). Planning and financial performance of small, mature firms. Strategic Management
Journal, 7(6), 503–522.
Br anch, B. (1974). Research and development activity and profitability: a distributed lag analysis. Journal of Political
Econ-omy, 82(5), 999–1011.
Br emser, W. G., & Barsky, N. P. (2004). Utilizing the balanced scorecard for R&D performance measurement. R&D
Man-agement, 34(3), 229–238.
Br enner, M. S., & Rushton, B. M. (1989). Sales growth and R&D in the chemical industry. Research Technology
Manage-ment, 32(2), 8–15.
Bri nckmann, J., Grichnik, D., & Kapsa, D. (2010). Should entrepreneurs plan or just storm the castle? A meta-analysis on contextual factors impacting the business planning-performance relationship in small firms. Journal of Business
Ventur-ing, 25(1), 24–40.
Brown, M. G., & Svenson, R. A. (1998). Measuring R&D productivity. Research Technology Management, 41(6), 30–35. Bro wn, W. B., & Gobeli, D. (1992). Observations on the measurement of R&D productivity: a case study. Engineering
Man-agement, IEEE Transactions On, 39(4), 325–331.
Bu zzell, R. D., Gale, B. T., & Sultan, R. G. (1975). Market share: key to profitability? Harvard Business Review, 53(1), 97–106.
Ca pon, N., Farley, J. U., & Hoenig, S. (1990). Determinants of financial performance: a meta-analysis. Management
Sci-ence, 36(10), 1143–1159.
Ca rdinal, L. B., & Hatfield, D. E. (2000). Internal knowledge generation: The research laboratory and innovative productiv-ity in the pharmaceutical industry. Journal of Engineering and Technology Management, 17(3), 247–271.
Ca rpenter, M. P., Cooper, M., & Narin, F. (1980). Linkage between basic research literature and patents. Research
Manage-ment, 23(2), 30–35.
Ch akrabarti, A. K. (1991). Competition in high technology: analysis of patents of US, Japan, UK, France, West Germany, and Canada. IEEE Transactions on Engineering Management, 38(1), 78–84.
Chi esa, V., Frattini, F., Lazzarotti, V., & Manzini, R. (2009). Performance measurement in R&D: Exploring the interplay be-tween measurement objectives, dimensions of performance and contextual factors. R&D Management, 39(5), 488–519. Ch o, H.-J., & Pucik, V. (2005). Relationship between innovativeness, quality, growth, profitability, and market value.
Strate-gic Management Journal, 26(6), 555–575.
Ch oudhury, V., & Sampler, J. L. (1997). Information specificity and environmental scanning: An economic perspective. MIS