토심추정 모형의 비교
Comparison between Models for Thickness of Soils
민창식 장병욱 차경섭 서울대* ( )
Slope angle, ground water table and thickness of soils are the key factors affecting landslide stability. However examining the factors such as thickness of soils; geological structure, slope angle, and height, in order to use the global landslide susceptibility forecasting analysis is very expensive and time consuming effort. So most researchers prefer to use the simplest methods such as the C strata and the USGS methods.
In this research thickness of soils was calculated using these two methods and stability analysis was performed with the thickness of soils calculated by the two methods at the SINMAP based on ArcView 3.2.
The two safety factor maps were compared with the past landslide records. The thickness of soils calculated by USGS method showed more unstable safety factors.
서론 1. 자연사면의 산사태 예측 모델에 있어서 사면경사와 지하수위 등은 토심과 함께 산사태의 안정에 영향을 미치는 주요인자이다 그러나 광역적인 산사태 예측 모델의 경우 토심에 영향을 미치는 인. 자인 지질조건 사면경사 굴곡 표고 등의 인자를 산정하는데 상세한 조사와 많은 비용이 소요되, , , 므로 이러한 토심을 산정하는 방법에는 토양도를 이용하거나 C층까지의 깊이 그리고 USGS의 제 안식 등 간편식을 사용하는 것이 일반적이다. 본 연구에서는 C층까지의 깊이를 토심으로 산정하는 방법과 USGS의 토심추정방법을 이용해 토 심을 추정하고 ArcView 3.2의 사면해석모형인 SINMAP과 함께 산사태 발생자료와 비교하였다. 기본이론 2. 정확한 토심을 추정하기 위해서는 정밀한 조사와 비용이 소요되므로 연구자들은 토심을 추정하 기 위하여 여러 방법들을 제시하였다(Park, et al. 2001; Iida, 1999; USGS).
의 제안식 2.1 USGS
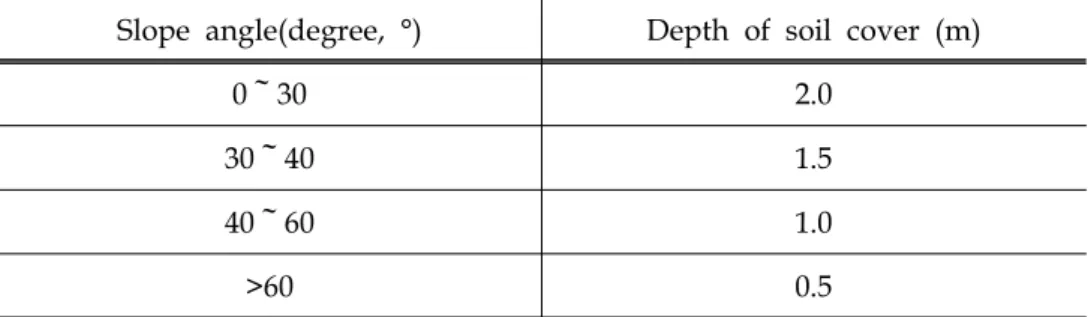
Table 1 The depth of the soil cover proposed in San Francisco beach(USGS)
에서는 사면의 경사도에 따라 과 같이 제안하였다 토심을 경사도에 대한 식으로
USGS Table 2.1 .
표현하면 식(2.1)과 같다.
Slope angle(degree, °) Depth of soil cover (m)
0 30~ 2.0
30 40~ 1.5
40 60~ 1.0
) (1) 여기서,
은 토심(m)이고,
는 사면경사(°)이다 토심의 범위는. 0 2.5m~ 이며, 70°이상에서는 토 양층이 존재하지 않는다고 가정한다 산정부근에서는 경사도가. 10°미만인 지역이 나올 수 있지만, 부능선 이상에서는 토심이 이하인 것으로 가정하였다 9 20cm (Iida, 1999). 층까지의 깊이를 이용한 토심추정 2.2 C 김영삼(2002)은 C층까지의 깊이를 토심으로 판단하고 경사위치를 이용하여, , 2/10부 능 선까지 는 토심이 101cm 이상, 3/10~9/10부 능선까지는 토심이 20~100cm 그리고 9/10 부 능선이상은 토심을 20cm이하로 추정하였다. 방법 3. 연구지역은 경기도 양주시 장흥면 석현리와 일영리이며, 경도는 126°55 30′ ″ ~ 126°58 30′ ″이 고, 위도 37°43 30′ ″ ~ 37°45 00′ ″에 해당한다.. 1:50,000 수치지도를 이용하여 DEM를 생성하여 경사각과 토심을 구하고 격자의 간격은 작을수록 지표면의 형상에 근접하기 때문에 차경섭, ( , 2004) 최대의 해상도인 5×5를 사용하여 토심을 구하였다. 사면안정해석모형은 일반적으로 사용되고 있는 ArcView 3.2의 SINMAP 모형에 각각의 방법으로 산정한 토심을 입력하고 사면안정해석결과들을 비교하고 산사태 발생 장소와 중첩하여 검증하였 다. 무한사면안정해석모형 차원 모형 3.1 (1 ) 에서는 이 간편하게 제시한 무한사면안정해석모형의 안전율을 바SINMAP Hammond et al.(1992) 탕으로 한다.
(2) 여기서, : 식생의 뿌리 점착력(), : 흙의 점착력(), : 토심(), : 지하수위(), : 습윤단위중량(), : 중력가속도(9.81), 내부마찰각: 위 모형은 토심이 사면의 경사방향에 수평하며 일정하다고 가정한다. (3) 그러므로 (2)식은 아래와 같다. 여기서, : 겉보기 점착력, = 수문모형 3.2 에서는 SINMAP 분포형 수문모형을 이용하여 강우에 의한 토층내 포화깊이를 예측하고 이를 이, 용하여 사면안정해석모형으로부터 사면안정성을 평가 한다 (Dietrich et al., 1993, 1995, 2001; 그리고 각각의 위치에서 토양내 Montgomery and Dietrich, 1994, Montgomery et al., 1998, 2001).
투과율( 로 습윤지수를 구한다) . 강우량은 폭우가 아닌 정상상태의 강우량을 묘사하기 위하여 250( 를 사용하였다 차경섭) ( , 습윤지수는 식 와 같다 2004). (5) .
(5) 여기서, : 강우강도(), : 토양내 투과율(), : 비집수면적() 사면안전율 3.3 사면안전율을 계산하기 위해서 (5)식을 (3)식에 대입하면 (6)식을 얻을 수 있으며 본 연구의 안전, 율을 평가하는 식이다.
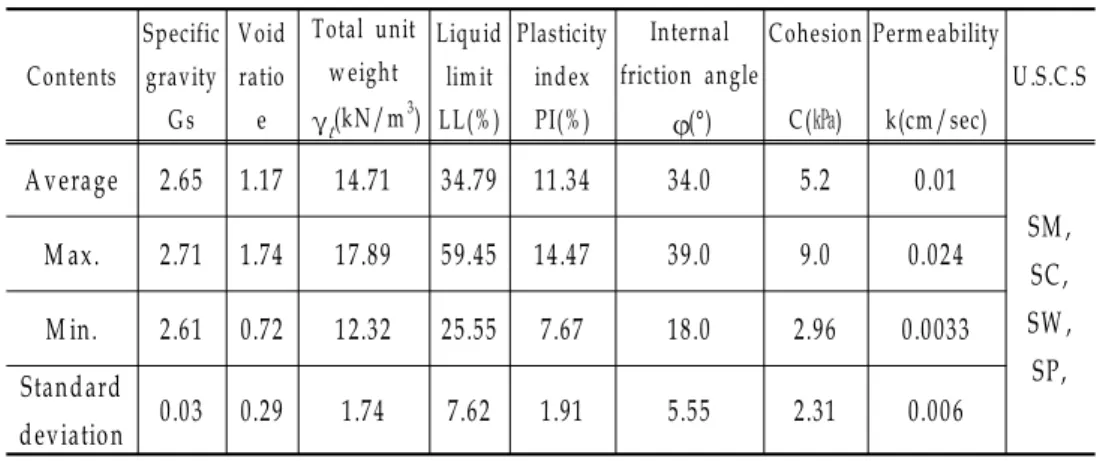
(6) 토질특성 3.4 연구지역에 대한 토질조사를 위하여 현장조사와 문헌조사를 통해 17개 지점에 대하여 물리적 특 성과 역학적 특성을 조사하였다 연구지역의 토질특성들은 표 와 같다. 2 .Table 2 Soil properties in the study area(Kigam, 2000)
C ontents Specific gravity G s V oid ratio e Total unit w eight γt(kN / m3) Liqu id lim it LL(% ) Plasticity index PI(% ) Internal friction angle φ(°) C ohesion C ( )㎪ Perm eability k(cm / sec) U .S.C .S A verage 2.65 1.17 14.71 34.79 11.34 34.0 5.2 0.01 SM , SC , SW , SP, M ax. 2.71 1.74 17.89 59.45 14.47 39.0 9.0 0.024 M in. 2.61 0.72 12.32 25.55 7.67 18.0 2.96 0.0033 Stand ard d eviation 0.03 0.29 1.74 7.62 1.91 5.55 2.31 0.006 결과 4.
토심 산사태 발생위치 (a) (b) 산사태 발생위치와 안전율 지도와의 중첩 Fig. 1 (USGS)) 토심 산사태 발생위치 (a) (b) 토심과 산사태 발생위치와 안전율 지도와의 중첩 층까지의 깊이 Fig. 2 2 (C ) 산사태 발생위치와 안전율 지도와의 중첩 Fig. 3 (sinmap) 위 지역에서 발생한 산사태는 64개소, 11075개의 셀에 해당하고 전체 유역중에서, 0.6%에 해당한 다 절토사면은 자연사면의 기하학적인 형태를 변형시킨 사면이므로 자연사면의 최소안전율의 기. 준을 절토사면에 대한 기준과 동일하게 적용할 수 있다 차경섭( , 2004). SINMAP에서는 안전 율이 1.1미만인 경우가 25%, C층의 두께로부터 산출한 토심에서는 22% 그리고 USGS 제안식에
심에 의한 안전율, SINMAP의 안전율 그리고 USGS 제안식에 의한 안전율 순서로 1.1미만의 안전 율이 증가하는 것을 보였다 산사태 발생장소와의 관계는. SINMAP이 69%가 중첩되고 C층으로부 터 계산한 토심의 경우 67% 그리고 USGS의 경우 70%가 중첩하는 것을 보였다. 결론 5. 층의 두께로부터 산출한 토심 그리고 의 제안식 순서로 미만의 안전율이 증 C , SINMAP USGS 1.1 가하는 것은 굴곡이 있는 사면의 안전율이 평탄사면에 비해 감소한다는 결과와 일치한다 차경섭( , 하지만 산사태 발생장소와의 중첩성은 모든 모형이 유사한 결과를 보이므로서 의 제 2004). USGS 안식이 정확도가 큰 것을 보였다. 참고문헌 김영삼, 2002. GIS를 이용한 산사태 취약지분석 서울대학교 석사학위논문, 차경섭, 2004. 다중셀과 지형지수를 이용한 광역 산사태 위험지 예측 서울대학교 박사학위논문,
Iida, T., 1999. A stochastic hydro-geomorphological model for shallow landsliding due to rainstorm, Catena Vol.34, 293-313
Lee, S., Chwae, U., Min, K., 2002. Landslide susceptibility mapping by correlation between topography and geological structure: the Janghung area, Korea, Geomorphology 46, 149-162
Park, S., McSweeney, K., Lowery, B., 2001. Identification of the spatial distribution of soils using a process-based terrain characterization, Geoderma 103, 249-272