저작자표시-비영리-변경금지 2.0 대한민국 이용자는 아래의 조건을 따르는 경우에 한하여 자유롭게 l 이 저작물을 복제, 배포, 전송, 전시, 공연 및 방송할 수 있습니다. 다음과 같은 조건을 따라야 합니다: l 귀하는, 이 저작물의 재이용이나 배포의 경우, 이 저작물에 적용된 이용허락조건 을 명확하게 나타내어야 합니다. l 저작권자로부터 별도의 허가를 받으면 이러한 조건들은 적용되지 않습니다. 저작권법에 따른 이용자의 권리는 위의 내용에 의하여 영향을 받지 않습니다. 이것은 이용허락규약(Legal Code)을 이해하기 쉽게 요약한 것입니다. Disclaimer 저작자표시. 귀하는 원저작자를 표시하여야 합니다. 비영리. 귀하는 이 저작물을 영리 목적으로 이용할 수 없습니다. 변경금지. 귀하는 이 저작물을 개작, 변형 또는 가공할 수 없습니다.
Progression of coronary artery
calcification and association with
traditional risk burden in
asymptomatic Korean adults: the
Korea initiatives on coronary artery
calcification (KOICA) registry
Ji Hyun Lee
Department of Medicine
Progression of coronary artery
calcification and association with
traditional risk burden in
asymptomatic Korean adults: the
Korea initiatives on coronary artery
calcification (KOICA) registry
Directed by Professor Hyuk-Jae Chang
The Master's Thesis
submitted to the Department of Medicine,
The Graduate School of Yonsei University
in partial fulfillment of the requirements
for the degree Master of Medical Science
Ji Hyun Lee
This certifies that the Master's Thesis
of Ji Hyun Lee is approved.
[Signature]
---
Thesis Supervisor: Hyuk-Jae Chang
[Signature]
---
Thesis Committee Member #1: Sungha Park
[Signature]
---
Thesis Committee Member #2: Eun Ju Chun
The Graduate School
Yonsei University
ACKNOWLEDGEMENTS
This research was supported by Leading Foreign Research
Institute Recruitment Program through the National Research
Foundation of Korea (NRF) funded by the Ministry of
Science and ICT (MSIT) (2012027176).
<TABLE OF CONTENTS>
ABSTRACT ··· 1
I. INTRODUCTION ··· 3
II. MATERIALS AND METHODS ··· 4
III. RESULTS ··· 8
IV. DISCUSSION ··· 18
V. CONCLUSION ··· 21
REFERENCES ··· 22
APPENDICES ··· 26
LIST OF FIGURES
Figure 1. Flow diagram of participants in the KOICA registry
··· 5
Figure 2. (A) Distribution of CAC progression according to risk
burden and the absence/presence of CAC. (B) Logistic
regression models (ORs with 95% CI) for the progression of
CAC according to risk burden ··· 15
Figure 3. Annualized CAC progression rate according to risk
burden at baseline and risk burden changes at follow-up
(Decreased / Same / Increased risk burden) ··· 17
LIST OF TABLES
Table 1. Baseline characteristics according to baseline versus
follow-up ··· 9
Table 2. Results of univariable and multivariable logistic
regression models for the CAC progression over time: Overall,
in CAC score = 0 and CAC score > 0 at baseline ··· 11
Table 3. Baseline characteristics, absolute change in CAC score
and annualized CAC progression rate according to risk burden
··· 13
Supplementary Table S1. Baseline characteristics according to
1
ABSTRACT
Progression of coronary artery calcification and association with
traditional risk burden in asymptomatic Korean adults: the Korea
initiatives on coronary artery calcification (KOICA) registry
Ji Hyun Lee
Department of Medicine
The Graduate School, Yonsei University
(Directed by Professor Hyuk-Jae Chang)
Introduction: Repeat coronary artery calcium (CAC) screening has been
suggested as a method to track progression of atherosclerosis, which
underlines that excessive CAC progression might be related with future
cardiovascular events. We aimed to evaluate the relationship between
CAC progression and traditional risk factor (RF) burden in a large
sample of Korean adults.
Methods: From a six center, single ethnicity observational registry, a
total of 14,255 asymptomatic Korean adults (mean age, 53±9 years;
84.0% male) underwent two examinations, including CAC screening as
part of a broader health study with an average of 3.75±1.92 years
between scans. CAC progression was defined as a difference ≥2.5
between the square root (√) of the baseline and follow-up CAC scores.
A composite score summed the individual parameters as 0, 1, 2, and ≥
3 RFs, including hypertension, diabetes, current smoking, high LDL-,
and low HDL-cholesterol.
Results: A total of 5,080 individuals (35.6%) experienced CAC
progression during follow-up (median, 6.9 years; interquartile range,
5.0–8.4 years). Most traditional cardiovascular RFs were independently
associated with CAC progression, and CAC progression was related to
2
a higher RF burden compared to those without any RF (P-value < 0.05).
The annualized CAC progression rate was 0.5%, 0.6%, 0.8%, and 0.9%
for subjects with RFs of 0, 1, 2, and ≥3, respectively. For all subsets of
risk burden at baseline, the annualized CAC progression notably
increased as the risk burden increased at follow-up, compared to
baseline (all P-value < 0.05).
Conclusion: In asymptomatic Korean adults, cardiovascular RFs were
significantly related to progression of subclinical atherosclerosis, and
increased risk burden was associated with a higher risk of CAC
progression. Furthermore, CAC progression rate was significantly
associated with risk burden changes over time.
Key words: coronary artery calcium score; progression; risk factor; risk
burden; annualized CAC progression.
3
Progression of coronary artery calcification and association with
traditional risk burden in asymptomatic Korean adults: the Korea
initiatives on coronary artery calcification (KOICA) registry
Ji Hyun Lee
Department of Medicine
The Graduate School, Yonsei University
I. INTRODUCTION:
Coronary artery calcium (CAC) is associated with coronary atherosclerosis and correlates well with atherosclerotic burden.1, 2 CAC scoring, as measured by cardiac computed tomography (CT), is an effective marker for predicting incident coronary artery disease (CAD), CAD mortality, and all-cause mortality.3-6 However, a single evaluation of atherosclerosis may not fully delineate the dynamic properties of the disease, and the ability to quantify atherosclerotic change may improve prognostic information. Thus, serial assessment of CAC has been proposed as a method to track the progression of coronary atherosclerotic burden,7 since excessive progression of CAC might be related to future cardiovascular events. Hence, cardiovascular risk should be reappraised in individuals with CAC progression, as the most recent CAC score is the most informative for future cardiovascular risk.8
Although studies have assessed the importance of CAC progression and its cardiovascular risk factors (RF), they predominantly involved Western populations.9-14 Whether the presence of individual traditional RFs displays a close relationship with CAC progression among non-Western populations remains unclear. Further still, CAC progression according to RF burden as well as the change in risk burden over time, remains to be determined beyond Western societies. In this study, using a large cohort of asymptomatic Korean adults, we aimed to determine the relationship between CAC progression and cardiovascular RFs as well as RF burden and, further risk burden changes over time.
4 II. MATERIALS AND METHODS
1. Study population
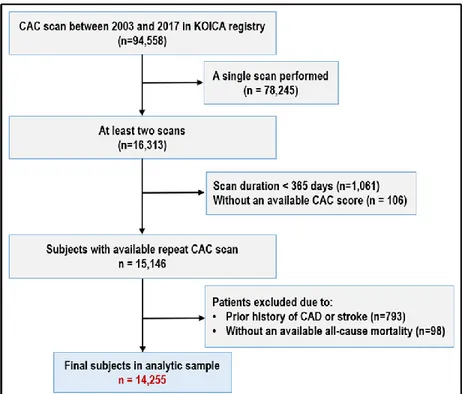
We used data of individuals enrolled in the Korea Initiatives on Coronary Artery Calcification (KOICA) multicenter registry, the design and rationale of which has been previously described.15 This is an observational, retrospective, single ethnicity, dynamic multicenter registry in a self-referral setting for subjects who underwent cardiac CT for CAC scoring as a part of a health examination at six health care centers in South Korea. A total of 94,558 individuals were enrolled in the registry from April 2003 to March 2017 (Figure 1). Self-reported medical questionnaires were used to obtain information about medical history, and all data were obtained during visits to each healthcare center. A total 15,146 individuals who underwent at least two CAC scan examinations, were included. Individuals with a prior history of ischemic heart disease or stroke (n=793) were excluded and 14,255 subjects were finally enrolled in the study.
5
Figure 1. Flow diagram of participants in the KOICA registry.
Abbreviations: CAC = Coronary artery calcium; CAD = Coronary artery disease.
2. Cardiovascular risk factor collection
A detailed interview related to sociodemographic factors and risk profiles was administered during the health examination. All data were obtained at baseline and follow-up visit using a health check database at the healthcare center of each site in South Korea. Clinical parameters included age, sex, and body mass index, and laboratory tests for lipid profiles after a minimum 8-hour fast were also obtained. Self-reported medical questionnaires were used to obtain information regarding smoking status, past medical history of hypertension (HTN), diabetes mellitus (DM), dyslipidemia, and family history of early CAD. In this study smoking was defined as current use of cigarettes. HTN and DM were defined as individuals who had a physician-diagnosed medical
6
history of each respective disease, which they self-reported via medical questionnaire. Low high density-cholesterol (HDL-C) was defined as <40 mg/dL, and high low density-cholesterol (LDL-C) was defined as ≥130 mg/dL. For the purpose of this study, the analyses were evaluated to each individual RF, as well as by RF burden, which was defined as having 0, 1, 2, or ≥ 3 of the pre-specified modifiable RFs (HTN, DM, current smoking, high LDL-C, and low HDL-C). All methods were performed in accordance with the relevant regulations and guidelines.
3. CAC score acquisition and analysis
The CAC score was subsequently calculated according to the scoring system previously described by Agatston et al.16 CAC progression was defined as a difference ≥ 2.5 between the square roots (√) of the baseline and follow-up CAC scores (Δ √transformed CAC) to minimize the effect of interscan variability.17 For subjects with more than two CT scans, the square root-transformed difference was calculated utilizing the baseline and last CT scan. All participants in the Korean cohort underwent CAC scanning using a more than 16-slice multidetector CT (MDCT) scanner. The specific CT scanner types utilized at each center included the Philips Brilliance 256 iCT (Philips Healthcare, Cleveland, OH, USA), Philips Brilliance 40 channel MDCT (Philips Healthcare), Siemens 16-slice Sensation (Siemens, Forchheim, Germany), and the GE 64-slice Lightspeed (GE Healthcare, Milwaukee, WI, USA). All centers performed standard prospective or retrospective methods with a 225 to 400 ms gantry rotation time.
4. Ethical statement
The appropriate institutional review board committees of each center approved the protocol of the current study.
7 5. Statistical methods
Based on the presence/absence of CAC progression, and pre-specified risk burden, continuous variables are reported as means ± standard deviation, the differences in continuous variables for patients according to symptom typicality were compared using a Student’s t test. Categorical variables are expressed as counts with percentages and were compared by use of Pearson’s chi-square test. Univariable and multivariable logistic regression analyses reporting the odds ratio (OR) with 95% confidence interval (95% CI) were constructed to identify not only the clinical RFs significant for CAC progression, but also the associations between CAC progression and risk burden. In an adjusted logistic regression model, the most clinically important variables were selected to show the significant RFs to predict CAC progression, 10-year increase in age, male sex, body mass index, current smoking, HTN, DM, dyslipidemia and scan duration. We adjusted 10-year increase in age, male sex and scan duration in an additional analysis indicating the association between CAC progression and risk burden. All statistical analyses were performed using STATA version 13 (StataCorp LP, College Station, TX, USA), and a two-tailed P-value <0.05 was considered statistically significant.
8 III. RESULTS
1. Baseline characteristics
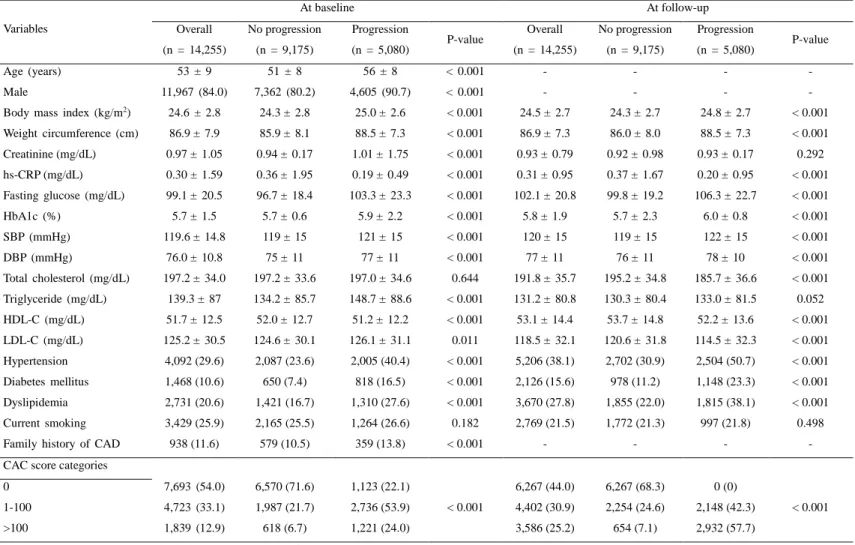
The mean age of the 14,255 participants (11,967 males, 84.0%) was 53±9 years. During the follow-up (median, 6.9 years; interquartile range, 5.0-8.4 years), 9,175 (64.4%) and 5,080 (35.6%) patients were categorized into no progression and progression groups, respectively. Table 1 demonstrates the baseline characteristics of participants with and without CAC progression according to baseline and follow-up. Individuals with CAC progression were more likely to be elderly and, male, and a significantly higher proportion of cardiovascular RFs, such as HTN, DM, and dyslipidemia, than individuals without CAC progression at both baseline and at follow-up.
9
Table 1. Baseline characteristics according to baseline versus follow-up
Variables At baseline At follow-up Overall (n = 14,255) No progression (n = 9,175) Progression (n = 5,080) P-value Overall (n = 14,255) No progression (n = 9,175) Progression (n = 5,080) P-value Age (years) 53 ± 9 51 ± 8 56 ± 8 < 0.001 - - - - Male 11,967 (84.0) 7,362 (80.2) 4,605 (90.7) < 0.001 - - - -
Body mass index (kg/m2) 24.6 ± 2.8 24.3 ± 2.8 25.0 ± 2.6 < 0.001 24.5 ± 2.7 24.3 ± 2.7 24.8 ± 2.7 < 0.001 Weight circumference (cm) 86.9 ± 7.9 85.9 ± 8.1 88.5 ± 7.3 < 0.001 86.9 ± 7.3 86.0 ± 8.0 88.5 ± 7.3 < 0.001 Creatinine (mg/dL) 0.97 ± 1.05 0.94 ± 0.17 1.01 ± 1.75 < 0.001 0.93 ± 0.79 0.92 ± 0.98 0.93 ± 0.17 0.292 hs-CRP (mg/dL) 0.30 ± 1.59 0.36 ± 1.95 0.19 ± 0.49 < 0.001 0.31 ± 0.95 0.37 ± 1.67 0.20 ± 0.95 < 0.001 Fasting glucose (mg/dL) 99.1 ± 20.5 96.7 ± 18.4 103.3 ± 23.3 < 0.001 102.1 ± 20.8 99.8 ± 19.2 106.3 ± 22.7 < 0.001 HbA1c (%) 5.7 ± 1.5 5.7 ± 0.6 5.9 ± 2.2 < 0.001 5.8 ± 1.9 5.7 ± 2.3 6.0 ± 0.8 < 0.001 SBP (mmHg) 119.6 ± 14.8 119 ± 15 121 ± 15 < 0.001 120 ± 15 119 ± 15 122 ± 15 < 0.001 DBP (mmHg) 76.0 ± 10.8 75 ± 11 77 ± 11 < 0.001 77 ± 11 76 ± 11 78 ± 10 < 0.001 Total cholesterol (mg/dL) 197.2 ± 34.0 197.2 ± 33.6 197.0 ± 34.6 0.644 191.8 ± 35.7 195.2 ± 34.8 185.7 ± 36.6 < 0.001 Triglyceride (mg/dL) 139.3 ± 87 134.2 ± 85.7 148.7 ± 88.6 < 0.001 131.2 ± 80.8 130.3 ± 80.4 133.0 ± 81.5 0.052 HDL-C (mg/dL) 51.7 ± 12.5 52.0 ± 12.7 51.2 ± 12.2 < 0.001 53.1 ± 14.4 53.7 ± 14.8 52.2 ± 13.6 < 0.001 LDL-C (mg/dL) 125.2 ± 30.5 124.6 ± 30.1 126.1 ± 31.1 0.011 118.5 ± 32.1 120.6 ± 31.8 114.5 ± 32.3 < 0.001 Hypertension 4,092 (29.6) 2,087 (23.6) 2,005 (40.4) < 0.001 5,206 (38.1) 2,702 (30.9) 2,504 (50.7) < 0.001 Diabetes mellitus 1,468 (10.6) 650 (7.4) 818 (16.5) < 0.001 2,126 (15.6) 978 (11.2) 1,148 (23.3) < 0.001 Dyslipidemia 2,731 (20.6) 1,421 (16.7) 1,310 (27.6) < 0.001 3,670 (27.8) 1,855 (22.0) 1,815 (38.1) < 0.001 Current smoking 3,429 (25.9) 2,165 (25.5) 1,264 (26.6) 0.182 2,769 (21.5) 1,772 (21.3) 997 (21.8) 0.498 Family history of CAD 938 (11.6) 579 (10.5) 359 (13.8) < 0.001 - - - - CAC score categories
0 7,693 (54.0) 6,570 (71.6) 1,123 (22.1) < 0.001 6,267 (44.0) 6,267 (68.3) 0 (0) < 0.001 1-100 4,723 (33.1) 1,987 (21.7) 2,736 (53.9) 4,402 (30.9) 2,254 (24.6) 2,148 (42.3) >100 1,839 (12.9) 618 (6.7) 1,221 (24.0) 3,586 (25.2) 654 (7.1) 2,932 (57.7) Data are given as mean ± standard deviation or number of patients (%)
Abbreviations: SBP = Systolic blood pressure; DBP = diastolic blood pressure; RF = Risk factor; CAD = Coronary artery disease; CAC = Coronary artery calcium; HDL-C = High-density lipoprotein cholesterol; LDL-C = Low-density lipoprotein cholesterol; hs-CRP = High-sensitivity C-reactive protein; HbA1c = Hemoglobin A1c
10
2. Association between clinical factors and CAC progression
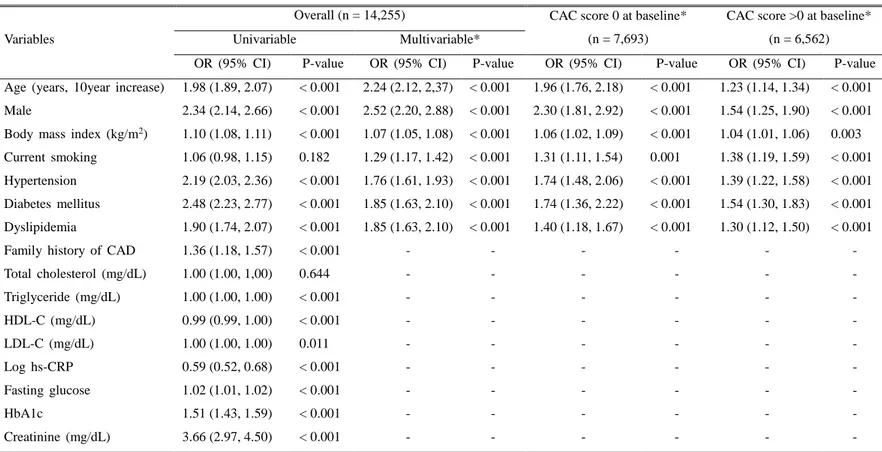
Table 2 describes the univariable and multivariable logistic regression analyses for predicting CAC progression according to individual cardiovascular RFs. Univariable analysis demonstrated that age (10 year increase) (OR 1.98; 95% CI 1.89–2.07; P < 0.001), male sex (OR 2.34; 95% CI 2.14–2.66; P < 0.001), body mass index (OR 1.10; 95% CI 1.08–1.11; P < 0.001), HTN (OR 2.19; 95% CI 2.03–2.36; P < 0.001), DM (OR 2.48; 95% CI 2.23–2.77; P < 0.001), and dyslipidemia (OR 1.90; 95% CI 1.74–2.07; P < 0.001) were significantly associated with an increased risk of CAC progression, yet current smoking was not correlated with an incremental risk of CAC progression (OR 1.06; 95% CI 0.98–1.15; P = 0.182). In multivariable analysis, most of clinically important conventional RFs, such as 10-year increase in age, male sex, higher BMI, current smoker, presence of hypertension, diabetes, and dyslipidemia had higher risk of CAC progression against those without CAC progression. In addition, all of the above RFs were shown to be independently associated with CAC progression in individuals with CAC score of 0 at baseline, as well as in those with a CAC score > 0 at baseline.
11
Table 2. Results of univariable and multivariable logistic regression models for CAC progression over time: Overall, in CAC score = 0 and CAC score > 0 at baseline
Variables
Overall (n = 14,255) CAC score 0 at baseline*
(n = 7,693)
CAC score >0 at baseline* (n = 6,562)
Univariable Multivariable*
OR (95% CI) P-value OR (95% CI) P-value OR (95% CI) P-value OR (95% CI) P-value Age (years, 10year increase) 1.98 (1.89, 2.07) < 0.001 2.24 (2.12, 2,37) < 0.001 1.96 (1.76, 2.18) < 0.001 1.23 (1.14, 1.34) < 0.001 Male 2.34 (2.14, 2.66) < 0.001 2.52 (2.20, 2.88) < 0.001 2.30 (1.81, 2.92) < 0.001 1.54 (1.25, 1.90) < 0.001 Body mass index (kg/m2) 1.10 (1.08, 1.11) < 0.001 1.07 (1.05, 1.08) < 0.001 1.06 (1.02, 1.09) < 0.001 1.04 (1.01, 1.06) 0.003
Current smoking 1.06 (0.98, 1.15) 0.182 1.29 (1.17, 1.42) < 0.001 1.31 (1.11, 1.54) 0.001 1.38 (1.19, 1.59) < 0.001 Hypertension 2.19 (2.03, 2.36) < 0.001 1.76 (1.61, 1.93) < 0.001 1.74 (1.48, 2.06) < 0.001 1.39 (1.22, 1.58) < 0.001 Diabetes mellitus 2.48 (2.23, 2.77) < 0.001 1.85 (1.63, 2.10) < 0.001 1.74 (1.36, 2.22) < 0.001 1.54 (1.30, 1.83) < 0.001 Dyslipidemia 1.90 (1.74, 2.07) < 0.001 1.85 (1.63, 2.10) < 0.001 1.40 (1.18, 1.67) < 0.001 1.30 (1.12, 1.50) < 0.001
Family history of CAD 1.36 (1.18, 1.57) < 0.001 - - - -
Total cholesterol (mg/dL) 1.00 (1.00, 1,00) 0.644 - - - - Triglyceride (mg/dL) 1.00 (1.00, 1.00) < 0.001 - - - - HDL-C (mg/dL) 0.99 (0.99, 1.00) < 0.001 - - - - LDL-C (mg/dL) 1.00 (1.00, 1.00) 0.011 - - - - Log hs-CRP 0.59 (0.52, 0.68) < 0.001 - - - - Fasting glucose 1.02 (1.01, 1.02) < 0.001 - - - - HbA1c 1.51 (1.43, 1.59) < 0.001 - - - - Creatinine (mg/dL) 3.66 (2.97, 4.50) < 0.001 - - - -
*Multivariable adjusted for age (10-year increase), male, BMI, current smoking, hypertension, diabetes, dyslipidemia, and scan duration
Abbreviations: CACS = Coronary artery calcium score; OR = Odds ratio; CI = Confidence interval; CAD = Coronary artery disease; HDL-C = High-den sity lipoprotein cholesterol; LDL-C = Low-density lipoprotein cholesterol; hs-CRP = High-sensitivity C-reactive protein; CAC = Coronary artery calciu m.; HbA1c = Hemoglobin A1c
12
3. Baseline characteristics, absolute change in CAC score and annualized CAC progression rate according to risk burden
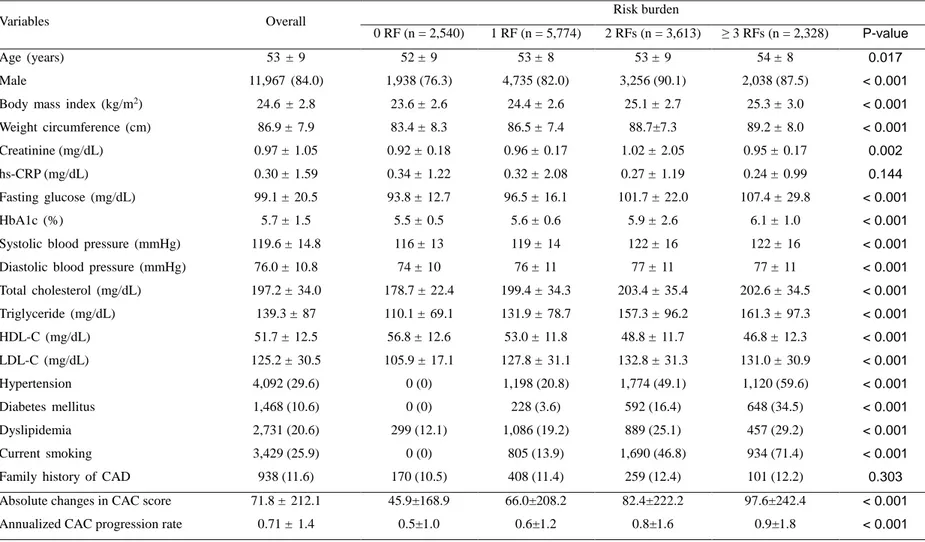
The baseline characteristics are summarized according to pre-specified risk burden (Table 3). Patients with an increased risk burden were generally older and, male, and had a higher body mass index, creatinine, fasting glucose, HbA1c, prevalence of HTN, DM, dyslipidemia, and current smoking. The absolute change in CAC score was 71.8 ± 212.1 for the total study population. In terms of the strata of risk burden, the absolute increase in the CAC score was 45.9 ± 168.9, 66.0 ± 208.2, 82.4 ± 222.2, and 97.6±242.4 for subjects with the presence of 0, 1, 2, and ≥ 3 RFs, respectively. The annualized CAC progression rate was 0.71 ± 1.4 events/year for the overall cohort population, and 0.5 ± 1.0, 0.6 ± 1.2, 0.8 ± 1.6, and 0.9 ± 1.8 for participants with the presence of 0, 1, 2, and ≥ 3 RFs, respectively.
13
Table 3. Baseline characteristics, absolute change in CAC score and annualized CAC progression rate according to risk burden
Variables Overall Risk burden
0 RF (n = 2,540) 1 RF (n = 5,774) 2 RFs (n = 3,613) ≥ 3 RFs (n = 2,328) P-value
Age (years) 53 ± 9 52 ± 9 53 ± 8 53 ± 9 54 ± 8 0.017
Male 11,967 (84.0) 1,938 (76.3) 4,735 (82.0) 3,256 (90.1) 2,038 (87.5) < 0.001
Body mass index (kg/m2) 24.6 ± 2.8 23.6 ± 2.6 24.4 ± 2.6 25.1 ± 2.7 25.3 ± 3.0 < 0.001
Weight circumference (cm) 86.9 ± 7.9 83.4 ± 8.3 86.5 ± 7.4 88.7±7.3 89.2 ± 8.0 < 0.001
Creatinine (mg/dL) 0.97 ± 1.05 0.92 ± 0.18 0.96 ± 0.17 1.02 ± 2.05 0.95 ± 0.17 0.002
hs-CRP (mg/dL) 0.30 ± 1.59 0.34 ± 1.22 0.32 ± 2.08 0.27 ± 1.19 0.24 ± 0.99 0.144
Fasting glucose (mg/dL) 99.1 ± 20.5 93.8 ± 12.7 96.5 ± 16.1 101.7 ± 22.0 107.4 ± 29.8 < 0.001
HbA1c (%) 5.7 ± 1.5 5.5 ± 0.5 5.6 ± 0.6 5.9 ± 2.6 6.1 ± 1.0 < 0.001
Systolic blood pressure (mmHg) 119.6 ± 14.8 116 ± 13 119 ± 14 122 ± 16 122 ± 16 < 0.001
Diastolic blood pressure (mmHg) 76.0 ± 10.8 74 ± 10 76 ± 11 77 ± 11 77 ± 11 < 0.001
Total cholesterol (mg/dL) 197.2 ± 34.0 178.7 ± 22.4 199.4 ± 34.3 203.4 ± 35.4 202.6 ± 34.5 < 0.001 Triglyceride (mg/dL) 139.3 ± 87 110.1 ± 69.1 131.9 ± 78.7 157.3 ± 96.2 161.3 ± 97.3 < 0.001 HDL-C (mg/dL) 51.7 ± 12.5 56.8 ± 12.6 53.0 ± 11.8 48.8 ± 11.7 46.8 ± 12.3 < 0.001 LDL-C (mg/dL) 125.2 ± 30.5 105.9 ± 17.1 127.8 ± 31.1 132.8 ± 31.3 131.0 ± 30.9 < 0.001 Hypertension 4,092 (29.6) 0 (0) 1,198 (20.8) 1,774 (49.1) 1,120 (59.6) < 0.001 Diabetes mellitus 1,468 (10.6) 0 (0) 228 (3.6) 592 (16.4) 648 (34.5) < 0.001 Dyslipidemia 2,731 (20.6) 299 (12.1) 1,086 (19.2) 889 (25.1) 457 (29.2) < 0.001 Current smoking 3,429 (25.9) 0 (0) 805 (13.9) 1,690 (46.8) 934 (71.4) < 0.001
Family history of CAD 938 (11.6) 170 (10.5) 408 (11.4) 259 (12.4) 101 (12.2) 0.303
Absolute changes in CAC score 71.8 ± 212.1 45.9±168.9 66.0±208.2 82.4±222.2 97.6±242.4 < 0.001
Annualized CAC progression rate 0.71 ± 1.4 0.5±1.0 0.6±1.2 0.8±1.6 0.9±1.8 < 0.001
Data given as mean ± standard deviation or number of patients (%)
Abbreviations: RF = Risk factor; CAD = Coronary artery disease; CAC = Coronary artery calcium; HDL-C = High-density lipoprotein cholesterol; LDL-C = Low-density lipoprotein cholesterol; hs-CRP = High-sensitivity C-reactive protein; HbA1c = Hemoglobin A1c
14
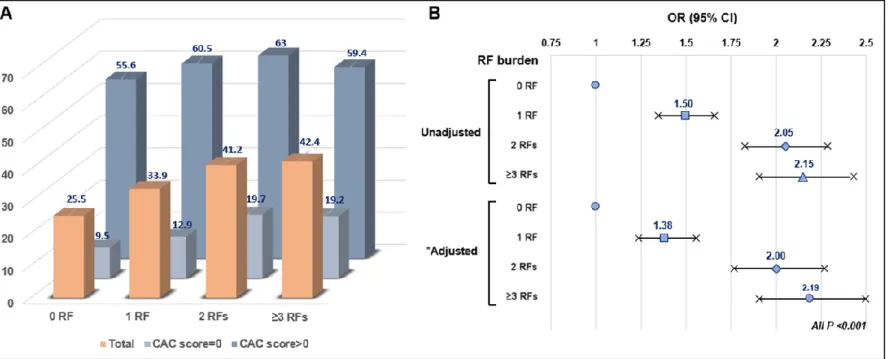
4. Distribution and logistic regression analyses with 95% CI for CAC progression according to risk burden and the absence/presence of CAC
The distribution according to risk burden as well as the absence/presence of CAC is shown in Figure 2A. The presence of 0, 1, 2, and ≥ 3 RFs for subjects with CAC progression was 25.5%, 33.9%, 41.2%, and 42.4%, respectively. Notably, the presence of 0, 1, 2, and ≥ 3 RFs for subjects with a CAC score of 0 at baseline was 9.5%, 12.9%, 19.7%, and 19.2%, respectively, whereas the presence of 0, 1, 2, and ≥ 3 RFs for subjects with a CAC score > 0 was 55.6%, 60.5%, 63%, and 59.4%, respectively. Figure 2B displays the unadjusted and adjusted logistic regression analyses for predicting CAC progression according to risk burden. In particular, an incremental risk burden was significantly associated with a higher risk of CAC progression.
15
Figure 2. (A) Distribution of CAC progression according to risk burden and the absence/presence of CAC. (B) Logistic regression models (ORs with 95% CI) for the progression of CAC according to risk burden. *Adjusted for age, sex and scan duration.
16
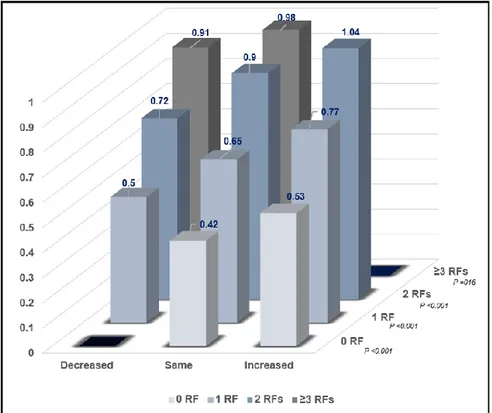
5. Annualized CAC progression rate according to change in risk burden at follow-up
The baseline characteristics and risk burden change at follow-up were observed (Supplementary Table S1). Figure 3 demonstrates the annualized CAC progression rate according to risk burden changes at follow up (decreased/same/increased), as well as the baseline risk burden. The annualized CAC progression rate increased with increased risk burden change across each RF category. Markedly, the lowest CAC progression rate was observed among those with same risk burden group and 0 RF at baseline (0.42 event/year), whereas those with increased risk burden and 2 RFs had the highest CAC progression rate (1.04 events/year). Further still, among subjects with 0 RF at baseline, the annualized CAC progression rate was relatively low (e.g., 0.42 and 0.53 for same and increased risk burden at follow-up, retrospectively), however was higher among those with ≥ 3 RFs (e.g., 0.91 and 0.98 for decreased and same risk burden at follow-up, retrospectively).
17
Figure 3. Annualized CAC progression rate according to risk burden at baseline and risk burden changes at follow-up (Decreased / Same / Increased risk burden).
18 IV. DISCUSSION
Using data from the KOICA registry, we sought to assess the relationship between CAC progression and traditional risk burden in a large cohort of asymptomatic Korean adults. Our findings demonstrated that well-established cardiovascular RFs were significantly associated with the progression of CAC, these included older age, male sex, higher body mass index, fasting glucose, HbA1c, creatinine, and the presence of clinical RFs, such as HTN, DM, dyslipidemia, and family history of CAD. Similar findings were demonstrated regardless of the absence or presence of baseline CAC. An increased risk burden was associated with a higher risk of subclinical incremental atherosclerotic burden as measured by CAC scanning. The CAC progression rate increased with the incremental risk burden change at follow-up across all subsets of RF burden at baseline.
The baseline CAC score determined by cardiac computed tomography (CT), is a well-identified diagnostic imaging tool for the detection of subclinical CAD that may improve the prediction of future cardiovascular events.1-6 However, since atherosclerosis is a dynamic process, as shown by studies indicating both plaque progression and regression,18 serial assessment of CAC scores has been proposed as a method to monitor atherosclerosis progression and to evaluate the effectiveness of medical treatment to minimize adverse cardiovascular risk.7 In a study cohort of 4,609 asymptomatic adults undergoing serial CAC scans, the investigators revealed that CAC progression added significant incremental benefit for predicting all-cause mortality over baseline CAC score, scan duration, baseline demographics, and cardiovascular RFs.19 In another analysis from the MESA (Multi-Ethnic Study of Atherosclerosis) study with 6,778 subjects followed for 7.6 years, Budoff et al. showed that CAC progression is associated with incident hard and total CAD events and graded associations between CAC progression and CAD event risk; these findings may indicate that the functions are linear, with greater progression related to greater risk.20 Although our study corroborates and expands on the findings of several previous investigations, a recent study by Radford et al.8 reported that the association of CAC progression with adverse cardiovascular outcome is no
19
longer significant as including follow-up CAC. Despite this, sequential CAC evaluation is considered clinically important, and the most recent CAC scan is still more informative on future adverse cardiovascular events. Notably, the most recent ACC/AHA Cholesterol Guidelines allowed for use of the CAC score in selected adults if a risk-based treatment decision related to the initiation of statin therapy remains uncertain.21
Several investigations of CAC progression have reported diverse methods to estimate progression.9, 17, 22 Min et al.22 defined CAC progression as the development of any CAC (CAC score >0). In the cohort from the MESA study, Kronmal et al.9 utilized the MESA method, which used the natural logarithm plus 25 difference [ln CAC(follow-up) + 25]-(ln CAC(baseline) + 25)]. Hokanson and colleagues used the square root method where CAC progression was defined as a difference ≥ 2.5 between the square roots (√) of the baseline and follow-up CAC scores with the purpose of reducing the impact of interscan variability.17 Budoff el al.19 compared previously reported techniques to identify the best model to predict adverse outcomes with CAC progression. Although all methods for appraising CAC progression were significantly associated with all-cause mortality, with the exception of in adults with a CAC score of 0, the square root-transformed model revealed the best fit of the data, regardless of baseline CAC score (CAC score = 0, > 0, and > 30. The latter study showed that CAC progression was associated with > 3-fold increase in outcome regardless of the cut points of the baseline CAC score. In light of this, our study defined the progression of CAC as a square root-transformed difference > 2.5 in the same manner.
Several studies have documented the associations between clinical RFs and the progression of CAC. In a study of 299 asymptomatic adults, Budoff et al.19 indicated that statin therapy resulted in a 61% decrease in the CAC progression rate. Yoon and colleagues demonstrated that CAC progression was significantly related to HTN and DM in a study comprising 217 consecutive asymptomatic individuals.14 Albeit, these investigations were based on small sample sizes, retrospective observational designs, and/or restrictive populations.
20
Kronmal et al.9 provided the first large multiethnic study showing the incidence and progression of CAC, from the MESA (Multi-Ethnic Study of Atherosclerosis) study. In the latter study, the investigators discovered that most conventional RFs, including age, male sex, HTN, body mass index, DM, glucose, and family history of heart attack, were linked to both the risk of incidental and progressed CAC. Nonetheless, given the ethnic differences in coronary atherosclerosis and calcification, it is important to understand the nature of CAC progression beyond the Western population. To date, the relationship of CAC progression with cardiovascular RFs has not been investigated in an Asian population. In a study comprising 6,268 asymptomatic adults with an initial CAC score of 0 from the KOICA registry, Lee et al.23 reported that diverse RFs, including age, male sex, waist circumference, diabetes, and LDL-C, were significantly related with CAC progression. Further, they exposed CAC progression risk by the 10-year atherosclerotic cardiovascular disease (ASCVD) based on the pooled cohort equation.24 These findings are in keeping with our results, and we further expanded the findings regardless of the absence/presence of baseline CAC. The CAC progression rate was gradually increased with higher 10-year ASCVD risk (0.3%, 1.9%, 4.3%, 8.6%, and 16.7% for < 5%, ≥ 5 but < 7.5%, and ≥ 7.5%, respectively). Yet, as age is a primary determinant in traditional risk prediction algorithms, some individuals (i.e., younger adults) might be stratified as low estimated 10-year risk despite a significant burden of RFs.24 Thus, we sought to clarify the risk of CAC progression according to prespecified modifiable RFs, as well as risk burden. Our findings corroborate and expand the results of the latter study, in that we have demonstrated that the CAC progression rate increased steadily with higher risk burden.
To our knowledge, this study is the first to report that the change in risk burden at follow-up can influence the CAC progression rate across all ranges of baseline risk burdens beyond Western populations. Our study provides strong confirmatory evidence that the annualized CAC progression increased with higher risk burden across each baseline RF category. Although individuals have same RFs at baseline, those with decreased risk burden at follow-up had a lower
21
CAC progression rate. In this regard, our results further advocate the importance of modulating RFs in clinical practice, which include stopping smoking, intensive control of blood pressure, and taking a lipid-lowering medication in order to achieve a satisfactory lipid profile on the background of the recent guidelines.21
This study has some limitations that bear mentioning. It was observational and retrospective in nature; thus, it was difficult to determine a causal relationship. Hence, the possibility of residual confounding cannot be discounted due to unmeasured parameters. Moreover, we could not eliminate the possible effects of medications for hypertension, diabetes mellitus, and hyperlipidemia on CAC progression. In previous observational investigations, statin treatment in particular might have introduced confounding if related to better generalized cardiovascular care. Therefore, although we adjusted dyslipidemia for logistic regression models, further large prospective studies are needed to address these issues. The KOICA registry was on the background of self-referred participants who underwent routine health check-up programs including cardiac CT, which may not be fully representative of the overall Korean population. Therefore, this study may have inferred a potential selection bias. Further, the study sample had a male predominance; therefore, caution should be taken in extrapolating our results to females. Finally, repeated cardiac CT scans were not implemented according to a specific study protocol, and the duration of interscan among study participants varied. Nevertheless, we calculated the annualized CAC progression rate to lessen the effect of variations in the interscan duration.
V. CONCLUSION
In asymptomatic Korean adults, conventional cardiovascular RFs were significantly related to the progression of subclinical atherosclerosis as measured by CAC scanning. The increased risk burden demonstrated a strong association with a higher risk of CAC progression. Furthermore, the CAC progression rate was significantly associated with risk burden changes at follow-up.
22 REFERENCES
1. Budoff MJ, Achenbach S, Blumenthal RS, Carr JJ, Goldin JG, Greenland P, et al. Assessment of coronary artery disease by cardiac computed tomography: a scientific statement from the American Heart Association Committee on Cardiovascular Imaging and Intervention, Council on Cardiovascular Radiology and Intervention, and Committee on Cardiac Imaging, Council on Clinical Cardiology. Circulation. 2006 Oct 17;114(16):1761-91. 2. Yeboah J, McClelland RL, Polonsky TS, Burke GL, Sibley CT, O'Leary D, et al. Comparison of novel risk markers for improvement in cardiovascular risk assessment in intermediate-risk individuals. Jama. 2012 Aug 22;308(8):788-95.
3. Budoff MJ, Shaw LJ, Liu ST, Weinstein SR, Mosler TP, Tseng PH, et al. Long-term prognosis associated with coronary calcification: observations from a registry of 25,253 patients. Journal of the American College of Cardiology. 2007 May 8;49(18):1860-70.
4. Detrano R, Guerci AD, Carr JJ, Bild DE, Burke G, Folsom AR, et al. Coronary calcium as a predictor of coronary events in four racial or ethnic groups. The New England journal of medicine. 2008 Mar 27;358(13):1336-45. 5. LaMonte MJ, FitzGerald SJ, Church TS, Barlow CE, Radford NB, Levine BD, et al. Coronary artery calcium score and coronary heart disease events in a large cohort of asymptomatic men and women. American journal of epidemiology. 2005 Sep 1;162(5):421-9.
6. Rumberger JA, Simons DB, Fitzpatrick LA, Sheedy PF, Schwartz RS. Coronary artery calcium area by electron-beam computed tomography and coronary atherosclerotic plaque area. A histopathologic correlative study. Circulation. 1995 Oct 15;92(8):2157-62.
7. McEvoy JW, Blaha MJ, Defilippis AP, Budoff MJ, Nasir K, Blumenthal RS, et al. Coronary artery calcium progression: an important clinical measurement? A review of published reports. Journal of the American
23
College of Cardiology. 2010 Nov 9;56(20):1613-22.
8. Radford NB, DeFina LF, Barlow CE, Lakoski SG, Leonard D, Paixao AR, et al. Progression of CAC Score and Risk of Incident CVD. JACC Cardiovascular imaging. 2016 Dec;9(12):1420-9.
9. Kronmal RA, McClelland RL, Detrano R, Shea S, Lima JA, Cushman M, et al. Risk factors for the progression of coronary artery calcification in asymptomatic subjects: results from the Multi-Ethnic Study of Atherosclerosis (MESA). Circulation. 2007 May 29;115(21):2722-30.
10. Chironi G, Simon A, Denarie N, Vedie B, Sene V, Megnien JL, et al. Determinants of progression of coronary artery calcifications in asymptomatic men at high cardiovascular risk. Angiology. 2002 Nov-Dec;53(6):677-83. 11. Shemesh J, Apter S, Stolero D, Itzchak Y, Motro M. Annual progression of coronary artery calcium by spiral computed tomography in hypertensive patients without myocardial ischemia but with prominent atherosclerotic risk factors, in patients with previous angina pectoris or healed acute myocardial infarction, and in patients with coronary events during follow-up. The American journal of cardiology. 2001 Jun 15;87(12):1395-7. 12. Cassidy AE, Bielak LF, Zhou Y, Sheedy PF, 2nd, Turner ST, Breen JF, et al. Progression of subclinical coronary atherosclerosis: does obesity make a difference? Circulation. 2005 Apr 19;111(15):1877-82.
13. Budoff MJ, Lane KL, Bakhsheshi H, Mao S, Grassmann BO, Friedman BC, et al. Rates of progression of coronary calcium by electron beam tomography. The American journal of cardiology. 2000 Jul 1;86(1):8-11.
14. Yoon HC, Emerick AM, Hill JA, Gjertson DW, Goldin JG. Calcium begets calcium: progression of coronary artery calcification in asymptomatic subjects. Radiology. 2002 Jul;224(1):236-41.
15. Lee JH, B OH, Han D, Park HE, Choi SY, Sung J, et al. Reassessing the Usefulness of Coronary Artery Calcium Score among Varying Racial and Ethnic Groups by Geographic Locations: Relevance of the Korea Initiatives on
24
Coronary Artery Calcification Registry. J Cardiovasc Ultrasound. 2015 Dec;23(4):195-203.
16. Agatston AS, Janowitz WR, Hildner FJ, Zusmer NR, Viamonte M, Jr., Detrano R. Quantification of coronary artery calcium using ultrafast computed tomography. Journal of the American College of Cardiology. 1990 Mar 15;15(4):827-32.
17. Hokanson JE, MacKenzie T, Kinney G, Snell-Bergeon JK, Dabelea D, Ehrlich J, et al. Evaluating changes in coronary artery calcium: an analytic method that accounts for interscan variability. AJR American journal of roentgenology. 2004 May;182(5):1327-32.
18. Nissen SE, Nicholls SJ, Sipahi I, Libby P, Raichlen JS, Ballantyne CM, et al. Effect of very high-intensity statin therapy on regression of coronary atherosclerosis: the ASTEROID trial. Jama. 2006 Apr 5;295(13):1556-65. 19. Budoff MJ, Hokanson JE, Nasir K, Shaw LJ, Kinney GL, Chow D, et al. Progression of coronary artery calcium predicts all-cause mortality. JACC Cardiovascular imaging. 2010 Dec;3(12):1229-36.
20. Budoff MJ, Young R, Lopez VA, Kronmal RA, Nasir K, Blumenthal RS, et al. Progression of coronary calcium and incident coronary heart disease events: MESA (Multi-Ethnic Study of Atherosclerosis). Journal of the American College of Cardiology. 2013 Mar 26;61(12):1231-9.
21. Grundy SM, Stone NJ, Bailey AL, Beam C, Birtcher KK, Blumenthal RS, et al. 2018
AHA/ACC/AACVPR/AAPA/ABC/ACPM/ADA/AGS/APhA/ASPC/NLA/PCN A Guideline on the Management of Blood Cholesterol: A Report of the American College of Cardiology/American Heart Association Task Force on Clinical Practice Guidelines. Circulation. 2019 Jun 18;139(25):e1082-e143. 22. Min JK, Lin FY, Gidseg DS, Weinsaft JW, Berman DS, Shaw LJ, et al. Determinants of coronary calcium conversion among patients with a normal coronary calcium scan: what is the "warranty period" for remaining normal?
25
Journal of the American College of Cardiology. 2010 Mar 16;55(11):1110-7. 23. Lee W, Yoon YE, Kwon O, Lee H, Park HE, Chun EJ, et al. Evaluation of Coronary Artery Calcium Progression in Asymptomatic Individuals with an Initial Score of Zero. Korean circulation journal. 2019 May;49(5):448-57. 24. Goff DC, Jr., Lloyd-Jones DM, Bennett G, Coady S, D'Agostino RB, Gibbons R, et al. 2013 ACC/AHA guideline on the assessment of cardiovascular risk: a report of the American College of Cardiology/American Heart Association Task Force on Practice Guidelines. Circulation. 2014 Jun 24;129(25 Suppl 2):S49-73.
26 APPENDICES
Supplementary Table S1. Baseline characteristics according to risk burden changes at follow-up
Variables Overall
Risk burden change at follow-up Decreased burden (n=3,688) Same burden (n=7,945) Increased burden (n=2,622) P-value Age (years) 53±9 53±9 53±9 53±8 0.329 Male 11,967 (84.0) 3,134 (85.0) 6,619 (83.3) 2,214 (84.4) 0.06
Body mass index (kg/m2) 24.6±2.8 24.8±2.7 24.4±2.8 24.6±2.7 <0.001
Weight circumference (cm) 86.9±7.9 88.2±7.5 86.4±8.1 86.7±7.9 <0.001
Creatinine (mg/dL) 0.97±1.05 1.0±0.2 1.0±1.4 0.9±0.2 0.255
hs-CRP (mg/dL) 0.30±1.59 0.3±1.9 0.3±1.5 0.4±1.2 0.189
Fasting glucose (mg/dL) 99.1±20.5 99.5±21.1 98.8±20.6 99.4±19.5 0.146
HbA1c (%) 5.7±1.5 5.8±0.7 5.7±1.9 5.7±0.7 0.224
Systolic blood pressure (mmHg) 119.6±14.8 120±15 119±15 121±14 <0.001
Diastolic blood pressure (mmHg) 76.0±10.8 76±11 76±11 77±11 <0.001
Total cholesterol (mg/dL) 197.2±34.0 201.7±34.8 196.7±34.7 192.1±29.4 <0.001 Triglyceride (mg/dL) 139.3±87 152.1±97.4 133.8±81.1 138.4±87.2 <0.001 HDL-C (mg/dL) 51.7±12.5 46.8±12.7 53.2±12.2 53.1±11.6 <0.001 LDL-C (mg/dL) 125.2±30.5 134.7±30.2 123.4±31.2 119.1±26.0 <0.001 Hypertension 4,092 (29.6) 1,469 (39.9) 2,177 (29.0) 446 (17.0) <0.001 Diabetes Mellitus 1,468 (10.6) 517 (14.0) 812 (10.8) 139 (5.3) <0.001 Dyslipidemia 2,731 (20.6) 796 (21.9) 1,429 (20.3) 506 (19.8) 0.078 Current smoking 3,429 (25.9) 982 (26.6) 1,832 (26.5) 615 (23.5) 0.006
Family history of CAD 938 (11.6) 287 (11.9) 490 (12.0) 161 (10.0) 0.095
Data given as mean ± standard deviation or number of patients (%)
Abbreviations: RF = risk factor; CAD = coronary artery disease; HDL-C = high-density lipoprotein cholesterol; LDL-C = low-density lipoprotei n cholesterol; hs-CRP = high-sensitivity C-reactive protein; HbA1c = hemoglobin A1c
27
ABSTRACT (IN KOREAN)
무증상 한국인 성인에서 관상동맥 석회화의 진행과 심혈관계
위험인자 부담과의 연관성: KOICA 연구
<지도교수 장 혁 재>
연세대학교 대학원 의학과
이 지 현
서론: 반복적인 관상동맥 석회화의 선별 검사는 죽상 동맥
경화증의 진행을 추적하는 방법으로 제안되었으며, 이는 과도한
관상동맥칼슘의 진행이 향후 발생할 수 있는 심혈관 사건과
관련성을 의미한다. 본 연구는 대규모의 한국 성인에 있어서
관상동맥 석회화의 진행과 심혈관계 위험 요인의 부담 사이의
관계를 평가하기 위함이다.
방법: 한국내 6개의 병원에서 구성된 레지스트리로부터 총
14,255 명의 무증상 한국 성인 (평균 연령: 53 ± 9 세, 84.0 %의
남성)은 광범위한 건강 연구의 일환으로 관상동맥 석회화
검사를 포함한 2회 이상의 건강검진을 시행하였고, 두 검사간
간격은 평균 3.75 ± 1.92년이었다. 관상동맥 석회화 진행은
첫번째와 두번째 시행한 관상동맥 석회화 점수의 제곱근 차이
값이 2.5 이상인 경우로 정의되었다. 위험인자 복합 점수
(위험인자 부담)는 고혈압, 당뇨병, 현재 흡연, 높은 LDL- 및
낮은 HDL- 콜레스테롤을 포함하여 개별 매개 변수를 0, 1, 2 및
≥3의 위험인자로 구성되었다.
결과: 5,080 명의 성인(35.6 %)이 추적 기간 동안 (중앙값, 6.9세,
사분위수 범위, 5.0-8.4 세) 관상동맥 석회화가 진행되었다.
이들은 관상동맥 석회화가 진행되지 않은 사람과 비교 시 고령,
남성의 비율이 높았고, 기존에 잘 알려진 심혈관계 위험인자를
28