INTRODUCTION
Chronic kidney disease (CKD) is a worldwide problem, and its prevalence is increasing dramatically. According to data from the National Health and Nutrition Examination Surveys (NHANES), the prevalence of CKD in the United States was 13.1% between 1999 and 2004, which indicated an increase compared to the 10.0% prevalence noted dur-ing the 1994-1998 period (1). In the AusDiab kidney study, approximately 16% of Australian adults had markers of CKD, including proteinuria, hematuria, or reduced glomerular filtra-tion rate (GFR) (2). The prevalence of CKD in Asia is not lower than that seen in Western countries. The prevalence of GFR less than 60 mL/min/1.73 m2in the adult Japanese population is 19.1% (3). A recent study found the prevalence
of CKD in Beijing to be 13.0% (4).
CKD is a well known predictor of hospitalization (5), car-diovascular events (5-8), carcar-diovascular mortality (5), non-cardiac mortality (9), and all-cause mortality (5-7). Decreased renal function is also a risk factor for cognitive dysfunction (10) and poor quality of life (11). Some CKD-related metabol-ic complmetabol-ications, such as anemia and hyperparathyroidism, are observed early in stage 3 CKD (12). Despite the signifi-cant health problems associated with CKD, an English study showed that only 15.2% of patients with CKD were known to renal services and only 8.1% of patients were referred to a nephrologist during a mean follow-up period of 31.3 months (13). Late referral to a nephrologist was an important risk factor for patient mortality (13). The cost of health services for patients with CKD is 1.8 times the cost for patients
with-S11
Suhnggwon Kim*, Chun Soo Lim*,�
, Dong Cheol Han�
, Gyo Sun Kim�
, Ho Jun Chin*,‖, Seung-Jung Kim¶,
Won Yong Cho**, Yeong Hoon Kim��
, and Yon-Su Kim*
Department of Internal Medicine and Renal Institute*, Seoul National University College of Medicine, Seoul; Department of Internal Medicine�
, Seoul National University Boramae Hospital, Seoul; Department of Internal Medicine�
, SoonChunHyang University College of Medicine, Seoul; Department of Pediatrics�
, Konkuk University School of Medicine, Seoul; Department of Internal Medicine‖, Seoul National University Bundang
Hospital, Seongnam; Department of Internal Medicine¶,
Ewha Womans University College of Medicine, Seoul; Department of Internal Medicine**, Korea University College of Medicine, Seoul; Department of Internal Medicine��
, Inje University College of Medicine, Seoul, Korea
The list of investigators was marked in the appendix.
Address for correspondence Suhnggwon Kim, M.D.
Department of Internal Medicine, Seoul National University College of Medicine, 28 Yeongeon-dong, Jongno-gu, Seoul 110-744, Korea
Tel : +82.31-787-7025, Fax : +82.31-787-4052 E-mail : [email protected]
*This study was supported by the Research Grant of Korean Society of Nephrology.
DOI: 10.3346/jkms.2009.24.S1.S11
The Prevalence of Chronic Kidney Disease (CKD) and the Associated
Factors to CKD in Urban Korea: A Population-based Cross-sectional
Epidemiologic Study
Chronic kidney disease (CKD) is a worldwide problem. This study was designed to survey the prevalence and risk factors for CKD in Korea. The 2,356 subjects were selected in proportion to age, gender, and city. Subjects 35 yr of age or older were selected from 7 cities. Estimated glomerular filtration rate (eGFR) was calculated using the Modification of Diet in Renal Disease (MDRD) Study equation, with albu-minuria defined as a urine albumin to creatinine ratio of 30 mg/g or more. The overall prevalence of CKD was 13.7%. The prevalences of CKD according to stage were 2.0% stage 1, 6.7% stage 2, 4.8% stage 3, 0.2% stage 4, and 0.0% stage 5. The prevalences of microalbuminuria and macroalbuminuria were 8.6% and 1.6%, respectively. The prevalence of eGFR less than 60 mL/min/1.73 m2was 5.0%. Age,
body mass index (BMI), hypertension, diabetes mellitus, systolic blood pressure (SBP), diastolic blood pressure (DBP), and fasting blood glucose were independent factors related to the presence of CKD. In conclusions, Korea, in which the preva-lence of CKD is increasing, should prepare a policy for early detection and appro-priate treatment of CKD. The present data will be helpful in taking those actions.
Key Words : Korea; Kidney Failure, Chronic; Epidemiologic Studies
Received : 24 December 2008 Accepted : 12 January 2009
out CKD. By 2010, more than 28 billion US dollars will be paid for health services in patients with end stage renal dis-ease (ESRD) in the United States (14).
In Korea, the prevalence and incidence of ESRD have been increasing since 1986, as well (15). In 2005, the incidence of ESRD in Korea reached 173 per million population (PMP), and the prevalence reached 900 PMP (16). An international comparison of ESRD epidemiology showed Korea to rank 9th in ESRD prevalence (16). The health costs for kidney disease (defined by ICD-10 codes N18.x and N19.x) made up 3.24% of the national expenditure for health services in Korea in 2004.
Although the data for patients with ESRD has been entered into the ESRD registry in the Korean Society of Nephrolo-gy since 1986, there have been no studies detailing the nation-wide prevalence of CKD in Korea. Thus, this cross-sectional epidemiologic study was designed to survey the prevalence and risk factors for CKD in the 7 major cities of Korea.
MATERIALS AND METHODS Study population
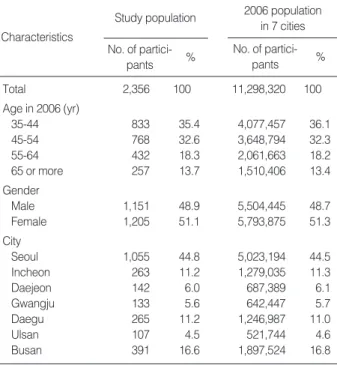
This was a cross-sectional epidemiologic study. The sam-ple population was made up of individuals 35 yr or older, selected in proportion to age, gender, and city in Korea. We decided to include 2,400 persons in the study. Seven cities were included (Seoul, Incheon, Daejeon, Gwangju, Daegu, Ulsan, Busan); 48.03% of Koreans age 35 yr or older live in these cities according to the 2006 Korean Population Census. Seoul and Incheon are located in the middle of the Korean peninsula; Daejeon and Gwangju are in the southwest; and Ulsan, Daegu, and Busan are in the southeast. A website was created, and an advertisement was placed in various news-papers for volunteers to participate in this survey. The num-ber of participants was decided according to age, gender, and sub-district of city (Gu). Only one person per household could participate in this survey. The website for volunteers was closed after the planned number of participants was recruit-ed. There were 2,413 volunteers registered to the website. Among these, 2,364 persons completed the questionnaires and laboratory tests. We analyzed the data of 2,356 partici-pants and excluded 8 persons less than 35 yr of actual age.
Measurements and definitions
The subjects came to the specified hospital(s) in each city after overnight fasting for at least 12 hr, completed the ques-tionnaires, and completed blood and urine tests. Baseline demographics such as age, gender, weight (kg), height (cm), area of residence, systolic blood pressure (SBP), and diastolic blood pressure (DBP) and laboratory tests such as serum blood urea nitrogen (BUN), serum creatinine (Cr), fasting serum
glucose, total cholesterol, low density lipoprotein (LDL) choles-terol, and single voided fasting urine albumin to creatinine ratio (mg albumin/g creatinine: UACR) were examined. Arterial blood pressure was measured using a mercury sphyg-momanometer after participants sat for at least 15 min in each specified hospital. Participants reported their respective comorbidities, such as hypertension, diabetes mellitus, coro-nary artery disease, cerebrovascular events, and renal disease; current smoking habits; family history of hypertension, dia-betes mellitus, coronary artery disease, renal disease, cere-brovascular events, or cancer; and medications for hyperten-sion and diabetes mellitus. The serum creatinine was mea-sured by an automatic analyzer using the Jaffe method in all participating hospitals. Estimated GFR (eGFR) was calcu-lated using the Modification of Diet in Renal Disease (MD-RD) Study equation (17).
Albuminuria was defined as a UACR of 30 mg/g or more. Microalbuminuria was defined as a UACR ranging from 30 to 299 mg/g, and macroalbuminuria was defined as a UACR of 300 mg/g or more. Referencing the National Kidney Foun-dation Kidney Disease Outcomes Quality Initiative (KDOQI) working group, CKD was defined as the presence of albu-minuria or eGFR <60 mL/min/1.73 m2. Stages of CKD were defined as follows: stage 1 (eGFR ≥ 90 mL/min/1.73 m2and UACR ≥30 mg/g); stage 2 (eGFR 60-89 mL/min/ 1.73 m2and UACR ≥30 mg/g); stage 3 (eGFR 30-59 mL/ min/1.73 m2regardless of UACR); stage 4 (eGFR 15-29 mL/ min/1.73 m2regardless of UACR); and stage 5 (eGFR <15 mL/min/1.73 m2regardless of UACR).
Hypertension was defined as SBP of 140 mmHg or greater, DBP of 90 mmHg or greater, or use of antihypertensive med-ications irrespective of BP. Diabetes mellitus was defined as a fasting glucose of 126 mg/dL or greater or use of hypogly-cemic agents. A history of cardiovascular events was defined as a history of coronary arterial disease or cerebrovascular acci-dent. Body mass index (BMI) was calculated based on weight and height (weight [kg]/height [m2]). BMI groups were classi-fied as less than the 10th percentile (BMI <20.7 kg/m2), 10th to 50th percentile (BMI 20.7 to 24 kg/m2), 50th to 90th per-centile (BMI 24.1 to 28.0 kg/m2), and greater than the 90th percentile (BMI >28.0 kg/m2), as proposed in another study (18).
Statistical analyses
All analyses and calculations were performed using SPSS software (SPSS version 12.0, Chicago, IL, U.S.A.). Data are presented as the means±SDs for continuous variables and as proportions for categorical variables. Demographic and clinical data were described and compared between groups. Differences were analyzed using the chi-square test for cate-gorical variables and the Student t test or one-way ANOVA for continuous variables according to the number of groups. The odds ratio (OR) between the factors and CKD was cal-culated using logistic regression analysis with or without
adjustment for age, gender, BMI, hypertension, and diabetes mellitus, which are well known risk factors for CKD. p val-ues less than 0.05 were considered statistically significant.
RESULTS Characteristics of participants
The proportions of age and gender in the study group were
no different compared to those in the general populations in each city (Table 1). Of the 2,356 participants, 1,151 (48.8%) were male and 1,205 (51.2%) were female. The mean par-ticipant age was 50.5±11.1 yr. The prevalences of hyper-tension and diabetes mellitus were 35.5% and 10.1%, respec-tively. The serum creatinine was 0.83±0.11 mg/dL in women and 1.09±0.45 mg/dL in men; it slightly increased with age in women (p<0.05), but it did not differ among the var-ious age groups in men (p>0.05) (Fig. 1). The eGFR level was 79.4±12.6 mL/min/1.73 m2in women and 79.3±12.7 mL/min/1.73 m2in men. The mean eGFRs in age groups, 35-44 yr, 45-54 yr, 55-64 yr, and 65 yr or more were 85.3, 80.0, 74.6, and 70.5 mL/min/1.73 m2in females, respectively, and 83.0, 79.3, 77.0, and 71.9 mL/min/1.73 m2, in males, respectively. The mean eGFR level decreased with age at a rate of 4.24 mL/min/1.73 m2/10 yr in females and at a rate of 4.08 mL/min/1.73 m2/10 yr in males (Fig. 1). The UACR level was 24.2±115.7 mg/g (median: 5.2 mg/g) in women and
Study population No. of partici- pants % Characteristics 2006 population in 7 cities No. of partici- pants % Total 2,356 100 11,298,320 100 Age in 2006 (yr) 35-44 833 35.4 4,077,457 36.1 45-54 768 32.6 3,648,794 32.3 55-64 432 18.3 2,061,663 18.2 65 or more 257 13.7 1,510,406 13.4 Gender Male 1,151 48.9 5,504,445 48.7 Female 1,205 51.1 5,793,875 51.3 City Seoul 1,055 44.8 5,023,194 44.5 Incheon 263 11.2 1,279,035 11.3 Daejeon 142 6.0 687,389 6.1 Gwangju 133 5.6 642,447 5.7 Daegu 265 11.2 1,246,987 11.0 Ulsan 107 4.5 521,744 4.6 Busan 391 16.6 1,897,524 16.8
Table 1. Comparisons of demographic characteristics of the study population and the 2006 population in 7 Korean cities
Fig. 1. The serum creatinine and eGFR with age in each gender.
Serum creatinine (mg/dL) 1.4 1.2 1.0 0.8 0.6 0.4 0.2 0.0 35-44 45-54 55-64 ≥65 Age (yr) 0.81 1.07 95% CI mean Female 0.82 1.11 0.84 1.07 0.87 1.12 eGFR (mL/min/1.73 m 2) 100 80 60 40 20 0 35-44 45-54 55-64 ≥65 Age (yr) 85.2 83.0 80.0 79.3 74.6 77.0 70.5 71.9 95% CI mean Male Albuminuria within each level of eGFR (%)
None Micro Macro
CKD Stage No. % Kidney function eGFR No. % ≥90 435 18.5 89.0 9.2 1.8 1 48 2.0 60-89 1,804 76.6 91.2 7.8 0.9 2 158 6.7 30-59 112 4.8 73.2 19.6 7.1 3 112 4.8 15-29 4 0.2 0.0 0.0 100.0 4 4 0.2 <15 1 0.0 0.0 0.0 100.0 5 1 0.0 Total 2,356 100.0 89.8 8.6 1.6 All 323 13.7 Table 2. Prevalence of decreased kidney function and CKD in urban Korea
eGFR, mL/min/1.73 m2by MDRD equation; Micro, microalubminuria;
Macro, macroalbuminuria.
26.9±132.6 mg/g (median: 3.8 mg/g) in men, with no sta-tistical difference noted between the gender groups (p>0.05).
Prevalence of CKD
The overall prevalence of CKD was 13.7%. The prevalences of CKD according to stage were 2.0% in stage 1, 6.7% in stage 2, 4.8% in stage 3, 0.2% in stage 4, and 0.0% in stage 5 (Table 2). The prevalence increased remarkably with age
(Table 3). The prevalence in subjects aged 65 yr or older (31.0%) was much higher than the prevalence in subjects 35 to 44 yr of age (8.8%) (p<0.05) (Table 3). Generally, the prevalence of CKD did not differ according to gender, but, in participants less than 50 yr of age, the prevalence was higher in men (11.4% vs. 7.0%, p=0.008); in subjects 50 yr of age or greater, the prevalence was lower in men compared to women (15.7% vs. 21.4%, p=0.014). The frequencies of hypertension and diabetes mellitus were higher in women
*History of CVD: cerebrovascular disease such as coronary arterial disease and cerebrovascular accident reported by participants; BMI: less than the 10th percentile (BMI <20.7 kg/m2), 10th to 50th percentile (BMI 20.7 to 24 kg/m2), 50th to 90th percentile (BMI 24.1 to 28.0 kg/m2), and greater than the
90th percentile (BMI >28.0 kg/m2).
CKD, chronic kidney disease; CVD, cerebrovascular disease; BMI, body mass index; SBP, systolic blood pressure; DBP, diastolic blood pressure. CKD stage ≥3 CKD stage 2 CKD stage 1 All CKD No-CKD Age (yr) 35-44 760 (91.2) 73 (8.8) 18 (2.2) 49 (5.9) 6 (0.7) 45-54 683 (88.9) 85 (11.1) 18 (2.3) 49 (6.4) 18 (2.3) 55-64 367 (85.0) 65 (15.0) 10 (2.3) 26 (6.0) 29 (6.7) 65 or more 223 (69.0) 100 (31.0) 2 (0.6) 34 (10.5) 64 (19.8) Female 1,037 (86.1) 168 (13.9) 21 (1.7) 85 (7.1) 62 (5.1) Male 996 (86.5) 155 (13.5) 27 (2.3) 73 (6.3) 55 (4.8) History of CVD*, no 1,974 (86.8) 299 (13.2) 45 (2.0) 150 (6.6) 104 (4.6) History of CVD*, yes 46 (69.7) 20 (30.3) 3 (4.5) 5 (7.6) 12 (18.2) Current non-smoking 1,548 (86.2) 248 (13.8) 29 (1.6) 120 (6.7) 99 (5.5) Current smoking 472 (86.9) 71 (13.1) 19 (3.5) 35 (6.4) 17 (3.1) BMI*
Less than 10th percentile 205 (88.4) 27 (11.6) 7 (3.0) 9 (3.9) 11 (4.7)
10th-50th percentile 813 (91.5) 76 (8.5) 10 (1.1) 38 (4.3) 28 (3.1)
50th-90th percentile 819 (83.7) 159 (16.3) 25 (2.6) 73 (7.5) 61 (6.2) Over 90th percentile 195 (76.2) 61 (23.8) 6 (2.3) 38 (14.8) 17 (6.6) Diabetes mellitus, absent 1,859 (88.4) 244 (11.6) 34 (1.6) 118 (5.6) 92 (4.4) Diabetes mellitus, present 161 (68.2) 75 (31.8) 14 (5.9) 37 (15.7) 24 (10.2) Fasting Glucose (mg/dL) Less than 110 1,846 (88.2) 247 (11.8) 34 (1.6) 119 (5.7) 94 (4.5) 110-125 92 (78.6) 25 (21.4) 3 (2.6) 15 (12.8) 7 (6.0) 126 or more 95 (65.1) 51 (34.9) 11 (7.5) 24 (16.4) 16 (11.0) Hypertension, no 1,367 (90.7) 140 (9.3) 21 (1.4) 73 (4.8) 46 (3.1) Hypertension, yes 651 (78.4) 179 (21.6) 27 (3.3) 82 (9.9) 70 (8.4) SBP (mmHg) Less than 110 309 (90.6) 32 (9.4) 2 (0.6) 18 (5.3) 12 (3.5) 110-119 442 (92.7) 35 (7.3) 7 (1.5) 14 (2.9) 14 (2.9) 120-129 475 (89.5) 56 (10.5) 8 (1.5) 26 (4.9) 22 (4.1) 130-139 378 (84.0) 72 (16.0) 10 (2.2) 37 (8.2) 25 (5.6) 140 or more 427 (76.9) 128 (23.1) 21 (3.8) 63 (11.4) 44 (7.9) DBP (mmHg) Less than 70 403 (91.4) 38 (8.6) 3 (0.7) 16 (3.6) 19 (4.3) 70-79 607 (88.6) 78 (11.4) 12 (1.8) 35 (5.1) 31 (4.5) 80-89 700 (86.4) 110 (13.6) 16 (2.0) 58 (7.2) 36 (4.4) 90 or more 321 (76.8) 97 (23.2) 17 (4.1) 49 (11.7) 31 (7.4) Cholesterol (mg/dL) Less than 200 1,424 (87.8) 197 (12.2) 34 (2.1) 102 (6.3) 61 (3.8) 200 or more 609 (82.9) 126 (17.1) 14 (1.9) 56 (7.6) 56 (7.6) LDL-cholesterol (mg/dL) Less than 100 939 (87.6) 133 (12.4) 25 (2.3) 64 (6.0) 44 (4.1) 100-119 577 (87.4) 83 (12.6) 12 (1.8) 42 (6.4) 29 (4.4) 120 or more 517 (82.9) 107 (17.1) 11 (1.8) 158 (6.7) 117 (5.0)
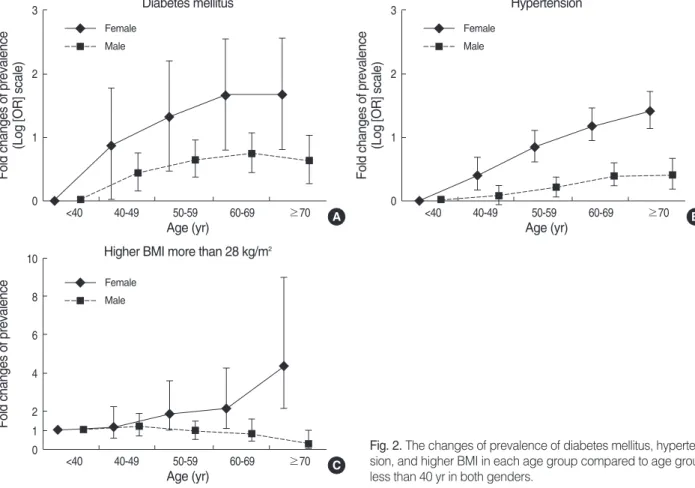
than they were in men according to age. The prevalence of higher BMI (more than 90th percentile) increased in women, but decreased in men, with age (Fig. 2). Participants with middle range BMIs (10th to 50th percentile) showed the low-est prevalence of CKD; higher BMIs were related to higher CKD prevalence (p<0.05) (Table 3). The prevalence of CKD was increased with the presence of previous cardiovascular events, hypertension, and diabetes mellitus, and with increas-es in SBP, DBP, serum glucose, serum cholincreas-esterol, and serum LDL-cholesterol (p<0.05) (Table 3).
Prevalence of albuminuria
The prevalences of albuminuria, microalbuminuria, and macroalbuminuria were 10.2%, 8.6%, and 1.6%, respective-ly. The prevalence of albuminuria increased with age (p<0.05) (Table 4). Generally, the prevalence of albuminuria was no different according to gender, but, in participants less than 50 yr of age, the prevalence was higher in men (10.6% vs. 6.5%, p=0.011). In subjects 50 yr of age or greater, the preva-lence was lower in men compared to women (10.1% vs. 14.0%,
p=0.043). The prevalence of albuminuria was also increased
in the presence of hypertension and diabetes mellitus and with increased SBP, DBP, and serum glucose (p<0.05). The albuminuria prevalence was not related to smoking, previ-ous cardiovascular events, or serum levels of cholesterol or
LDL-cholesterol (p>0.05).
Prevalence of decreased renal function (eGFR less than 60 mL/min/1.73 m2)
The prevalence of decreased renal function (eGFR less than 60 mL/min/1.73 m2) was 5.0% (Table 2). The frequency of decreased renal function was only 0.7% in participants aged 35 to 44 yr, but this figure increased to 19.8% in patients aged 65 yr or more (p<0.05) (Table 5). The prevalence of decreased renal function was no different according to gen-der, with or without stratification based on age 50 yr. The prevalence of decreased renal function was also increased in the presence of previous cardiovascular events, hypertension, and diabetes mellitus, as well as increased SBP, serum glu-cose, and serum cholesterol (p<0.05). However, the preva-lence of decreased renal function was not related to DBP or LDL-cholesterol levels (p>0.05).
Factors related to the prevalence of CKD
The ORs for the prevalence of CKD are listed in Table 6. We tested the ORs of each clinical parameter with or with-out adjustment for age, sex, BMI, hypertension, and dia-betes mellitus, which are well known risk factors for CKD. Without adjustment, the factors of age, previous
cardiovas-Fig. 2. The changes of prevalence of diabetes mellitus, hyperten-sion, and higher BMI in each age group compared to age group less than 40 yr in both genders.
Fold changes of prevalence
(Log [OR] scale)
3 2 1 0 <40 40-49 50-59 60-69 ≥70 Age (yr) Diabetes mellitus A
Fold changes of prevalence
10 8 6 4 2 0 1 <40 40-49 50-59 60-69 ≥70 Age (yr)
Higher BMI more than 28 kg/m2
C
Fold changes of prevalence
(Log [OR] scale)
3 2 1 0 <40 40-49 50-59 60-69 ≥70 Age (yr) Female Male Hypertension B Female Male Female Male
cular events, hypertension, diabetes mellitus, SBP, DBP, BMI, fasting blood glucose, serum cholesterol, and serum LDL-cholesterol were related to the presence of CKD.
Age, BMI, hypertension, diabetes mellitus, SBP, DBP, and fasting blood glucose were independent factors related to the higher prevalence of CKD after adjustment of tradi-tional risk factors for CKD.
Patients aged 65 yr or more showed the highest risk and had a 3.174-fold increase in risk for CKD compared to
par-ticipants less than 45 yr of age. Adjusted ORs for CKD were 1.591 for BMI less than 10th percentile (p=0.059), 1.856 for BMI 50th to 90th percentile (p<0.001), and 2.441 for BMI 90th percentile or more (p<0.001), compared to par-ticipants with BMIs in the 10th to 50th percentile. Diabetes mellitus and hypertension were also related to increased ORs for CKD. The prevalence of CKD was increased in subjects with SBPs 130 mmHg to 139 mmHg (1.818 folds, p=0.010) and in subjects with SBPs 140 mmHg or more (1.874 folds,
*History of CVD: cerebrovascular disease such as coronary arterial disease and cerebrovascular accident reported by participants; BMI: less than the 10th percentile (BMI <20.7 kg/m2), 10th to 50th percentile (BMI 20.7 to 24 kg/m2), 50th to 90th percentile (BMI 24.1 to 28.0 kg/m2), and greater than the
90th percentile (BMI >28.0 kg/m2).
CVD, cerebrovascular disease; BMI, body mass index; SBP, systolic blood pressure; DBP, diastolic blood pressure.
Macro* No albuminuria All albuminuria Micro*
Age (yr) 35-44 764 (91.7) 69 (8.3) 57 (6.8) 12 (1.4) 45-54 696 (90.6) 72 (9.4) 60 (7.8) 12 (1.6) 55-64 387 (89.6) 45 (10.4) 37 (8.6) 8 (1.9) 65 or more 268 (83.0) 55 (17.0) 49 (15.2) 6 (1.9) Female 1,083 (89.9) 122 (10.1) 107 (8.9) 15 (1.2) Male 1,032 (89.7) 119 (10.3) 96 (8.3) 23 (2.0) History of CVD*, no 2,044 (89.9) 229 (10.1) 191 (8.4) 38 (1.7) History of CVD*, yes 57 (86.4) 9 (13.6) 9 (13.6) 0 (0.0) Current non-smoking 1,619 (90.1) 177 (9.9) 147 (8.2) 30 (1.7) Current smoking 482 (88.8) 61 (11.2) 53 (9.8) 8 (1.5) BMI*
Less than 10th percentile 212 (91.4) 20 (8.6) 18 (7.8) 2 (0.9)
10th-50th percentile 831 (93.5) 58 (6.5) 51 (5.7) 7 (0.8)
50th-90th percentile 865 (88.4) 113 (11.6) 98 (10.0) 15 (1.5)
Over 90th percentile 206 (80.5) 50 (19.5) 36 (14.1) 14 (5.5)
Diabetes mellitus, absent 1,928 (91.7) 175 (8.3) 152 (7.2) 23 (1.1)
Diabetes mellitus, present 173 (73.3) 63 (26.7) 48 (20.3) 15 (6.4)
Fasting Glucose (mg/dL) Less than 110 1,916 (91.5) 177 (8.5) 153 (7.3) 24 (1.1) 110-125 96 (82.1) 21 (17.9) 17 (14.5) 4 (3.4) 126 or more 103 (70.5) 43 (29.5) 33 (22.6) 10 (6.8) Hypertension, no 1,407 (93.4) 100 (6.6) 84 (5.6) 16 (1.1) Hypertension, yes 692 (83.4) 138 (16.6) 116 (14.0) 22 (2.7) SBP (mmHg) Less than 110 318 (93.3) 23 (6.7) 20 (5.9) 3 (0.9) 110-119 454 (95.2) 23 (4.8) 20 (4.2) 3 (0.6) 120-129 490 (92.3) 41 (7.7) 32 (6.0) 9 (1.7) 130-139 401 (89.1) 49 (10.9) 43 (9.6) 6 (1.3) 140 or more 450 (81.1) 105 (18.9) 88 (14.5) 17 (3.1) DBP (mmHg) Less than 70 420 (95.2) 21 (4.8) 19 (4.3) 2 (0.5) 70-79 629 (91.8) 56 (8.2) 49 (7.2) 7 (1.0) 80-89 727 (89.8) 83 (10.2) 69 (8.5) 14 (1.7) 90 or more 337 (80.6) 81 (19.4) 66 (15.8) 15 (3.6) Cholesterol (mg/dL) Less than 200 1,464 (90.3) 157 (9.7) 135 (8.3) 22 (1.4) 200 or more 651 (88.6) 84 (11.4) 68 (9.3) 16 (2.2) LDL-cholesterol (mg/dL) Less than 100 968 (90.3) 104 (9.7) 86 (8.0) 18 (1.7) 100-119 599 (90.8) 61 (9.2) 56 (8.5) 5 (0.8) 120 or more 548 (87.8) 76 (12.2) 61 (9.8) 15 (2.4)
p=0.019), compared to subjects with SBPs 110 to 119 mmHg.
The adjusted OR for CKD in subjects with DBPs 90 mmHg or more was 2.308 (p=0.002) compared to subjects with DBP less than 70 mmHg. The prevalence of CKD in subjects with
fasting glucose levels of 126 mg/dL or more was 2.169 times that in subjects with fasting glucose less than 110 mg/dL (p=0.015).
DISCUSSION
Based on the results of this study, we report the prevalence of CKD to be 13.7% in urban Koreans, and we estimate that 3.2 million urban Koreans age 35 yr or older may have chron-ic kidney disease. Factors such as older age, high BMI, hyper-tension, diabetes, high blood pressures, and high fasting blood glucose were associated with an increased prevalence of CKD. Although the participants in this study were vol-unteers, they were representative of the overall urban Kore-an population age 35 yr or greater for the following reasons. First, we matched the age, gender, and sub-district of origin for participants to those in the general population. Second, we only allowed one study participant per family to exclude confounding by genetic effects. Third, almost half of Kore-ans age 35 yr or greater live in the 7 selected cities accord-ing to the 2006 Korean Population Census.
The prevalence of CKD differs in various ethnic groups. In the National Health and Nutrition Examination Survey (NHANES) III, conducted from 1988 to 1994, the preva-lence of CKD was 11.0%, and the prevapreva-lence of decreased renal function (eGFR less than 60 mL/min/1.73 m2) was 4.7% (19). In an Australian survey, the prevalences of CKD and decreased renal function were 13.1% and 11.2%, respec-tively (2). In Japan, the prevalence of decreased renal func-tion was as high as 19.2%, with estimafunc-tion of eGFR using Japanese coefficient 0.881 (3). Among Chinese patients more than 40 yr of age living in Beijing, the prevalences of CKD and decreased renal function were calculated to be 12.6% and 4.9%, respectively, based on the simplified MDRD equa-tion (20). These findings were similar to our results (13.7% and 5.0%). However, the simplified MDRD equation is not easily applied in all races, especially in Asians (17). There are modifications of the MDRD equation for Japanese and the Chinese populations (21, 22). With support from the Kore-an Society of Nephrology, the study is proceeding to deter-mine if the MDRD equation is applicable in Korean patients and to determine if a modification coefficient is needed in the Korean equation. Hence, the eGFR in this study was limited in its estimate of the prevalence of CKD. When we calculated the eGFR using the Cockcroft-Gault equation divided by the body surface area (CG/BSA), described in a previous report by Coresh et al. (19), the overall prevalence of CKD was 17.0% (401/2,356), and the prevalence of CKD stage 3 or more was 8.6% (203/2,356). These figures were higher than those obtained using the MDRD equation. Other studies have also shown a higher prevalence of CKD using the CG/BSA equation, compared to the MDRD equation (23, 24). There is still debate concerning which is the more
eGFR ≥90 eGFR <60 eGFR 60-89 Age (yr) 35-44 182 (21.8) 645 (77.4) 6 (0.7) 45-54 160 (20.8) 590 (76.8) 18 (2.3) 55-64 82 (19.0) 321 (74.3) 29 (6.7) 65 or more 11 (3.4) 248 (76.8) 64 (19.8) Female 240 (19.9) 903 (74.9) 62 (5.1) Male 195 (16.9) 901 (78.3) 55 (4.8) History of CVD*, no 421 (18.5) 1,748 (76.9) 104 (4.6) History of CVD*, yes 12 (18.2) 42 (63.6) 12 (18.2) Current non-smoking 330 (18.4) 1,367 (76.1) 99 (5.5) Current smoking 103 (19.0) 423 (77.9) 17 (3.1) BMI*
Less than 10th percentile 64 (27.6) 157 (67.7) 11 (4.7) 10th-50th percentile 173 (19.5) 688 (77.4) 28 (3.1) 50th-90th percentile 161 (16.5) 756 (77.3) 61 (6.2) Over 90th percentile 37 (14.5) 202 (78.9) 117 (6.6) Diabetes mellitus, absent 395 (18.8) 1,616 (76.8) 92 (4.4) Diabetes mellitus, present 38 (16.1) 174 (73.7) 24 (10.2) Fasting Glucose (mg/dL) Less than 110 390 (18.6) 1,609 (76.9) 94 (4.5) 110-125 17 (14.5) 93 (79.5) 7 (6.0) 126 or more 28 (19.2) 102 (69.9) 16 (11.0) Hypertension, no 286 (19.0) 1,175 (78.0) 46 (3.1) Hypertension, yes 147 (17.7) 613 (73.9) 70 (8.4) SBP (mmHg) Less than 110 69 (20.2) 260 (76.2) 12 (3.5) 110-119 97 (20.3) 366 (76.7) 14 (2.9) 120-129 90 (16.9) 419 (78.9) 22 (4.1) 130-139 80 (17.8) 345 (76.7) 25 (5.6) 140 or more 99 (17.8) 412 (74.2) 44 (7.9) DBP (mmHg) Less than 70 98 (22.2) 324 (73.5) 19 (4.3) 70-79 123 (18.0) 531 (77.5) 31 (4.5) 80-89 129 (15.9) 645 (79.6) 36 (4.4) 90 or more 85 (20.3) 302 (72.2) 31 (7.4) Cholesterol (mg/dL) Less than 200 336 (20.7) 1,224 (75.5) 61 (3.8) 200 or more 99 (13.5) 580 (78.9) 56 (7.6) LDL-cholesterol (mg/dL) Less than 100 217 (20.2) 811 (75.7) 44 (4.1) 100-119 131 (19.8) 500 (75.8) 29 (4.4) 120 or more 87 (13.9) 493 (79.0) 44 (7.1) Table 5. The prevalence of eGFR groups in adults aged 35 yr or more in urban Korea
*History of CVD: cerebrovascular disease such as coronary arterial disease and cerebrovascular accident reported by participants; BMI: less than the 10th percentile (BMI <20.7 kg/m2), 10th to 50th percentile
(BMI 20.7 to 24 kg/m2), 50th to 90th percentile (BMI 24.1 to 28.0 kg/m2),
and greater than the 90th percentile (BMI >28.0 kg/m2).
eGFR, estimated glomerular filtration rate; CVD, cerebrovascular dis-ease; BMI, body mass index; SBP, systolic blood pressure; DBP, diastolic blood pressure.
accurate equation to estimate GFR, especially in Asian pati-ents. Hence, we need to re-analyze this data in the near future according to the new method of estimating GFR. The preva-lence of CKD in subjects with routine health check-up from a Korean tertiary hospital was 16.1% (25) higher than that of this study because the criteria of albuminuria in that study was defined by the result of urine dipstick test, the hema-turia was also regarded as the sign of renal damage, and the
study population was not matched to the general population but included from the visitors to health promotion center of a tertiary hospital.
Advanced age is a well known risk factor for CKD, and our study supported this finding (3, 4, 19). Individuals with-out diabetes mellitus or hypertension, which are also inde-pendent risk factors for CKD that increase with aging, were more likely to have CKD and decreased renal function in old
*History of CVD: cerebrovascular disease such as coronary arterial disease and cerebrovascular accident reported by participants; BMI: less than the 10th percentile (BMI <20.7 kg/m2), 10th to 50th percentile (BMI 20.7 to 24 kg/m2), 50th to 90th percentile (BMI 24.1 to 28.0 kg/m2), and greater
than the 90th percentile (BMI >28.0 kg/m2); �Adjusted with age, gender, BMI, hypertension, and diabetes mellitus.
CKD, chronic kidney disease; OR, odds ratio; CVD, cerebrovascular disease; BMI, body mass index; SBP, systolic blood pressure; DBP, diastolic blood pressure.
p
Crude OR [95% CI] p Adjusted OR [95% CI]�
Age (yr) 35-44 1.000 - 1.000 -45-54 1.296 [0.932-1.801] 0.123 1.100 [0.784-1.545] 0.581 55-64 1.844 [1.291-2.634] 0.001 1.263 [0.862-1.849] 0.230 65 or more 4.669 [3.334-6.537] <0.001 3.174 [2.202-4.574] <0.001 Female 1.000 - 1.000 -Male 0.961 [0.759-1.215] 0.737 0.887 [0.687-1.145] 0.359 History of CVD*, no 1.000 - 1.000 -History of CVD*, yes 2.870 [1.675-4.920] <0.001 1.471 [0.818-2.645] 0.197 Current non-smoking 1.000 - 1.000 -Current smoking 0.939 [0.707-1.246] 0.663 1.111 [0.792-1.558] 0.541 BMI*
Less than 10th percentile 1.409 [0.885-2.243] 0.149 1.591 [0.983-2.575] 0.059
10th-50th percentile 1.000 - 1.000
-50th-90th percentile 2.077 [1.554-2.776] <0.001 1.856 [1.372-2.510] <0.001 Over 90th percentile 3.346 [2.308-4.851] <0.001 2.441 [1.642-3.629] <0.001
Diabetes mellitus, no 1.000 - 1.000
-Diabetes mellitus, yes 3.549 [2.617-4.814] <0.001 2.532 [1.823-3.517] <0.001 Fasting Glucose (mg/dL) Less than 110 1.000 - 1.000 -110-125 2.031 [1.280-3.222] 0.003 1.460 [0.892-2.390] 0.132 126 or more 4.012 [2.785-5.781] <0.001 2.169 [1.161-4.050] 0.015 Hypertension, no 1.000 - 1.000 -Hypertension, yes 2.685 [2.112-3.413] <0.001 1.850 [1.420-2.410] <0.001 SBP (mmHg) Less than 110 1.308 [0.792-2.158] 0.294 1.355 [0.806-2.277] 0.252 110-119 1.000 - 1.000 -120-129 1.489 [0.957-2.316] 0.077 1.213 [0.766-1.918] 0.410 130-139 2.405 [1.570-3.685] <0.001 1.818 [1.157-2.857] 0.010 140 or more 3.786 [2.546-5.629] <0.001 1.874 [1.111-3.161] 0.019 DBP (mmHg) Less than 70 1.000 - 1.000 -70-79 1.363 [0.907-2.049] 0.137 1.300 [0.841-2.010] 0.238 80-89 1.667 [1.130-2.458] 0.010 1.373 [0.894-2.107] 0.148 90 or more 3.205 [2.142-4.794] <0.001 2.308 [1.366-3.900] 0.002 Cholesterol (mg/dL) Less than 200 1.000 - 1.000 -200 or more 1.496 [1.173-1.907] 0.001 1.270 [0.979-1.649] 0.072 LDL-cholesterol (mg/dL) Less than 100 1.000 - 1.000 -100-119 1.016 [0.658-1.361] 0.918 0.991 [0.725-1.354] 0.954 120 or more 1.461 [1.109-1.926] 0.007 1.308 [0.973-1.758] 0.075
age (19). The prevalence of decreased renal function (eGFR less than 60 mL/min/1.73 m2) was low in younger partici-pants (0.3% in age group 35 to 44 yr, 1.1% in age group 45 to 54 yr) without diabetes or hypertension, but it was quite high (21.1%) among subjects older than 65 yr of age without diabetes or hypertension, similar to the NHANES III report (19).
Male gender is known as a risk factor for ESRD (26). In women, the cumulative incidence of ESRD remains lower than that of men during the reproductive years, but then increases after menopause (26). However, in many cross-sec-tional studies, the prevalence of CKD is greater in women than it is in men. The NHANES data showed a higher prevalence of CKD in women (19, 27). The AusDiab study also reported a significant gender difference (9.3% in males and 13.0% in females) (2). In the present study, there were no differences in the CKD prevalences between the genders. However, male participants younger than 50 yr of age showed a higher prevalence of CKD than females of the same age did, and female participants 50 yr of age or more had a higher prevalence of CKD than male participants did. One of the possible explanations of the gender difference in CKD prevalence according to age was that the increase rates of the prevalence of hypertension, diabetes, and higher BMI with aging in females were higher than in males from the ages of 40-50 yr (Fig. 2).
In our study, high BMI was also an independent predic-tor of CKD, as in other studies (4, 28). High BMI was an independent risk factor of decreased renal function (29) and was also associated with an increased incidence of ESRD in Japanese individuals living on Okinawa (26). In the present study, the risk of CKD increased in participants with BMI greater than 24 kg/m2, which means that the modest increase in BMI could be a risk factor for renal injury in Asian popu-lations (28, 30). This is consistent with the findings that Asians develop cardiovascular complications at lower BMIs compared to white individuals and that the upper limit of normal BMI for Asians is closer to 23 kg/m2than it is to 25 kg/m2(31).
It is already known that factors such as hypertension (4, 19, 32), diabetes (19, 32), and blood pressure (27, 33) tribute to CKD, which is also evident in this study. We con-firmed that systolic blood pressures of 130 mmHg or more, diastolic blood pressures of 90 mmHg or more, and fasting blood glucose levels of 126 mg/dL or more were indepen-dently related to the prevalence of CKD.
The present study has some limitations. First, study par-ticipants were not randomly selected across the whole nation, and they were mainly urbanites. This indicates a selection bias. However, the selected participants were representative of urban residents because they were selected in proportion to the age and sex of the general populations in the 7 cities, which contain approximately 50% of the Korean popula-tion. Second, the present study was a cross-sectional design.
Therefore, we could not confirm definite causality between CKD and its risk factors. Third, for laboratory studies, esti-mation was based on one measurement and might have false positive or false negative errors. CKD patients in this study may or may not have had acute renal insufficiency. Although the method used to measure serum creatinine in participat-ing hospitals was the Jaffe method, the auto-analyzer mod-els differed. We did not standardize the serum creatinine result among hospitals. These factors could have led to over-estimation or underover-estimation of the prevalence of CKD. And, as stated above, the MDRD equation for Koreans has not been validated and is under investigation. For this rea-son, the CG/BSA equation was also used for estimating GFR on supplementary analysis.
Despite the above limitations, the present study is the first epidemiologic study designed to survey the prevalence of CKD in Korea. The prevalence of CKD in Korea was 13.7%, which is similar to that seen in Chinese patients in Beijing. The factors associated with CKD were age, BMI, diabetes mellitus, hypertension, blood pressure, and fasting glucose. Korea, in which the prevalence of CKD including ESRD is increasing, should prepare a policy of early detection and appropriate treatment for CKD patients. The present data will be helpful in taking this action.
ACKNOWLEDGMENTS
We thank Dr. Seung Seok Han for wonderful assistance to refine this paper and all investigators, who were listed in the appendix, for participating in this survey.
APPENDIX
Institutions that participated in the study (Investigators). Chonnam National University Medical School (Nam Ho Kim), Chungnam National University College of Medicine (Ki-Ryang Na, Kang Wook Lee), Ewha Womans Universi-ty College of Medicine (Seung-Jung Kim, Kyu Bok Choi), Gachon University of Medicine and Science (Woo Kyung Chung), Hallym University College of Medicine (Ji Eun Oh, Tae Jin Park), Korea University College of Medicine (Won Yong Cho), Kyungpook National University School of Medi-cine (Chan-Duck Kim, Yong-Lim Kim), Pusan National Uni-versity College of Medicine (Dong Won Lee), Seoul Nation-al University College of Medicine (Kwon Wook Joo, Kook Hwan Oh), University of Ulsan College of Medicine (Jong Soo Lee), ordered by alphabet.
REFERENCES
Lente F, Levey AS. Prevalence of chronic kidney disease in the
Unit-ed States. JAMA 2007; 298: 2038-47.
2. Chadban SJ, Briganti EM, Kerr PG, Dunstan DW, Welborn TA, Zimmet PZ, Atkins RC. Prevalence of kidney damage in Australian
adults: the AusDiab kidney study. J Am Soc Nephrol 2003; 14 (7 Suppl 2): S131-8.
3. Imai E, Horio M, Iseki K, Yamagata K, Watanabe T, Hara S, Ura N, Kiyohara Y, Hirakata H, Moriyama T, Ando Y, Nitta K, Inaguma D, Narita I, Iso H, Wakai K, Yasuda Y, Tsukamoto Y, Ito S, Maki-no H, Hishida A, Matsuo S. Prevalence of chronic kidney disease
(CKD) in the Japanese general population predicted by the MDRD equation modified by a Japanese coefficient. Clin Exp Nephrol 2007; 11: 156-63.
4. Zhang L, Zhang P, Wang F, Zuo L, Zhou Y, Shi Y, Li G, Jiao S, Liu Z, Liang W, Wang H. Prevalence and factors associated with CKD:
a population study from Beijing. Am J Kidney Dis 2008; 51: 373-84.
5. Go AS, Chertow GM, Fan D, McCulloch CE, Hsu CY. Chronic
kid-ney disease and the risks of death, cardiovascular events, and hos-pitalization. N Engl J Med 2004; 351: 1296-305.
6. Foley RN, Murray AM, Li S, Herzog CA, McBean AM, Eggers PW, Collins AJ. Chronic kidney disease and the risk for cardiovascular
disease, renal replacement, and death in the United States medicare population, 1998 to 1999. J Am Soc Nephrol 2005; 16: 489-95.
7. Shlipak MG, Sarnak MJ, Katz R, Fried LF, Seliger SL, Newman AB, Siscovick DS, Stehman-Breen C. Cystatin C and the risk of death
and cardiovascular events among elderly persons. N Engl J Med 2005; 352: 2049-60.
8. Sarnak MJ, Levey AS, Schoolwerth AC, Coresh J, Culleton B, Hamm LL, McCullough PA, Kasiske BL, Kelepouris E, Klag MJ, Parfrey P, Pfeffer M, Raij L, Spinosa DJ, Wilson PW. Kidney disease as a
risk factor for development for cardiovascular disease-A statement from the American Heart Association Councils on kidney in cardio-vascular disease, high blood pressure research, clinical cardiology, and epidemiology and prevention. Circulation 2003; 108: 2154-69.
9. Fried LF, Katz R, Sarnak MJ, Shlipak MG, Chaves PH, Jenny NS, Stehman-Breen C, Gillen D, Bleyer AJ, Hirsch C, Siscovick D, New-man AB. Kidney function as a predictor of noncardiovascular
mor-tality. J Am Soc Nephrol 2005; 16: 3728-35.
10. Madan P, Kalra OP, Agarwal S, Tandon OP. Cognitive impairment
in chronic kidney disease. Nephrol Dial Transplant 2007; 22: 440-4.
11. Chin HJ, Song YR, Lee JJ, Lee SB, Kim KW, Na KY, Kim S, Chae DW. Moderately decreased renal function negatively affects the
health-related quality of life among the elderly Korean population: a popu-lation-based study. Nephrol Dial Transplant 2008; 23: 2810-7.
12. Moranne O, Froissart M, Rossert J, Gauci C, Boffa JJ, Heymann JP, M’rad MB, Jacquot C, Houillier P, Stengel B, Fouqueray B; Nephro-Test Study Group. Timing of onset of CKD-related metabolic
com-plications. J Am Soc Nephrol 2009; 20: 164-71.
13. John R, Webb M, Young A, Stevens PE. Unreferred chronic kidney
disease: a longitudinal study. Am J Kidney Dis 2004; 43: 825-35.
14. Hunsicker LG. The consequences and costs of chronic kidney
dis-ease before ESRD. J Am Soc Nephrol 2004; 15: 1363-4.
15. Korean Society of Nephrology, ESRD Registry committee. Renal
replacement therapy in Korea: insan memorial dialysis registry 2005.
Korean J Nephrol 2006; 25 (S2): S425-57.
16. Brodsky J. International comparisons. Am J Kidney Dis 2008; 51
(Suppl 1): S239-54.
17. Levey AS, Bosch JP, Lewis JB, Greene T, Rogers N, Roth D. A more
accurate method to estimate glomerular filtration rate from serum creatinine: a new prediction equation. Modification of Diet in Renal Disease Study Group. Ann Intern Med 1999; 130: 461-70.
18. Kwan BC, Murtaugh MA, Beddhu S. Associations of body size with
metabolic syndrome and mortality in moderate chronic kidney dis-ease. Clin J Am Soc Nephrol 2007; 2: 992-8.
19. Coresh J, Astor BC, Greene T, Eknoyan G, Levey AS. Prevalence
of chronic kidney disease and decreased kidney function in the adult US population: Third National Health and Nutrition Examination Survey. Am J Kidney Dis 2003; 41: 1-12.
20. Li ZY, Xu GB, Xia TA, Wang HY. Prevalence of chronic kidney
disease in a middle and old-aged population of Beijing. Clin Chim Acta 2006; 366: 209-15.
21. Imai E, Horio M, Nitta K, Yamagata K, Iseki K, Tsukamoto Y, Ito S, Makino H, Hishida A, Matsuo S. Modification of the
Modifica-tion of Diet in Renal Disease (MDRD) Study equaModifica-tion for Japan. Am J Kidney Dis 2007; 50: 927-37.
22. Ma YC, Zuo L, Chen JH, Luo Q, Yu XQ, Li Y, Xu JS, Huang SM, Wang LN, Huang W, Wang M, Xu GB, Wang HY. Modified
glo-merular filtration rate estimating equation for Chinese patients with chronic kidney disease. J Am Soc Nephrol 2006; 17: 2937-44.
23. Wasen E, Isoaho R, Mattila K, Vahlberg T, Kivela SL, Irjala K.
Esti-mation of glomerular filtration rate in the elderly: a comparison of creatinine-based formulae with serum cystatin C. J Intern Med 2004; 256: 70-8.
24. Viktorsdottir O, Palsson R, Andresdottir MB, Aspelund T, Gudna-son V, IndridaGudna-son OS. Prevalence of chronic kidney disease based
on estimated glomerular filtration rate and proteinuria in Icelandic adults. Nephrol Dial Transplant 2005; 20: 1799-807.
25. Chin HJ, Oh KH, Oh YK, Na KY, Joo KW, Lim CS, Kim YS, Chae DW, Ahn C, Han JS, Lee JS, Kim S. The Prevalence and the
Asso-ciated Disorders of Chronic Kidney Disease in Subjects with Health Check-Up. Korean J Nephrol 2007; 26: 195-203.
26. Iseki K, Iseki C, Ikemiya Y, Fukiyama K. Risk of developing
end-stage renal disease in a cohort of mass screening. Kidney Int 1996; 49: 800-5.
27. Coresh J, Byrd-Holt D, Astor BC, Briggs JP, Eggers PW, Lacher DA, Hostetter TH. Chronic kidney disease awareness, prevalence, and
trends among U.S. adults, 1999 to 2000. J Am Soc Nephrol 2005; 16: 180-8.
28. Domrongkitchaiporn S, Sritara P, Kitiyakara C, Stitchantrakul W, Krittaphol V, Lolekha P, Cheepudomwit S, Yipintsoi T. Risk factors
for development of decreased kidney function in a southeast Asian population: a 12-year cohort study. J Am Soc Nephrol 2005; 16: 791-9.
29. Fox CS, Larson MG, Leip EP, Culleton B, Wilson PW, Levy D.
Pre-dictors of new-onset kidney disease in a community-based popula-tion. JAMA 2004; 291: 844-50.
30. Ramirez SP, McClellan W, Port FK, Hsu SI. Risk factors for
Nephrol 2002; 13: 1907-17.
31. Ko GT, Tang J, Chan JC, Sung R, Wu MM, Wai HP, Chen R. Lower
BMI cut-off value to define obesity in Hong Kong Chinese: an anal-ysis based on body fat assessment by bioelectrical impedance. Br J Nutr 2001; 85: 239-42.
32. Kuo HW, Tsai SS, Tiao MM, Yang CY. Epidemiological features
of CKD in Taiwan. Am J Kidney Dis 2007; 49: 46-55.
33. Iseki K, Iseki C, Ikemiya Y, Kinjo K, Takishita S. Risk of developing
low glomerular filtration rate or elevated serum creatinine in a screened cohort in Okinawa, Japan. Hypertens Res 2007; 30: 167-74.