Journal of Magnetics 22(2), 169-174 (2017) https://doi.org/10.4283/JMAG.2017.22.2.169
©2017 Journal of Magnetics
Structural and Magnetic Properties of Mechanochemically Prepared
Li Ferrite Nanoparticles
M. Haddadi, M. Mozaffari*, and J. Amighian
Department of Physics, Faculty of Science, University of Isfahan, Isfahan 81746-73441, Iran (Received 10 December 2016, Received in final form 23 March 2017, Accepted 24 March 2017)
In this work, lithium ferrite (Li0.5Fe2.5O4) nanoparticles were prepared via mechanochemical processing and
subsequent heat treatment at a relatively low (600 °C) calcining temperature. The raw materials used were high purity Fe2O3 and Li2CO3 that were milled for between 2 and 20 h. The milled powders were then calcined at
temperatures of 500 and 600 °C for 5 h in air. XRD results show that optimum conditions to obtain single phase lithium ferrite nanoparticles with a mean crystallite size of about 23 nm, using Scherrer’s formula, are 10 h milling and calcination at 600 °C. Saturation magnetization and coercivity of the single phase Li ferrite nanoparticles are 44.6 emu/g and 100 Oe respectively, which are both smaller than those of the bulk Li ferrite. The Curie temperature of the single sample was determined by a Faraday balance, which is 578 °C and smaller than that of bulk Li ferrite.
Keywords : lithium ferrite, mechanochemical processing, magnetic properties
1. Introduction
Lithium ferrite is one of the most important ferrimag-netic materials for application in microwave frequencies and has long been studied as a substitution for yttrium iron garnet (YIG) with the same bandwidth but with a higher Curie temperature, a higher saturation magnetization and a lower price [1, 2].
Lithium ferrite is prepared by different methods [3-8], with the most common being the conventional ceramic method. In this method, iron oxide and lithium carbonate are mixed in a proper portion and react by solid state reaction at a relatively high temperature of at least 1200 °C. Solid state reaction has some disadvantages, such as coarse particles, lithium-loss and some impurity phases, such as α-Fe2O3 and Fe3O4, because of high temperature calcination [9, 10]. Among other methods, wet chemical methods, such as coprecipitation, sol-gel and hydro-thermal, are used to prepare lithium ferrite nanoparticles. These are suitable methods because they allow particle size to be controlled. However, they have some dis-advantages, such as chemical waste and environmental pollution, and are not suitable for mass production [3, 4].
Mechanical milling (or alloying) is a simple and an inexpensive method for the preparation and mass pro-duction of the nanoparticles (or alloys), and was used for the first time in the 1960s [11, 12]. In mechanical milling (or alloying), high-energy ball mills are utilized for the preparation of the compounds (or alloys) from metal powders [12]. It was found that after a heat treatment, the characteristics of the alloys prepared by mechanical alloy-ing are superior to those prepared by the conventional method. In mechanical milling (or alloying), the particle size can be controlled by factors such as type of mill, milling speed, milling time, and ball size and ball to powder mass ratio [13].
High energy mechanical milling is a suitable method for the preparation of spinel ferrite nanoparticles [14-17], because of the ferrites’ fragile nature, which allows the milling process to take place in a shorter time than that of metal powders. If chemical reactions take place during of the milling process, it is known as “mechanochemical processing”. Those chemical reactions may result in the formation of desired and/or intermediate phases [18-20]. In addition to this feature, some advantages of the mech-anochemical processing are: the ability to use a lower calcination temperature than that needed in the conven-tional ceramic method; ease of nanoparticle preparation; and a lower cost [21, 22]. However, this method also has some disadvantages when compared with wet methods,
©The Korean Magnetics Society. All rights reserved. *Corresponding author: Tel: +98-31-3793-4741 Fax: +98-31-3793-4800, e-mail: [email protected]
2. Experimental
Lithium ferrite nanoparticles with the stoichiometric formula Li0.5Fe2.5O4 (or LiFe5O8) have been prepared by MCP. The starting materials used were Fe2O3 and Li2CO3, both from the Merck Co. Germany, with minimum purities of 99 %. A total of 4 g of the raw materials was weighed and mixed together in a hardened steel vial (125 cc) in air for 2, 10 and 20 h, using a SPEX 8000D mixer/ mill with a ball to powder mass ratio of 7. Balls were made from hardened stainless steel and composed of two sizes, 9 and 12.6 mm in diameter. To obtain single phase lithium ferrite, the milled powders were calcined at temperatures of 500 and 600 ºC for 5 h in air. The crystal structure of the powders was identified by an X-ray diffr-actometer (BRUKER, D8 ADVANCED model) before and after calcination, using CuKα radiation (λ = 1.5406 Å), and the mean crystallite size was estimated by Scherrer's formula: d=0.9λ/Bcosθ, where d is the mean crystallite size, λ is the wavelength of the X-ray radiation, B is the full width at half maximum (FWHM) of the most intense peak (311), and θ is the Bragg angle [12].
A hydraulic press machine was used to form pellets of the calcined powders. Several drops of a 5% PVA (poly-vinyl alcohol) solution were used as a binder. The powders
4πMs of the sample from B-H loops, high field parts of the loops were fitted linearly and extrapolated to zero field. In order to obtain saturation magnetization in emu/ g, 4πMs was divided by 4πρ, where ρ (g/cc) is the density of the sample [24].
Curie temperatures of the single phase sample were determined by recording self-inductance temperature (L-T) curves, using an LCR-meter (Fluke, 6303 model).
3. Results and Discussion
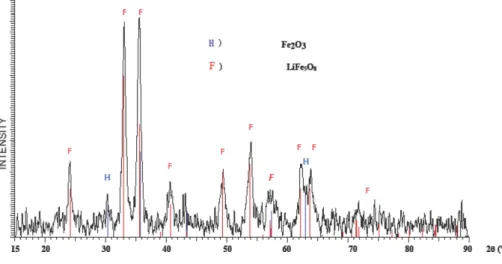
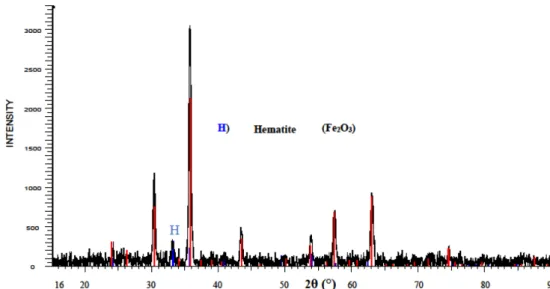
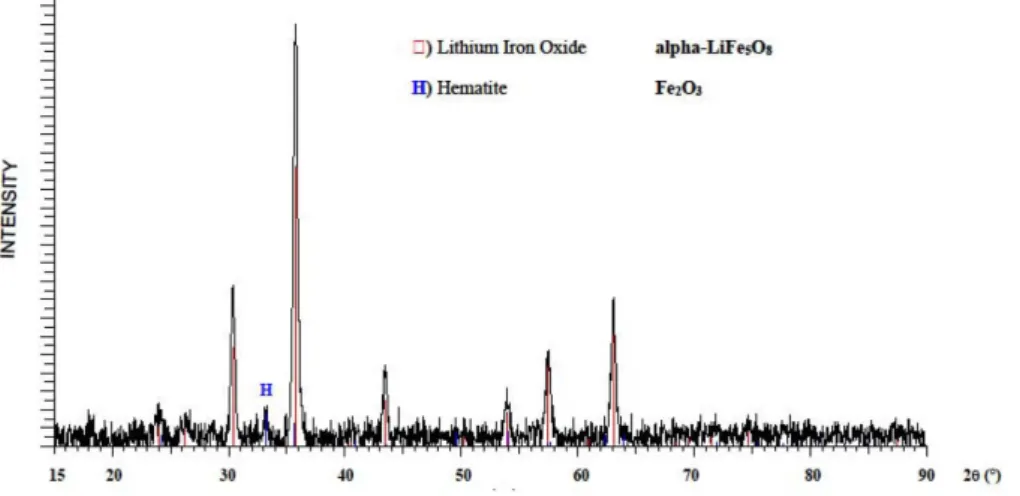
Figures 1 to 3 show XRD patterns of the as-milled samples for different milling times. As can be seen, the desired lithium ferrite phase is formed after 2 h milling. It is also apparent that by increasing milling time from 2 to 10 h, the amount of lithium ferrite phase increases, but there is still a small amount of hematite phase. Figure 3 shows that longer milling time (20 h) cannot result in a single phase lithium ferrite, because of the milling media wear, which in turn leads to an increase in unwanted α-Fe2O3 phase.
Figures 4 to 7 show XRD patterns of the milled powders for 10 and 20 h, which are calcined at 500 and 600 ºC for 5 h. As can be seen, calcined powders at 600 ºC are single phase lithium ferrite, which shows at this
temperature the necessary activation energy is provided by heat. This temperature is much lower than that usually used in the conventional method, which is about 1200 ºC
[25]. The same results have been reported for Li ferrite prepared by MCP [26, 27]. In those works, the necessary temperature for formation of single phase sample is higher
Fig. 2. (Color online) XRD pattern of the sample milled for 10 h. The unlabeled peaks are related to Li-ferrite.
Fig. 3. (Color online) XRD pattern of the sample milled for 20 h. The unlabeled peaks are related to Li-ferrite.
than 600 ºC. However, we prepared the single phase sample at the temperature of 600 ºC and this avoids from lithium-loss due to a high temperature calcining temper-ature, which is used normally in the conventional ceramic
method [9, 10].
Figure 8 shows B-H curve of the single phase sample milled for 10 h and calcined at 600 °C for 5 h. As can be seen, coercive force (HC) and saturation magnetization
Fig. 5. (Color online) XRD pattern of the sample milled for 20 h and calcined at 500 °C. The unlabeled peaks are related to Li-ferrite.
Fig. 6. (Color online) XRD pattern of the single phase sample milled for 10 h and calcined at 600 °C.
(4πMs) of the sample are 100 ± 10 Oe and 1316 ± 20 G respectively.
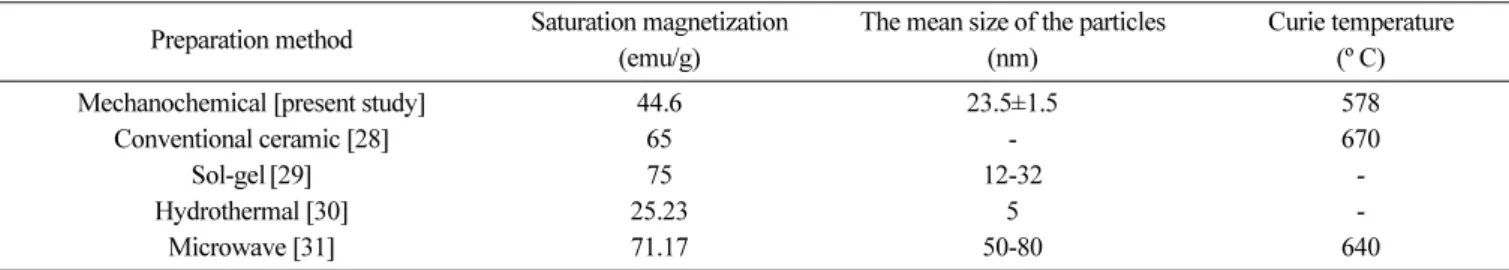
Saturation magnetization, Curie temperature and mean crystallite size of the single phase lithium ferrite are tabulated in Table 1. These parameters related to lithium ferrite prepared by other methods are also tabulated in Table 1.
The results show that the saturation magnetization of lithium ferrite prepared by the mechanochemical method is lower than in those prepared by other methods, except the hydrothermal technique. The lower saturation mag-netization of lithium ferrite nanoparticles prepared by mechanochemical processing in comparison with that of the bulk sample can be explained by the core-shell model [32]. This is due to the formation of a magnetic dead layer on the surface of the nanoparticles in the course of mechanical milling, and of course a high surface to volume ratio in nano scale.
Figure 9 shows variation of self-inductance (that is proportional to permeability) of the single phase sample with respect to temperature. The Curie temperature of the single phase sample is 578 ± 10 °C, which is lower than that of the samples prepared by the conventional ceramic method, as can be seen in Table 1. This is due to higher magnetic dipoles, which are on the surface of the nano-particles [16].
The lattice constant and the mean crystallite size of the
lithium ferrites prepared by different conditions are tabulated in Table 2. As can be seen, increasing of the milling time from 10 to 20 h, resulted in a decrease in the mean
Fig. 8. B-H loop of the single phase sample.
Table 1. Saturation magnetization, Curie temperature and mean crystallite size of lithium ferrite prepared by various methods. Preparation method Saturation magnetization
(emu/g)
The mean size of the particles (nm)
Curie temperature (º C)
Mechanochemical [present study] 44.6 23.5±1.5 578
Conventional ceramic [28] 65 - 670
Sol-gel[29] 75 12-32
-Hydrothermal [30] 25.23 5
-Microwave [31] 71.17 50-80 640
Fig. 9. Variation of self-inductance with respect to tempera-ture for the single phase sample.
Table 2. Mean crystallite sizes and lattice constants of lithium ferrites prepared at different conditions.
Sample preparation conditions Mean crystallite size (nm) Lattice constant (Å) Milled for 10 h 21 8.37 Milled for 20 h 12 8.34
Milled for 10 h and
annealed at 600 ºC 23 8.34
Fig. 10. SEM micrograph of the single phase Li ferrite nanoparticles.
it can be concluded that each particle is composed of several crystallites.
4. Conclusions
The results of this research show that:
1. It is possible to obtain single phase lithium ferrite nanoparticles by mechanochemical processing and sub-sequent heat treatment at a temperature much lower than that usually used in the conventional ceramic method.
2. It is possible to carry out both milling and calci-nation processing in air.
3. Longer milling times result in a higher amount of the desired phase, but because of the milling media wear, unwanted hematite phase is increased too. There is there-fore an optimum milling time to obtain a single phase lithium ferrite by MCP.
Acknowledgments
This study was completed at The University of Isfahan and supported by The Office of Graduate Studies. The authors are grateful to the office for their support.
References
[1] J. Smit and H. P. J. Wijn, Ferrites, Philips Technical Library, Eindhoven (1959).
[2] S. Y. An, I. B. Shim, and C. S. Kim, J. Magn. Magn. Mater. 290-291, 1551 (2005).
[3] A. Tavkoli, M. Sohrabi, and A. Kargari, Chem. Pap. 61, 151 (2007).
[4] D. Segal, J. Mater. Chem. 7, 1297 (1997).
[5] C. J. Brinker and G. W. Scherer, Sol-Gel Science: The Physics and Chemistry of Sol-Gel Processing, Academic Press, San Diego (1990) pp 667-781.
[6] M. L. S. Teo, L. B. Kong, Z. W. Li, G. Q. Lin, and Y. B. Gan, J. Alloys Compd. 459, 557 (2008).
[13] D. R. Maurice and T. H. Courtney, Metall. Trans. A 21, 289 (1990).
[14] A. Hasanpour, M. Mozaffari, M. R. Azani, and A. Has-sanpour, Russ. J. Phys. Chem. A 86, 264 (2012). [15] M. Mozaffari and Y. Zare, J. Supercond. Nov. Magn. 28,
3157 (2015).
[16] M. Mozaffari, M. Eghbali Arani, and J. Amighian, J. Magn. Magn. Mater. 322, 3240 (2010).
[17] M. Mozaffari and H. Masoudi, J. Supercond. Nov. Magn. 27, 2563 (2014).
[18] M. Mozaffari, M. Gheisari, M. Niyaifar, and J. Amighian, J. Magn. Magn. Mater. 321, 2981 (2009).
[19] A. Hasanpour, M. Mozaffari, and J. Amighian, Physica B 387, 298 (2007).
[20] M. Mozaffari, F. Ebrahimi, S. Daneshfozon, and J. Amighian, J. Alloys Compd. 449, 65 (2008).
[21] T. Tsuzuki, K. Pethick, and P. G. McCormick, J. Nanopart. Res. 2, 375 (2000).
[22] Takuya Tsuzuki and Paul G. McCormick, J. Mater. Sci. 39, 5143 (2004).
[23] K. Rama Krishna, K. Vijaya Kumar, and Dachepalli Ravinder, Adv. Mater. Phys. Chem. 2, 185 (2012). [24] B. D. Cullity and C. D. Graham, Introduction to
Mag-netic Materials, John Wiley & Sons, NJ (2009) p 7. [25] S. Soreto Teixeira, M. P. F. Graça, and L. C. Costa, J.
Non-Cryst. Solids 358, 1924 (2012).
[26] Hisham M. Widatallah and Frank J. Berry, J. Solid State Chem. 164, 230 (2002).
[27] S. A. Mazen and N. I. Abu-Elsaad, Appl. Nanosci. 5, 105 (2015).
[28] J. Smit and H. P. J. Wijn, Ferrites, Philips Technical Library, Eindhoven (1959) p 157.
[29] M. George, S. S. Nair, A. M. John, P. A. Joy, and M. R. Anantharaman, J. Phys. D: Appl. Phys. 39, 900 (2006). [30] X. Wang, L. Gao, L. Li, H. Zheng. Z. Zhang, W. Yu, and
Y. Qian, Nanotech. 16, 2677 (2005).
[31] Y. P. Fu, S. Tsao, C. T. Hu, and Y. D. Yao, J. Alloys Compd. 395, 272 (2005).
[32] M. Mouroi, R. Street, P. G. McCormick, and J. Amighian, Phys. Rev. B 63, 184414 (2001).