Seismic Fragility Analysis of a KSNP Containment Building by Nonlinear Seismic Analyses
In-Kil Choi,a Seong-Moon Ahn,a Young-Sun Choun,a Jeong-Moon Seo,a Jae-Chul Shin,ba Korea Atomic Energy Research Institute, Integrated Safety Assessment Division, P.O. Box 105, Yuseong, Daejeon, Korea : [email protected]
b Chungnam National University, Civil Engineering Dept. 220 Gungdong, Yuseong, Daejeon, Korea
1. Introduction
The seismic safety of a nuclear power plant can not be secured by considering only the design basis earthquake which is the standard response spectrum proposed by US NRC [1], since the seismological situation of the nuclear power plant site is changed during the development of geosciences. It is necessary to evaluate the seismic safety for the potential earthquake hazard which can occur in the NPP sites. Four kinds of earthquake ground motions were used for the seismic fragility analysis of the containment building to consider the potential earthquake hazard.
In this study, the seismic safety of the KSNP containment building was evaluated by the seismic fragility analysis based on the nonlinear dynamic time-history analyses. The conventional seismic fragility analysis of the safety related structures in NPP have been performed by using the linear elastic analysis results for the seismic design. In this study, the displacement based seismic fragility analysis method was proposed and the results were compared with stress based fragility results.
2. Modeling of KSNP Containment Building
2.1 Analysis Model
A lumped mass model was developed for the nonlinear dynamic time history analysis. To verify the dynamic characteristics of the lumped mass model, the eigenvalue analysis of the KSNP containment building was performed by a three dimensional finite element model. The fundament frequencies of the containment building by 3-D FE model and lumped mass model were 4.481 Hz and 4.563 Hz, respectively. This result shows that the lumped mass model can be used to approximate the 3-D FE model for the nonlinear dynamic time history analysis.
2.2 Nonlinear Hysteretic Model
In this study, the tri-linear skeleton curves were used for the shear and moment behavior of the containment building. The turning points were determined based on the method proposed in the JEAG [3] and NUPEC [4]. In order to perform the elasto-plastic seismic response analysis based on the tri-linear skeleton curve, the maximum point oriented model (shear) and the degrading model (moment) were used as the hysteresis rules for the repeated unloading and loading processes.
3. Nonlinear Seismic Analysis
3.1 Input Ground Motions
Four kinds of input motions, artificial time histories that envelope the US NRC Regulatory Guide 1.60 spectrum, the probability based scenario earthquake [5], and several near-fault and far-field earthquake records, were used for the seismic fragility analyses.
3.2 Nonlinear Response
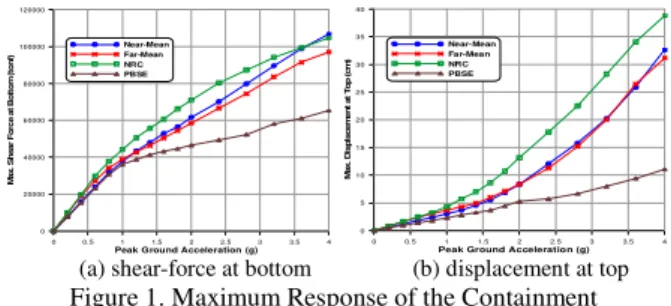
Figure 1 shows the shear force responses at the containment shell/base slab junction and the displacement responses at the top of the containment for the potential earthquake ground motions according to the increase of the PGA level up to 4.0g.
0 0.5 1 1.5 2 2.5 3 3.5 4
Peak Ground Acceleration (g)
0 40000 80000 120000 20000 60000 100000 M a x . S h e a r F o rc e a t B o tt o m ( to n f) Near-Mean Far-Mean NRC PBSE 0 0.5 1 1.5 2 2.5 3 3.5 4
Peak Ground Acceleration (g)
0 10 20 30 40 5 15 25 35 M a x . D is p la c e m e n t a t T o p ( c m ) Near-Mean Far-Mean NRC PBSE
(a) shear-force at bottom (b) displacement at top
Figure 1. Maximum Response of the Containment 4. Fragility Calculation
4.1 Fragility Calculation Method
The probability of a failure of a structure
f
P at any
non-exceedence probability level Q can be obtained from the following equation. + = − R U m m f Q C a S a P β φ β φ ln( ( )/ ) ( ) ) ( 1
(1)
where, φ(⋅) is the standard Gaussian cumulative distribution function, a is a peak ground acceleration as a ground motion parameter, 1()
⋅ −
φ is the inverse of the standard Gaussian cumulative distribution function,
) (a
Sm and C are the median seismic response at a given m
ground acceleration a , and the median seismic capacity, respectively, and βRand βUare the lognormal standard deviations of the randomness and uncertainty, respectively. Transactions of the Korean Nuclear Society Autumn Meeting
The median ground acceleration capacity can be obtained from the result of the nonlinear seismic response analyses. For a variate a which follows a log-normal distribution, the median response S and the log-normal standard m
deviation
a
β can be expressed by its mean
a
µ and the coefficient of a variation δa[6].
4.2 Failure Criteria
In the fragility analysis, it is very important to estimate various failure modes. In general, the ultimate shear stress and bending moment capacity at the lower part of the containment shell were used as the dominant failure modes of the containment structure. This conventional method was based on the results of the linear elastic seismic analysis performed in the design stage. In this study, the nonlinear seismic time history analyses for the various ground motions were performed to estimate the nonlinear behavior of the containment structure for the strong ground motions.
The top displacement and bottom shear-force were used as the damage index of the containment failure modes. The damage index was obtained from the results of the pushover analysis, which is performed with a static load condition to identify the yielding and ultimate displacement and shear-force of the containment shell. The yielding response means that a crack occurs in the containment shell. And the ultimate response is defined when the containment shell reaches a failure.
4.3 Fragility Curves
The yielding responses from the push over analysis were 2.13 cm and 35,514 ton for the displacement and shear-force, respectively. And the ultimate displacement and shear-force were 14.39 cm and 85,874 ton.
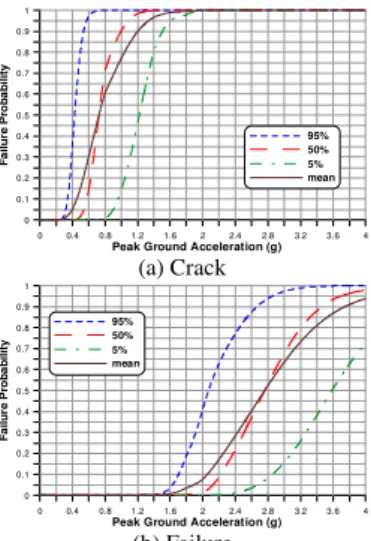
Table 1 shows the median and HCLPF (High Confidence of Low Probability of Failure) capacity for the various ground motions. The results mean that the displacement based seismic fragility analysis method is suitable for considering the nonlinear hysteretic seismic behavior of a concrete containment building. Figure 2 shows the fragility curves of the containment structure for the near-fault ground motions. Figure 2 (a) is a set of fragility curves for the yielding and (b) is a set of fragility curves for the failure of the containment shell.
Table 1. Median and HCLPF Capacity of Containment
Crack Failure HCLPF(g) Median(g) HCLPF(g) Median(g) Near 0.319 0.725 1.630 2.760 Far 0.177 0.565 1.522 2.765 NRC 0.318 0.600 1.305 2.111 Displace-ment PBSE 0.457 0.913 2.922 - Near 0.426 0.945 1.274 3.090 Far 0.267 0.970 1.231 3.432 NRC 0.396 0.772 1.085 2.713 Shear Force PBSE 0.453 1.117 1.728 - 0 0.4 0.8 1.2 1.6 2 2.4 2.8 3.2 3.6 4
Peak Ground Acceleration (g)
0 0.1 0.2 0.3 0.4 0.5 0.6 0.7 0.8 0.9 1 F a il u re P rob a b il it y 95% 50% 5% mean (a) Crack 0 0.4 0.8 1.2 1.6 2 2.4 2.8 3.2 3.6 4
Peak Ground Acceleration (g)
0 0.1 0.2 0.3 0.4 0.5 0.6 0.7 0.8 0.9 1 F a il u re P rob a b il it y 95% 50% 5% mean (b) Failure
Figure 2. Fragility Curves of the Containment Structure 5. Conclusion
The seismic behavior of the KSNP containment building shows distinct nonlinear behavior for the strong ground motion regardless of the input motions. The displacement based seismic fragility analysis is essential to estimate the seismic safety of the safety related structures considering the nonlinear hysteretic seismic behavior.
The near-fault ground motion which has a long period pulse like time history with very high peak velocities did not significantly affects the safety of the containment, since the containment building is a relatively stiff structure and has higher fundamental frequency than the dominant frequency of the near-fault ground motions.
ACKNOWLEDGEMENT
This research was supported by the Mid- and Long-Term Nuclear Research & Development Program of the Ministry of Science and Technology, Korea.
REFERENCES
[1] NRC, US NRC Regulatory Guide 1.60, Design Response Spectra for Seismic Design of Nuclear Power Plants, 1973. [2] KINS, Development of Seismic Safety Evaluation Technology for NPP Sites, KINS/GR-206, 2000.
[3] Y. J. Park, C. H. Hofmayer, Technical Guidelines for Aseismic Design of Nuclear Power Plants, Translation of JEAG 4601-1987, NUREG/CR-6241, 1994.
[4] A. Habasaki, Y. Kitada, T. Nrshikawa, K. Takiguchi, H. Torita, Multi-Axial Loading Test for RC Wall of Reactor Building, SMiRT-15, HO 3/3, Seoul, 1999.
[5] In-Kil Choi, Young-Sun Choun, and Jeong-Moon Seo, Scenario Earthquakes for Korean Nuclear Power Plant Site Considering Active Faults, SMiRT-17, Prague, Czech Republic, August17-22, 2003.
[6] ZH-S Ang, W. H. Tang, Probability Concepts in Engineering Planning and Design, Basic Principles, Vol. 1, Wiley, New York, 1975.