pISSN 2005-9159 eISSN 2093-0569
INTRODUCTION
The iliotibial band (ITB) is a dense fibrotic anatomic
struc-ture, originating in the iliac tubercle, and extending to the lateral aspect of the thigh, where the gluteus maximus, gluteus medius muscles, and fascia latae tensor insert, and
Clinical Research Article
This is an open-access article distributed under the terms of the Creative Commons Attribution Non-Commercial License (http://cre-ativecommons.org/licenses/by-nc/4.0/), which permits unrestricted non-commercial use, distribution, and reproduction in any medium, provided the original work is properly cited.
© The Korean Pain Society, 2021
Author contributions: Jiyeon Park: Writing/manuscript preparation; Hyung Rae Cho: Writing/manuscript preparation; Keum Nae Kang: Writ-ing/manuscript preparation; Kun Woong Choi: WritWrit-ing/manuscript prepa-ration; Young Soon Choi: Data cuprepa-ration; Hye-Won Jeong: Methodology; Jungmin Yi: Computation; Young Uk Kim: Study conception.
The role of the iliotibial band cross-sectional area as
a morphological parameter of the iliotibial band friction syndrome:
a retrospective pilot study
Jiyeon Park1,*, Hyung Rae Cho2,*, Keum Nae Kang3, Kun Woong Choi3, Young Soon Choi1, Hye-Won Jeong1,
Jungmin Yi1, and Young Uk Kim1
1Department of Anesthesiology and Pain Medicine, International St. Mary’s Hospital, Catholic Kwandong University College of Medicine, Incheon,
Korea
2Department of Anesthesiology and Pain Medicine, Myongji Hospital, Hanyang University College of Medicine, Goyang, Korea 3Department of Anesthesiology and Pain Medicine, National Police Hospital, Seoul, Korea
Received October 19, 2020 Revised December 16, 2020 Accepted January 7, 2021
Handling Editor: Francis S. Nahm
Correspondence
Young Uk Kim
Department of Anesthesiology and Pain Medicine, International St. Mary’s Hospital, Catholic Kwandong University College of Medicine, 25 Simgok-ro 100beon-gil, Seo-gu, Incheon 22711, Korea
Tel: +82-32-290-3570 Fax: +82-32-290-3568 E-mail: [email protected]
*These authors contributed equally to this work.
Background: Iliotibial band friction syndrome (ITBFS) is a common disorder of the lateral knee. Previous research has reported that the iliotibial band (ITB) thickness (ITBT) is correlated with ITBFS, and ITBT has been considered to be a key morpho-logic parameter of ITBFS. However, the thickness is different from inflammatory hy-pertrophy. Thus, we made the ITB cross-sectional area (ITBCSA) a new morphologi-cal parameter to assess ITBFS.
Methods: Forty-three patients with ITBFS group and from 43 normal group who underwent T1W magnetic resonance imaging were enrolled. The ITBCSA was mea-sured as the cross-sectional area of the ITB that was most hypertrophied in the magnetic resonance axial images. The ITBT was measured as the thickest site of ITB.
Results: The mean ITBCSA was 25.24 ± 6.59 mm2 in the normal group and 38.75
± 9.11 mm2 in the ITBFS group. The mean ITBT was 1.94 ± 0.41 mm in the normal
group and 2.62 ± 0.46 mm in the ITBFS group. Patients in ITBFS group had signifi-cantly higher ITBCSA (P < 0.001) and ITBT (P < 0.001) than the normal group. A receiver operator characteristic curve analysis demonstrated that the best cut-off value of the ITBT was 2.29 mm, with 76.7% sensitivity, 79.1% specificity, and area under the curve (AUC) 0.88. The optimal cut-off score of the ITBCSA was 30.66 mm2, with 79.1% sensitivity, 79.1% specificity, and AUC 0.87.
Conclusions: ITBCSA is a new and sensitive morphological parameter for diagnos-ing ITBFS, and may even be more accurate than ITBT.
Key Words: Anatomy, Cross-Sectional; Cumulative Trauma Disorders; Diagnosis; Fascia Lata; Friction; Hypertrophy; Iliotibial Band Syndrome; Knee Injuries; Magnetic Resonance Imaging; ROC Curve; Sensitivity and Specificity.
contributing to the monopodal equilibrium and postural control [1,2]. ITB lesions are frequently confused with pathologic conditions which cause discomfort on the lat-eral aspect of the knee, thigh, and hip. Iliotibial band fric-tion syndrome (ITBFS) involves discomfort in the locafric-tion of the lateral femoral condyle, that occurs after repetitive mechanical friction of the knee, typically in an athlete such as a runner or cyclist [3,4].
A diagnosis is typically made based on the physical ex-amination and case history, even though in a few cases magnetic resonance imaging (MRI) might be indicated to rule out another disease in the location [5,6]. An important positive sign on physical examination is local tenderness superior to the joint line and lateral knee inferior to the epicondyle. Flato et al. [1] have insisted that MRI find-ings in ITBFS mean increased signal intensity with fluid sequences both deep and superficial to the iliotibial (IT) tract origin, representing an edematous signal about the IT tract enthesis. MRI can also demonstrate partial tear-ing (intrinsic hyperintense signal) and thickentear-ing of the proximal IT tract attachments [1]. Ultrasonography (US) is an accurate, rapid, and widely available image modality capable of evaluating a wide spectrum of ITB alterations. Previous studies assessed the ITB thickness (ITBT) using a measurement at the approximate “halfway” point of the ITB [3]. However, an asymmetrical tear and partial thick-ening of the ITB can occur at any time [5]. Thus, measure-ment mistakes could occur routinely. In contrast to the ITBT, measuring a cross-sectional area of the ITB does not risk such measurement mistakes because the ITB cross-sectional area (ITBCSA) measures a cross-cross-sectional area of the whole ITB.
Therefore, to assess the hypertrophy of the whole ITB, we devised the ITBCSA as a new morphological imaging parameter. We assumed that the ITBCSA would be an excellent morphological imaging parameter for hypertro-phied ITB. Thus, we used the knee MRI to compare the ITBCSA and ITBT between ITBFS patients and normal in-dividuals.
MATERIALS AND METHODS
1. Patients
The Catholic Kwandong University institutional review board (IRB) approved this retrospective research protocol and waived the informed consent requirement (IRB ap-proval number : IS20RISI0073). We performed a retrospec-tive pilot study to investigate the role of the ITBCSA as a morphological parameter of the ITBFS. We reviewed IT-BFS patients who visited International St. Mary’s Hospital with knee pain from April 2014 to April 2020, and who had undergone knee MRI within 6 months of the first visit.
The inclusion criteria of ITBFS group were as follows [7,8]: 1) tenderness on palpation of the lateral knee ap-proximately 2-3 cm above the join line; 2) typically local-ized pain just above the lateral part of the knee; 3) swelling of the outside of the knee; 4) knee pain during flexing the knee to thirty degrees; 5) gradual onset of symptoms and signs which, if they persisted for more than 1 month, could cause interference in daily activities or in sports participa-tion; 6) knee pain that worsens with repetitive activities or continuing to participate in running. We excluded patients if they had any of the following problems: 1) history of knee surgery; 2) osteosarcoma; 3) history of the femur or the tib-ial surgery; and 4) meniscus or lateral collateral ligament injury. Forty-three patients were enrolled. There were 21 (60.4%) males and 22 (39.6%) females with an average age of 47.5 ± 17.3 years (range, 16 to 66 yr) (Table 1). To
com-pare the ITBCSA and ITBT between patients and normal individuals, we also enrolled a healthy group. The normal group was people who had a knee MRI examination due to knee discomfort, however, no structural problems were found in the MRI. In the normal group, 43 individuals (21 males and 22 females) were enrolled with an average age of 47.6 ± 14.3 years (range, 15 to 68 yr).
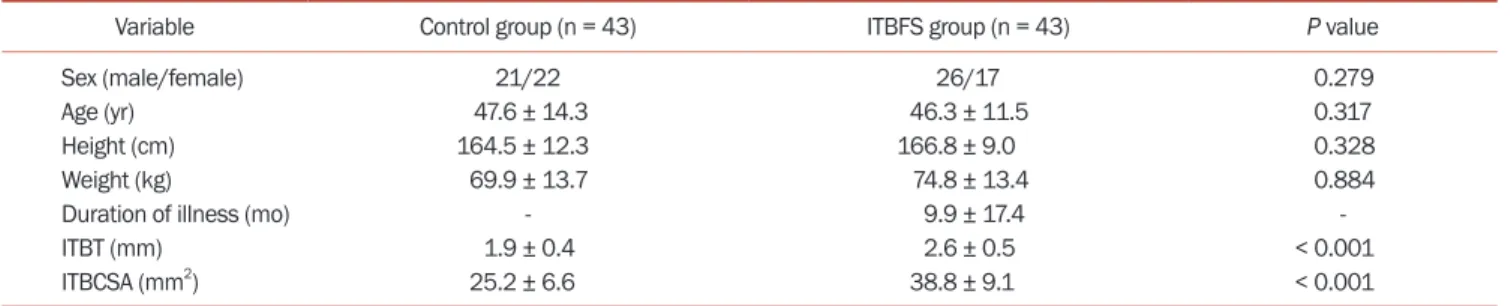
Table 1. Comparison of the characteristics of control and ITBFS groups
Variable Control group (n = 43) ITBFS group (n = 43) P value
Sex (male/female) 21/22 26/17 0.279
Age (yr) 47.6 ± 14.3 46.3 ± 11.5 0.317
Height (cm) 164.5 ± 12.3 166.8 ± 9.0 0.328
Weight (kg) 69.9 ± 13.7 74.8 ± 13.4 0.884
Duration of illness (mo) - 9.9 ± 17.4
-ITBT (mm) 1.9 ± 0.4 2.6 ± 0.5 < 0.001
ITBCSA (mm2) 25.2 ± 6.6 38.8 ± 9.1 < 0.001
Values are presented as number only or mean ± standard deviation.
2. Imaging parameters
Magnetom Skyra MRI analysis was done using a 3.0-T MRI (Siemens Healthcare GmbH, Erlangen, Germany) and 3.0T Ingenia scanners (Philips, Eindhoven, The Netherlands). Knee MRI examinations performed in standard supine position under non-weight-bearing conditions. For all MRI examinations, we acquired coronal and axial T1W images with a slice thickness of 3.0 mm, intersection gap of 0.9 mm, repetition time/echo time of 492 ms/15 ms, 160 × 160 cm field of view, 320 × 316 pixels of scanning matrix, and > 3 echo train length.
3. Image analysis
ITBCSA and ITBT measurements were performed by the same specialist. All images were reviewed blindly. We ac-quired axial T1W magnetic resonance images at the thick-est visualization of the ITB. We measured the ITBCSA and ITBT on MRI using an image analysis system (INFINITT PACS; INFINITT Healthcare, Seoul, Korea) (Fig. 1). The
ITBCSA was measured as the tendon cross-sectional area of the ITB at the thickest point. The cross-sectional area is automatically presented by the “Measure area free hand” tool in INFINITT PACS after drawing a line along the bor-der of the ITB. The ITBT was measured at the most hyper-trophied ITB.
4. Statistical analysis
We compared the ITBCSA and ITBT between the ITBFS and the control groups using independent t-tests. The va-lidity of the ITBCSA and ITBT in the diagnosis of hypertro-phy was measured by the receiver operator characteristic (ROC) curve with the area under the curve (AUC)-index. A probability value under 0.05 was considered statistically significant. All analyses were processed by using SPSS
software, version 22.0 (IBM Co., Armonk, NY).
RESULTS
The mean ITBCSA was 25.2 ± 6.6 mm2 in the normal group and 38.8 ± 9.1 mm2 in the ITBFS group. The mean ITBT was 1.9 ± 0.4 mm in the normal group and 2.6 ± 0.5 mm in the ITBFS group. Patients in ITBFS group had significantly higher ITBCSA (P < 0.001) and ITBT (P < 0.001) than the normal group (Table 1). A ROC curve analysis
demonstrat-ed that the most suitable cut-off value of the ITBT was 2.29 mm, with 76.7% sensitivity and 79.1% specificity. The AUC of the parametric ROC curve was 0.88 (95% confidence interval [CI], 0.81-0.95) (Fig. 2, Table 2). The most suitable
ITBT = 2.70 mm
A B
ITBCSA = 15.23 mm2
Fig. 1. Measurement of both iliotibial band thickness (ITBT) (white ar-row) (A) and iliotibial band cross-sectional area (ITBCSA) (white arar-row) (B) in the iliotibial band friction syndrome group was carried out on magnetic resonance T1 weighted images.
Table 2. Sensitivity and specificity of each cut-off point of the ITBT ITBT (mm) Sensitivity (%) Specificity (%)
1.21 100.0 4.7 1.70 97.7 32.6 1.82 97.7 39.5 2.03 93.0 60.5 2.17 83.7 69.8 2.29a 76.7 79.1 2.41 69.8 83.7 2.53 55.8 93.0 2.77 34.9 97.7 2.82 32.6 100.0
ITBT: iliotibial band thickness.
aThe optimal cut-off score on the receiver operating characteristic curve.
0 0.2 0.4 0.6 0.8 1.0 0.8 0.6 0.4 0.2 1.0 Sensitivity 1-Specificity 0 ITBT ITBCSA Reference line ITBCSA: 30.66 mm Sensitivity 79.1% Specificity 79.1% 2 ITBT: 2.29 mm Sensitivity 76.7% Specificity 79.1%
Fig. 2. Receiver operating characteristic (ROC) curve of iliotibial band thickness (ITBT) and iliotibial band cross-sectional area (ITBCSA) for prediction of iliotibial band friction syndrome (ITBFS). The best cut off point of ITBT was 2.29 mm versus 30.66 mm2 of ITBCSA, with sensitivity
76.7% vs. 79.1%, specificity 79.1% vs. 79.1% and AUC 0.87 vs. 0.88, re-spectively. ITBT area under the curve (AUC) (95% confidence interval [CI]) = 0.87 (0.80-0.94), ITBCSA AUC (95% CI) = 0.88 (0.81-0.95).
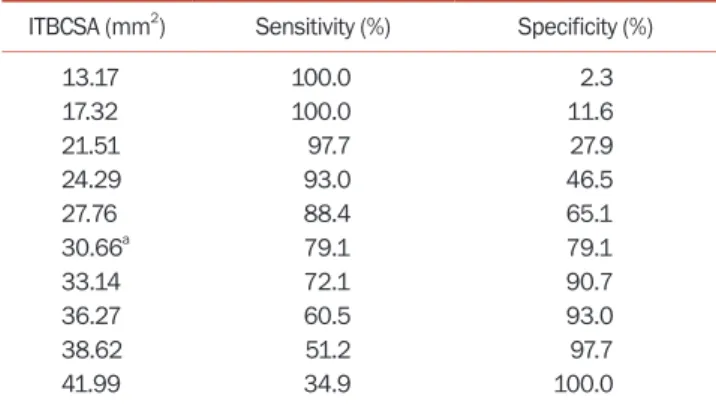
cut-off score for the ITBCSA was 30.66 mm2, with 79.1% sensitivity and 79.1% specificity, and the AUC index was 0.87 (95% CI, 0.80-0.94) (Fig. 2, Table 3).
DISCUSSION
ITBFS is a very common overuse soft-tissue trauma of the knee that occurs as a result of mechanical repetitive injury [9-11]. The ITB is a thick fascia strip that originates from the iliac crest tubercle, continues to the lateral side of the thigh, and inserts into the lateral proximal fibular head and into the lateral tibial condyle [1]. ITBFS generates when friction occurs between the underlying lateral femo-ral epicondyle and the posterior edge of the ITB. When the knee is extended, the ITB moves anterior to this landmark; however, when the knee is flexed to an angle greater than thirty degrees, the ITB lies posterior to the lateral femoral epicondyle. Thus, friction occurs at slightly less than thirty degrees of knee flexion, when the ITB crosses over the lat-eral femoral epicondyle. The cumulative effect of mechan-ical friction causes an inflammatory disorder within the periosteum of the lateral femoral epicondyle, underlying bursa, and iliotibial tract, eventually inducing lateral knee pain [11-15]. However, several other diseases may also be observed in this area, both distally and proximally in rela-tion to the usually affected locarela-tion in the lateral knee [13]. Thus, exact diagnosis is very important.
Various diagnostic imaging technique, such as US, MRI, radiography, stress radiography, and computed tomogra-phy are available [3,6], however, the diagnosis of ITBFS is still not easy due to the lack of an exact morphological im-age parameter. The process of ITB thickening starts with continuous mechanical stress, which induces inflamma-tion, structural damage, and finally thickening [2,16,17].
We assumed that the cross-sectional area of the ITB can
predict hypertrophy of the ITB because the ITBCSA does not suffer from this measurement mistake since the IT-BCSA measures the cross-sectional area of the whole ITB, in contrast to the ITBT [18]. We eventually concluded that the ITBCSA is better than the ITBT as a morphological im-age parameter of ITBFS. In this research, we found that the ITBCSA had 79.1% sensitivity and 79.1% specificity. The AUC-index for the ROC curve was 0.88 (95% CI, 0.81-0.95) to predict ITBFS. In contrast, the ITBT had 76.7% sensitiv-ity and 79.1% specificsensitiv-ity. The AUC-index for the ROC curve was 0.87 (95% CI, 0.80-0.94). These results show that the ITBCSA is a better morphological predictor of ITBFS than the ITBT. To our knowledge, this is the first research eval-uating the accuracy of ITBCSA in the diagnosis of ITBFS.
There are some limitations to the current research. First, alternative image modalities to assess ITBFS, such as US and radiography, have been proved to be effective at di-agnosing ITBFS [3]. Especially, US is a rapid, and widely available image modality [19-22]. However, the current study only evaluated the measurement of the ITBCSA and ITBT on MRI. Second, the small sample size may have lim-ited our conclusion to detect statistically meaningful dif-ferences. Third, ITBFS has multiple causes, including the swelling of the bursa, bowed legs, and alteration in activity levels. However, we only focused on ITBT and the ITBCSA. Fourth, this research is retrospective in nature.
In conclusion, ITBCSA is a new and sensitive morpho-logical parameter for diagnosing ITBFS, and may even be more accurate than ITBT. When evaluating the ITBFS in patients with recurrent knee pain, physicians should care-fully assess the ITBCSA rather than the ITBT. ITBCSA may be a new objective indicator of ITBFS.
CONFLICT OF INTEREST
No potential conflict of interest relevant to this article was reported.
FUNDING
No funding to declare.
ORCID
Jiyeon Park, https://orcid.org/0000-0002-1727-2411 Hyung Rae Cho, https://orcid.org/0000-0003-1634-7482 Keum Nae Kang, https://orcid.org/0000-0002-1135-6403 Kun Woong Choi, https://orcid.org/0000-0002-3880-304X Young Soon Choi, https://orcid.org/0000-0002-3819-0271
Table 3. Sensitivity and specificity of each cut-off point of the ITBCSA ITBCSA (mm2) Sensitivity (%) Specificity (%)
13.17 100.0 2.3 17.32 100.0 11.6 21.51 97.7 27.9 24.29 93.0 46.5 27.76 88.4 65.1 30.66a 79.1 79.1 33.14 72.1 90.7 36.27 60.5 93.0 38.62 51.2 97.7 41.99 34.9 100.0
ITBCSA: iliotibial band cross-sectional area.
Hye-Won Jeong, https://orcid.org/0000-0002-8286-5715 Jungmin Yi, https://orcid.org/0000-0003-4481-8923 Young Uk Kim, https://orcid.org/0000-0003-4977-5272
REFERENCES
1. Flato R, Passanante GJ, Skalski MR, Patel DB, White EA, Matcuk GR Jr. The iliotibial tract: imaging, anatomy, injuries, and other pathology. Skeletal Radiol 2017; 46: 605-22. 2. Hadeed A, Tapscott DC. Iliotibial band friction syndrome
[Internet]. Treasure Island (FL): StatPearls Publishing; 2020. Available at: https://www.ncbi.nlm.nih.gov/books/ NBK542185/.
3. Hong JH, Kim JS. Diagnosis of iliotibial band friction syn-drome and ultrasound guided steroid injection. Korean J Pain 2013; 26: 387-91.
4. Lavine R. Iliotibial band friction syndrome. Curr Rev Mus-culoskelet Med 2010; 3: 18-22.
5. Lee S, Cho HR, Yoo JS, Kim YU. The prognostic value of me-dian nerve thickness in diagnosing carpal tunnel syndrome using magnetic resonance imaging: a pilot study. Korean J Pain 2020; 33: 54-9.
6. Yan R, Huang Z, Wang L, Zhang X. [MR manifestations and clinical significance of iliotibial band friction syndrome]. Zhonghua Yi Xue Za Zhi 2014; 94: 1473-5. Chinese.
7. Khaund R, Flynn SH. Iliotibial band syndrome: a common source of knee pain. Am Fam Physician 2005; 71: 1545-50. 8. Strauss EJ, Kim S, Calcei JG, Park D. Iliotibial band
syn-drome: evaluation and management. J Am Acad Orthop Surg 2011; 19: 728-36.
9. Rathore S, Quadri V, Tapadia S, Krishnaiah K, Krishna VPN. Intra-articular fibroma of tendon sheath in knee joint associ-ated with iliotibial band friction syndrome: rare occurrence in a teenage girl. J Orthop Case Rep 2017; 7: 28-31.
10. Takagi K, Inui H, Taketomi S, Yamagami R, Kono K, Naka-zato K, et al. Iliotibial band friction syndrome after knee ar-throplasty. Knee 2020; 27: 263-73.
11. Walbron P, Jacquot A, Geoffroy JM, Sirveaux F, Molé D. Il-iotibial band friction syndrome: an original technique of digastric release of the iliotibial band from Gerdy’s tubercle. Orthop Traumatol Surg Res 2018; 104: 1209-13.
12. Decker G, Hunt D. Proximal iliotibial band syndrome in a runner: a case report. PM R 2019; 11: 206-9.
13. Everhart JS, Kirven JC, Higgins J, Hair A, Chaudhari AAMW, Flanigan DC. The relationship between lateral epicon-dyle morphology and iliotibial band friction syndrome: a matched case-control study. Knee 2019; 26: 1198-203. 14. Foch E, Milner CE. Influence of previous iliotibial band
syn-drome on coordination patterns and coordination variability in female runners. J Appl Biomech 2019; 35: 305-11.
15. Landreau P, Catteeuw A, Hamie F, Saithna A, Sonnery-Cottet B, Smigielski R. Anatomic study and reanalysis of the nomenclature of the anterolateral complex of the knee focusing on the distal iliotibial band: identification and de-scription of the condylar strap. Orthop J Sports Med 2019; 7: 2325967118818064.
16. Pegrum J, Self A, Hall N. Iliotibial band syndrome. BMJ 2019; 364: l980.
17. Everhart JS, Kirven JC, Higgins J, Hair A, Chaudhari AMW, Flanigan DC. Corrigendum to “The relationship between lateral epicondyle morphology and iliotibial band friction syndrome: A matched case-control study [The Knee 26 (2019) 1198-1203]”. Knee 2020; 27: 1291.
18. Joo Y, Cho HR, Kim YU. Evaluation of the cross-sectional area of acromion process for shoulder impingement syn-drome. Korean J Pain 2020; 33: 60-5.
19. Gadsden JC, Sata S, Bullock WM, Kumar AH, Grant SA, Dool-ey JR. The relative analgesic value of a femoral nerve block versus adductor canal block following total knee arthroplas-ty: a randomized, controlled, double-blinded study. Korean J Anesthesiol 2020; 73: 417-24.
20. Ciftci B, Ekinci M, Atalay YO. Ultrasound guided rhomboid intercostal block provides effective pain control after video-assisted thoracoscopic surgery: a brief report of three cases. Korean J Anesthesiol 2020. doi: 10.4097/kja.20538.
21. Abdelbaser I, Mageed NA, El-Emam EM, ALseoudy MM, Elmorsy MM. Preemptive analgesic efficacy of ultrasound-guided transversalis fascia plane block in children undergo-ing undergo-inguinal herniorrhaphy: a randomized, double-blind, controlled study. Korean J Anesthesiol 2020. doi: 10.4097/ kja.20601.
22. Mudumbai SC, Kim TE, Howard SK, Giori NJ, Woolson S, Ganaway T, et al. Corrigendum: an ultrasound-guided fascia iliaca catheter technique does not impair ambulatory ability within a clinical pathway for total hip arthroplasty. Korean J Anesthesiol 2020; 73: 267.