Myung In An1, Kwang Wook An1 & Cheol Young Choi1
1Division of Marine Environment & BioScience, Korea Maritime University, Busan 606-791, Korea
Correspondence and requests for materials should be addressed to C. Y. Choi ([email protected])
Accepted 13 November 2009
Abstract
Cadmium (Cd) and tributyltin (TBT) are common con-taminants of marine and freshwater ecosystems, and can induce the formation of reactive oxygen species (ROS). These ROS can, in turn, cause oxidative stress. In the present study, we investigated time-related effects of Cd (0.05 and 0.1 ppm) and TBT (5 and 10 ppb) treatment on antioxidant enzyme activity, i.e., the activity of superoxide dismutase (SOD) and cata-lase (CAT) in the gills and digestive glands of the ark shell, Scapharca broughtonii. In addition, hydrogen peroxide (H2O2) concentrations, lysozyme activity,
and glutamate oxaloacetate transaminase (GOT) and glutamate pyruvate transaminase (GPT) levels were measured in the hemolymph. We found that Cd and TBT treatment significantly increased antioxidant enzyme mRNA expression and activity in the diges-tive glands and gills in a time-dependent manner. In response to the Cd and TBT treatments, antioxidant enzymes mRNA expression and activity increased up to day 5 in the digestive glands and then decreased by day 7. In the gills, antioxidant enzymes mRNA ex-pression and activity increased up to day 3 and then decreased by day 5. Likewise, H2O2 concentrations
significantly increased up to day 5 and then decreas-ed by day 7. Finally, lysozyme activity decreasdecreas-ed during the experimental period, whereas GOT and GPT levels were significantly increased in a time-dependent manner. These results suggest that anti-oxidant enzymes play an important role in decreas-ing ROS levels and oxidative stress in ark shells ex-posed to Cd and TBT.
Keywords: Ark shell, Cd, TBT, Antioxidant enzyme, H2O2,
Lysozyme
Increasing amounts and varieties of organic and inorganic compounds, chemicals, and heavy metals are entering the aquatic environment and, as a result, are being sequestered in the tissues of aquatic organ-isms. Bivalve mollusks are especially susceptible to contamination within their respective habitats because of poor mobility as compared with other aquatic spe-cies (e.g., fish). Because bivalve mollusks feed via gill filtration, a large amount of contaminants can be ab-sorbed from the environment and may accumulate in the body1.
Heavy metals such as cadmium (Cd), lead (Pb), and hydrargyrum (Hg) enter the aquatic environment as a result of human activities such as wastewater produc-tion, agriculture and mining. These contaminants can be toxic to aquatic organisms even very small amounts and accumulate within the bodies of aquatic organ-isms. Specially, Cd has adverse physiological effects on the growth, reproduction, and osmoregulation of aquatic organisms2. Cd accumulates within organis-mal tissues and can alter and degrade enzymatic pro-cesses and cause cell damage, which may result in cell death3. In addition, Cd induces oxidization and gener-ates reactive oxygen species (ROS) that promote oxi-dative damage4.
Tributyltin (TBT), an organic compound containing tin, is a highly toxic environmental pollutant that is present in agents that counteract marine biological adhesion5. Due to its widespread use as an antifouling agent in boat paints, TBT is a common contaminant of marine and freshwater ecosystems. TBT affects all types of aquatic organisms, in addition to those that adhere to surfaces6. Many countries have banned the use of organotin-based antifouling paints due to their toxic, persistent, bioaccumulative, and endocrine dis-ruptive characteristics6. In particular, mollusks easily accumulate TBT6. Accumulated TBT has been demon-strated to cause impairments in growth, development, and reproduction, enzyme inhibition, reductions or
Changes in Antioxidant Enzyme Activity and Physiological
Responses to Cadmium and Tributyltin Exposure in the Ark
Shell, Scapharca Broughtonii
alterations in protein and DNA synthesis, cytoskeletal alterations, and disruptions in ATP synthesis7. In addi-tion, Huang et al.8reported that TBT exposure gener-ates ROS production and oxidative stress in the Asiatic hard clam, Meretrix meretrix.
To maintain homeostasis and prevent oxidative stress caused by heavy metals and other toxic substances, living organisms have evolved antioxidant defense mechanisms9. These systems include both enzymatic and non-enzymatic components9. Antioxidant enzymes include superoxide dismutase (SOD), catalase (CAT), glutathione peroxidase (GPX), and glutathione S-trans-ferase (GST). Low molecular weight antioxidant mate-rials include glutathione (GSH), ascorbic acid, metal-lothionein (MT), and α-tocopherol10.
SOD and CAT directly inactivate ROS such as super-oxide anion (O2∙-) and hydrogen peroxide (H2O2). Thus, these antioxidant enzyme activities are used as a mark-er involved in the primary defense against oxidative damage. SOD is a defense element against ROS and removes the O2∙-through the process of dismutation to singlet oxygen (O2) and H2O2(2O2∙-++H++→ H2O2++ O2)11. As a metalloenzyme, SOD is generally classified into copper/zinc-SOD (Cu/Zn-SOD), manganese-SOD (Mn-SOD), and iron-SOD (Fe-SOD) based on which metals are bonded to the active sites of the enzyme12. Previous studies on SOD activity have examined benzo [a]pyrene exposure in the blood clam, Scapharca
inae-quivalvisdisk13, and polychlorobiphenyls (PCBs) and
heavy metal exposure in the freshwater mussel,
Dreis-sena polymorpha14.
H2O2 produced by SOD is sequentially reduced to H2O and O2by CAT15. CAT is an oxidoreductase en-zyme that breaks down two molecules of H2O2to two molecules of H2O and O2(2H2O2→ 2H2O++O2), there-fore counteracting the toxicity of H2O211. Previous studies on CAT activity have investigated polycyclic aromatic hydrocarbon (PAHs) and organochlorine pesticide exposure in the green-lipped mussels, Perna
viridis16, and PCB and heavy metal exposure in the
freshwater mussel14.
In bivalves, hemolymph involves in defense mech-anisms. Among the hemolymph constituents, lysozyme enzyme participates in inactivation of invading mic-robes and is generally affected by environmental stress (e.g., heavy metals and organic compounds)17,18. Also, GOT and GPT are caused by the inflow of cells into the hemolymph due to tissue damage by environmen-tal contaminants4.
Therefore, we quantified changes in H2O2 concen-trations, lysozyme activity, glutamate oxaloacetate transaminase (GOT) and glutamate pyruvate transami-nase (GPT) levels in hemolymph, as well as changes in the activity and mRNA expression of antioxidant
enzymes (SOD and CAT) by exposure of Cd and TBT. The goal of this study was to identify the antioxidant mechanisms and physiological responses of the ark shell, Scapharca broughtonii, to Cd and TBT exposure. Expression Levels of Antioxidant Enzymes Cd Treatments
Expression levels of antioxidant enzymes during Cd exposure were shown in Figure 1. In the gills, SOD mRNA expression increased with time and reached a
a a a a b b b b b a cd cd d c b 0 10 20 30 40 Control 0.05 ppm 0.1 ppm a a a
Normalized fold expression
Normalized fold expression
Normalized fold expression
Normalized fold expression
(A) a a a a a b b b b b a a a d cd bc bcd ab 0 20 40 60 80 (B) a a a a a b cd cd c d d c bc bc b a a a 0 10 20 30 40 (C) a a a a a a b b b ab ab a b b c b b a 0 0 1 3 5 7 9 10 20 30 40 (D)
Time after Cd treatment (d)
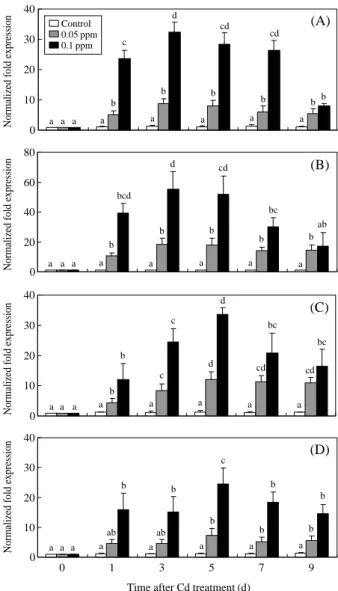
Figure 1. In the gills, SOD (A) and CAT (B) mRNA
expres-sion of ark shells treated with 0.05 and 0.1 ppm Cd for 1, 3, 5, 7, and 9 days. In the digestive glands, SOD (C) and CAT (D) mRNA expression of ark shells treated with 0.05 and 0.1 ppm Cd for 1, 3, 5, 7, and 9 days. Values in the same experi-mental group with dissimilar letters are significantly different (P⁄0.05) from each other. Values are expressed as means±
peak after 3 days of exposure to 0.05 ppm Cd (8.8-fold higher than the control) and 0.1 ppm Cd (32.4-fold higher than the control) and then decreased (Figure 1A). CAT mRNA expression increased with time and peaked after 3 days of exposure to 0.05 ppm Cd (18.2-fold higher than the control) and 0.1 ppm Cd (55.4-fold higher than the control) and then decreased (Fig-ure 1B). In the digestive glands, SOD mRNA expres-sion increased with time and reached a peak after 5 days of exposure to 0.05 ppm Cd (12.0-fold higher
than the control) and 0.1 ppm Cd (33.6-fold higher than the control) and then decreased (Figure 1C). CAT mRNA expression increased with time and peaked after 5 days of exposure to 0.05 ppm Cd (7.2-fold high-er than the control) and 0.1 ppm Cd (24.5-fold highhigh-er than the control) and then decreased (Figure 1D). Expression Levels of Antioxidant Enzymes TBT Treatments
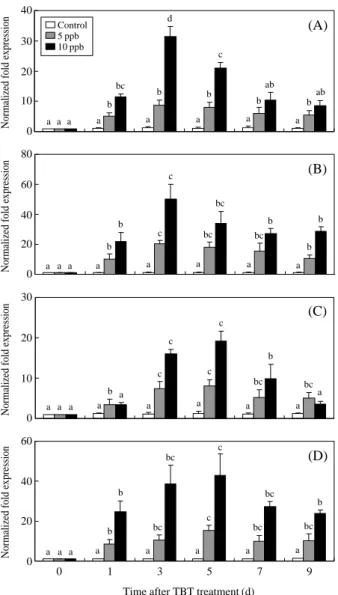
Expression levels of antioxidant enzymes during TBT exposure were shown in Figure 2. In the gills, SOD mRNA expression increased with time and reach-ed a peak after 3 days of exposure to 5 ppb TBT (8.8-fold higher than the control) and 10 ppb TBT (31.4-fold higher than the control) and then decreased (Fig-ure 2A). CAT mRNA expression increased with time and peaked after 3 days of exposure to 5 ppb TBT (20.4-fold higher than the control) and 10 ppb TBT (50.1-fold higher than the control) and then decreased (Figure 2B). In the digestive glands, SOD mRNA ex-pression increased with time and reached a peak after 5 days of exposure to 5 ppb TBT (8.0-fold higher than the control) and 10 ppb TBT (19.2-fold higher than the control) and then decreased (Figure 2C). CAT mRNA expression increased with time and peaked after 5 days of exposure to 5 ppb TBT (15.4-fold high-er than the control) and 10 ppb TBT (43.1-fold highhigh-er than the control) and then decreased (Figure 2D). Activity of Antioxidant Enzymes Cd Treatments
SOD and CAT activities were measured in tissue homogenates of the gills and digestive glands. In the gills, SOD activity showed a significant increase after 3 days of exposure to 0.05 ppm Cd (1.5±0.1 U/mL) and 0.1 ppm Cd (2.1±0.1 U/mL) and then subsequent-ly decreased (Figure 3A). CAT activity increased with time and peaked after 3 days of exposure to 0.1 ppm Cd (23.7±1.2 nM/min/mL); there was no change in CAT activity after exposure to 0.05 ppm (Figure 3B). In the digestive glands, SOD activity significantly increased after 5 days of exposure to 0.05 ppm Cd (1.1±0.1 U/mL) and 0.1 ppm Cd (2.1±0.1 U/mL) and then decreased (Figure 3C). CAT activity increas-ed with time and peakincreas-ed after 5 days of exposure to 0.1 ppm Cd (25.7±1.2 nM/min/mL); there was no change in CAT activity after exposure to 0.05 ppm (Figure 3D).
Activity of Antioxidant Enzymes TBT Treatments
SOD and CAT activities were measured in tissue homogenates of the gills and digestive glands. In the gills, SOD activity significantly increased after 3 days
Time after TBT treatment (d)
a a a a a b b b b b c ab ab bc d a a a 0 10 20 30 40 (A) (C) (D) (B) a a a a a a c bc bc b b a c bc b b b a 0 20 40 60 80 a a a a a c c bc bc b a c c b a a a a 0 10 20 30 a a a a a a a a c bc bc bc b b b bc bc c 0 20 40 60 3 0 1 5 7 9
Normalized fold expression
Normalized fold expression
Normalized fold expression
Normalized fold expression
Control 5 ppb 10 ppb
Figure 2. In the gills, SOD (A) and CAT (B) mRNA
expres-sion of ark shells treated with 5 and 10 ppb TBT for 1, 3, 5, 7, and 9 days. In the digestive glands, SOD (C) and CAT (D) mRNA expression of ark shells treated with 5 and 10 ppb TBT for 1, 3, 5, 7, and 9 days. Values in the same experimen-tal group with dissimilar letters are significantly different (P⁄0.05) from each other. Values are expressed as means±
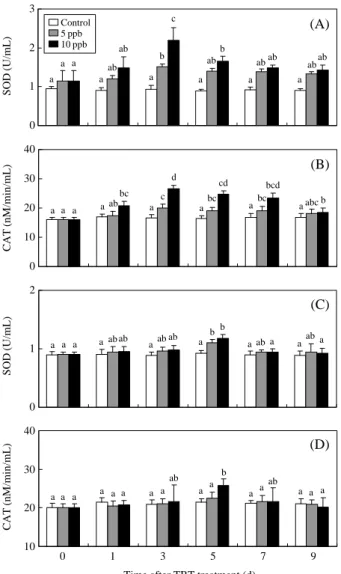
of exposure to 5 ppb TBT (1.5±0.1 U/mL) and 10 ppb TBT (2.2±0.3 U/mL) and then decreased (Figure 4A). CAT activity increased with time and peaked after 3 days of exposure to 5 ppb TBT (20.0±1.2 nM/min/ mL) and 10 ppb TBT (26.6±1.2 nM/min/mL; Figure 4B). In the digestive glands, SOD activity significant-ly increased after 5 days of exposure to 5 ppb TBT (1.1±0.1 U/mL) and 10 ppb TBT (1.2±0.1 U/mL) and then decreased (Figure 4C). CAT activity increas-ed with time and peakincreas-ed after 5 days of exposure to 10 ppb TBT (25.8±1.7 nM/min/mL); there was no change in CAT activity after exposure to 5 ppb (Figure 4D).
H2O2Concentrations
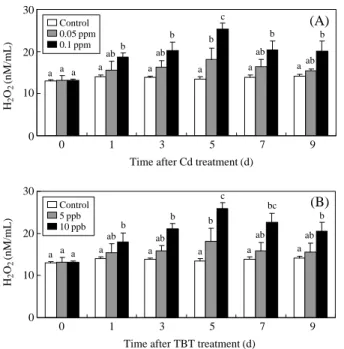
Hemolymph H2O2 concentrations significantly in-creased following Cd and TBT treatment in a dose-and time-dependent manner. H2O2 concentrations in-creased with time and peaked after 5 days of exposure to 0.05 ppm Cd (18.2±2.6 nM/mL), and 0.1 ppm Cd (25.3±1.5 nM/mL; Figure 5A). For TBT treatments, H2O2 concentrations increased significantly after 5 days of exposure to 5 ppb TBT (18.1±3.1 nM/mL), and 10 ppb TBT (25.8±1.5 nM/mL; Figure 5B). Max-imal responses in H2O2 concentration were observed at 5 days and then decreased until day 9.
Time after TBT treatment (d)
(A) a a a a a a a b ab ab ab a ab abab ab c b 0 1 2 3 (B) a a a a a ab c bc bc abc bcd cd b d bc a a a 0 10 20 30 40 (C) a aab aab a aab aab b a ab ab b a a a 0 1 2 (D) a a a a a a a a a a a a ab a a a ab b 10 20 30 40 SOD (U/mL) SOD (U/mL) CAT (nM/min/mL) CAT (nM/min/mL) Control 5 ppb 10 ppb 0 1 3 5 7 9
Figure 4. In the gills, SOD (A) and CAT (B) activity of ark
shells treated with 5 and 10 ppb TBT for 1, 3, 5, 7, and 9 days. In the digestive glands, SOD (C) and CAT (D) activity of ark shells treated with 5 and 10 ppb TBT for 1, 3, 5, 7, and 9 days. Values in the same experimental group with dissimilar letters are significantly different (P⁄0.05) from each other.
Values are expressed as means±S.D. (n==5). Time after Cd treatment (d)
a a a a a a a a ab b ab ab aba c ab ab bc 0 1 2 3 (A) (B) a a a a a b a a a a a a a a c bc c bc 10 20 30 40 SOD (U/mL) SOD (U/mL) (C) a a a a a a a a ab ab ab ab b c ab bc ab ab 0 1 2 (D) CAT (nM/min/mL) CAT (nM/min/mL) a a a a a a a a a a a a a a a b a a 10 20 30 40 9 0 1 3 5 7 Control 0.05 ppm 0.1 ppm
Figure 3. In the gills, SOD (A) and CAT (B) activity of ark
shells treated with 0.05 and 0.1 ppm Cd for 1, 3, 5, 7, and 9 days. In the digestive glands, SOD (C) and CAT (D) activity of ark shells treated with 0.05 and 0.1 ppm Cd for 1, 3, 5, 7, and 9 days. Values in the same experimental group with dis-similar letters are significantly different (P⁄0.05) from each
Lysozyme Activity
Hemolymph lysozyme activity was significantly lower in ark shells treated with Cd and TBT as com-pared with controls. Lysozyme activity decreased with time and reached the lowest point after 9 days of expo-sure to 0.05 ppm Cd (7.6±1.4μg/mg protein) and 7 days of exposure to 0.1 ppm Cd (6.3±2.9μg/mg pro-tein; Figure 6A). With TBT treatment, lysozyme acti-vity decreased with time and reached the lowest point after 9 days of exposure to 5 ppb TBT (8.7±3.2μg/mg (A) a a a a a a a a ab b ab ab abb b b c b 0 10 20 30 (B) a a a a a a ab ab b ab ab a a b b c bc b 0 10 20 30 H2 O2 (nM/mL) H2 O2 (nM/mL) 0 1 3 5 7 9
Time after Cd treatment (d)
0 1 3 5 7 9
Time after TBT treatment (d)
Control 5 ppb 10 ppb Control 0.05 ppm 0.1 ppm
Figure 5. Effects of Cd and TBT exposure on hydrogen
per-oxide concentrations in the hemolymph of ark shells treated with 0.05 and 0.1 ppm Cd (A), and 5 and 10 ppb TBT (B) for 1, 3, 5, 7, and 9 days. Values in the same experimental group with dissimilar letters are significantly different (P⁄0.05)
from each other. Values are expressed as means±S.D. (n==5).
(A) a a a a a c c c bc ab a a b b b b b a 0 20 40 (B) a a a a a a a ab b b b b a b b b b b 0 20 40 0 1 3 5 7 9
Time after Cd treatment (d)
0 1 3 5 7 9
Time after TBT treatment (d)
Control 5 ppb 10 ppb Control 0.05 ppm 0.1 ppm Lysozyme (μ g/mg protein) Lysozyme (μ g/mg protein)
Figure 6. Effects of Cd and TBT exposure on lysozyme
acti-vity in the hemolymph of ark shells treated with 0.05 and 0.1 ppm Cd (A), and 5 and 10 ppb TBT (B) for 1, 3, 5, 7, and 9 days. Values in the same experimental group with dissimilar letters are significantly different (P⁄0.05) from each other.
Values are expressed as means±S.D. (n==5).
a a a a a a b ab ab ab a a b ab ab ab a a 0 10 20 (A) GOT (IU/L) GOT (IU/L) GPT (IU/L) GPT (IU/L) (B) a a a a a a b a a a a a a a b a a a 0 10 20 a a a a a a ab ab b a a a ab a abc bc abc c 0 10 20 30 (C) (D) a a a a a a a b ab ab a a ab a a a bc c 0 5 10 0 1 3 5 7 9
Time after Cd treatment (d)
0 1 3 5 7 9
Time after TBT treatment (d)
Control 5 ppb 10 ppb Control 0.05 ppm 0.1 ppm
Figure 7. GOT (A) and GPT (B) levels in the hemolymph of
ark shells treated with 0.05 and 0.1 ppm Cd. GOT (C) and GPT (D) levels in the hemolymph of ark shells treated with 5 and 10 ppb TBT. Values in the same experimental group with dissimilar letters are significantly different (P⁄0.05) from
protein) and 7 days of exposure to 10 ppb TBT (6.3± 2.1μg/mg protein; Figure 6B).
GOT and GPT
Hemolymph GOT and GPT levels during Cd and TBT treatments are shown in Figure 7. In the Cd treat-ment groups, GOT and GPT levels significantly incre-ased after 7 days of exposure to 0.05 ppm (GOT, 10.3 ±2.1 IU/L; GPT, 10.3±4.9 IU/L) and after 5 days of exposure to 0.1 ppm (GOT, 15.3±2.5 IU/L; GPT, 9.0 ±2.0 IU/L). In the TBT treatment groups, GOT and GPT levels significantly increased after 7 days of exposure to 10 ppb TBT (GOT, 18.0±3.0 IU/L; GPT, 6.2±1.6 IU/L) and after 5 days of exposure to 5 ppb TBT (GOT, 10.3±2.9 IU/L; GPT, 4.3±0.8 IU/L).
Discussion
To identify the antioxidant mechanisms and physio-logical responses of the ark shell to Cd and TBT expo-sure, we investigated time- and dose-effects of these contaminants on antioxidant enzyme mRNA expres-sion and activity in the gills and digestive glands. Addi-tionally, we quantified changes in H2O2concentrations, lysozyme activity, and GOT and GPT levels in the hemolymph.
Because the gills and digestive glands are important target organs for contaminant accumulation, these tis-sues were chosen to investigate antioxidant defense mechanisms against contamination19. The gills were chosen because they represent the main site of conta-mination uptake, which occurs via a direct route of exposure, and they have a large exchange area that is in contact with the surrounding environment. The digestive gland is the major site of xenobiotic uptake and is involved in most biotransformation processes and redox-cycling generation19.
In bivalves, it has been reported that Cd exposure increases ROS production, e.g., H2O2, in the interior of the body4. ROS produced as a result of Cd exposure can cause oxidative stress, which may lead to cell membrane damage, DNA damage, lipid peroxidation, protein denaturation, and the inhibition of enzyme activation4.
We found that the mRNA expression and activity of antioxidant enzymes increased in the gills and digestive glands with Cd treatment (Figures 1 and 3). In addition, H2O2 concentrations increased in the hemolymph as Cd exposure time and dose increased (Figure 5A). These results suggest that Cd exposure increases the formation of ROS. In response, the mRNA expression and activity of antioxidant enzymes may increase to detoxify the ROS produced as a result of Cd exposure.
Jo et al.4reported that in the Pacific oyster, Crassostrea
gigas, exposure to Cd leads to increases in H2O2 con-centrations and of SOD, CAT and GPX mRNA expres-sion as compared with controls. This increase may due to an increase in the defensive mechanisms of the antioxidant system as a result of ROS production exerted by Cd. Funes et al.20 demonstrated that anti-oxidant enzyme activity is higher in metal polluted areas as compared with clean areas by comparing levels of SOD, CAT, GPX, and GST activity in Portu-guese oysters, Crassostrea angulata, and Mediterra-nean mussels, Mytilus galloprovincialis, from differ-ent sampling sites. These increases may represdiffer-ent a protective mechanism against metal pollution-induced the production of ROS. These results suggest that, to protect itself from ROS, the ark shell increases its anti-oxidant defense capacity by increasing antianti-oxidant enzymes mRNA expression and activity concurrent with increases in Cd dose and exposure time.
Rice and Weeks21 demonstrated that TBT affects ROS modulation and stimulates the production of superoxide anions (O2∙-) and hydroxyl radicals (OH∙). In the present study, TBT exposure leads to increase antioxidant enzymes mRNA expression and activity in the gills and digestive glands (Figure 2 and 4). Fur-ther, H2O2 concentrations increased as TBT concen-tration and exposure time increased (Figure 5B). TBT has the highest toxicity levels than other contaminants (Cu, Hg, and ammonia) comparing the median lethal concentration22. In addition, it has been reported that the effects of TBT exposure generate ROS and induce oxidative stress8. In the Pacific oyster, TBT exposure induces the production of ROS and increases SOD mRNA expression, which facilitates ROS removal23. In cuvier, Sebasticus marmoratus, TBT exposure also induces the production of ROS and increases antioxi-dant enzyme activity24. Therefore, we conclude that to protect against ROS caused by TBT exposure, ark shells may increase antioxidant enzymes mRNA ex-pression and activity as TBT exposure time and dose increase. Additionally, for both Cd and TBT treatment groups, the mRNA expression and activity of antioxi-dant enzymes peaked at an earlier exposure time in the gills as compared with the digestive gland. The gills may represent the main barrier involved in con-tamination uptake via direct routes of exposure19. It is suggested that the gills developed an antioxidant de-fense system in advance of the digestive gland.
In the present study, we hypothesized that Cd and TBT exposure would increase ROS production in the ark shell. To counter this, SOD provides a first-line of defense against O2∙-. Because SOD mRNA expres-sion and activity increases, H2O2 concentrations are high in the hemolymph, CAT mRNA expression and
activity increases to reduce H2O2concentrations. Addi-tionally, when CAT mRNA expression and activity decreases, there is a concurrent decrease in hemolymph concentrations of H2O2. These results suggest that H2O2concentrations are regulated by the CAT.
In bivalves, changes in hemolymph constituents caused by heavy metal contamination, various envi-ronmental factors, and pathogenic agents have been reported25. Among the changes observed in hemo-lymph constituents, lysosomal enzymes are generally affected by environmental stress (e.g., heavy metals and organic compounds)17,18. In this study, lysozyme activity decreased as Cd and TBT exposure time and dose increased (Figure 6). In some bivalve species, the immune system, including lysosomal enzyme acti-vity, is affected by the production of ROS such as O2∙-, H2O2, and OH∙26. Chen et al.27 demonstrated that acute temperature challenges increase ROS con-centrations and SOD activity in scallops, whereas lysosomal activity decreases. This result suggests that ROS produced under stress affect aspects of immunity. Thus, we conclude that Cd and TBT exposure incre-ases ROS concentrations and antioxidant enzyme acti-vity; however, contamination and ROS affect immu-nity and decrease lysozyme activity. Therefore, we suggest that in response to Cd and TBT exposure, the antioxidant system is upregulated, but continuative stress caused by contamination affects immunity and decreases lysozyme activity.
Among the changes in hemolymph constituents, increases in GOT and GPT levels are generally caused by the inflow of cells into the hemolymph. These cells are separated due to tissue damage by environmental contaminants4. Vaglio and Landricina28 reported that Cd exposure increases GOT and GPT levels in serum of gilthead bream, Sparus aurata. Additionally, Yoshi-zuka et al.29 reported that TBT exposure increases GOT and GPT levels in the rat, Rattus rattus. In the ark shell, we found that Cd and TBT exposure increas-ed GOT and GPT levels as exposure time and dose increased (Figure 7). Therefore, the significant incre-ases in GOT and GPT levels in the hemolymph of the ark shell observed after exposure to Cd and TBT may be a result of tissue damage.
In conclusion, it is assumed that Cd and TBT expo-sure increases the production of ROS such as H2O2in the ark shell. To counter this stress, SOD provides a first-line of defense against O2∙-. Secondly, CAT acti-vates to reduce H2O2. Because lysozyme activity de-creased in the hemolymph throughout the experiment, we suspect that contamination and ROS negatively affect immunity and decrease lysozyme activity. The observed increases in GOT and GPT indicate that tis-sue damage occurred in the ark shell as a result of
con-taminants and ROS.
Materials & Methods
Experimental Animal
We used ark shells (average shell length: 65.7±5.3 mm; height: 40.1±3.1 mm; weight: 85.3±10.9 g) obtained from the Yongwon in Jinhae (Gyeongnam, Korea). Ark shells were placed in 50 L circulating fil-ter tanks in the laboratory at a density of 50 specimens per tank. During the experimental period, water tem-perature and salinity were maintained at 20±1�C and 35 ppt, respectively. Animals were kept in a photope-riod of 12 h light/12 h dark and were fed a mixture of microalgae (Chaetoceros sp., and Isochrysis galbana; 1 : 1).
Cd and TBT Treatments
After acclimatization, 30 ark shells were transferred to 50 L plastic aquaria filled with 1μm filtered natural seawater (control), Cd-treated seawater, or TBT-ed seawater (experimental groups). For the Cd treat-ment groups, Cd was added to the water as CdCl2∙ 2.5H2O (Kanto Chemical) at a dissolved Cd2
+ +
concen-tration of either 0.05 or 0.1 ppm. For the TBT treat-ment groups, TBT was added to the water as TBTO (Tributyltin (IV) oxide; Riedel-de Haen) at a dissolved TBT concentration of either 5 or 10 ppb. Ark shells were exposed to these treatments for 9 days. During this time the water was changed daily and resupplied with the corresponding treatment. Hemolymph and tissues (digestive glands and gills) were sampled from five randomly selected ark shells after 0, 1, 3, 7, and 9 days of treatment.
Quantitative Real-time PCR (QPCR)
QPCR was conducted to determine the relative mRNA expression of antioxidant enzymes (SOD and CAT) using total RNA extracted from digestive glands and gills of control and experimental groups. With 2.5 μg of total RNA as a template, cDNA were synthesiz-ed using M-MLV reverse transcriptase (Bioneer). First-strand cDNA synthesis was conducted using oligo-d(T)15 primer (Promega). Primers for QPCR were designed with reference to known SOD (GenBank accession no. GQ229480), CAT (GQ422471) and 28S rRNA (AB101599) gene sequences of ark shell as fol-lows: SOD forward primer, 5 ′-CATTCAGTTGCAG-GCAGCCATAAG-3′; SOD reverse primer, 5′-GTG-ACAAATTCCTCCAGGATCAAGTC-3′; CAT for-ward primer, 5 ′-CTTTGCTGAAGTGGAACAAAT-TGC-3′; CAT reverse primer, CATCTTGTCTG-GGCTGGCTTC-3′; 28S rRNA forward primer,
5′-AAACACGGACCAAGGAGTCT-3′; and 28S rRNA reverse primer, 5 ′-AGGCTGCCTTCACTTTCATT-3′. QPCR amplification was conducted using a Bio-Rad MiniOpticonTMSystem (Bio-Rad) and iQTMSYBR Green Supermix (Bio-Rad), according to the manu-facturers’ instructions. QPCR was undertaken by denaturation at 95�C for 5 min; followed by 40 cycles of denaturation at 95�C for 20 s and annealing at 55�C for 20 s. As an internal control, experiments were duplicated with 28S rRNA, and all data are expressed as the change with respect to the corresponding 28S rRNA calculated threshold cycle (Ct) levels.
Enzyme Activity Assays
SOD activity was assessed by measuring the reduc-tion of cytochrome c via the xanthine oxidase/xanthine methods of Crapo et al.30and using a superoxide dis-mutase assay kit (Cayman Chemical). 1 g of tissue was homogenized in 10 mL of cold 20 mM HEPES buffer (pH 7.2, 1 mM EGTA, 210 mM mannitol, and 70 mM sucrose). The sample was centrifuged at 1,500 ×g for 5 min at 4�C and removed the supernant for assay and stored on ice. 200μL of radical detector (Cayman Chemical), 20μL of xanthine oxidase (Cay-man Chemical), and 10μL of sample were added per well to flat bottom 96 well microtitre plates. The plate was incubated on a shaker for 20 min at room temper-ature. The absorbance was readed at 450 nm using a plate reader. Concentrations are expressed as U/mL.
CAT activity was measured using a catalase assay kit (Cayman Chemical) and the spectrophotometric methods outlined by Wheeler et al.15, which are based on the enzymatic reaction of CAT with methanol in the presence of H2O2. 1 g of tissue was homogenized in 10 mL of cold buffer (50 mM potassium phosphate, pH 7.0, 1 mM EDTA). The sample was centrifuged at 10,000×g for 15 min at 4�C and removed the super-nant for assay and store on ice. 100μL of assay buffer (Cayman Chemical), 30μL of methanol, and 20 μL of sample were added per well to flat bottom 96 well microtitre plates. The plate was incubated on a shaker for 20 min at room temperature. 30μL of potassium hydroxide (Cayman Chemical) and 30μL of Purpald (Cayman Chemical) were added to the each well. The plate was incubated on a shaker for 10 min at room temperature. 10μL of potassium periodate (Cayman Chemical) was added to the each well. The plate was incubated on a shaker for 5 min at room temperature. The absorbance was readed at 540 nm using a plate reader. Concentrations are expressed as nM/min/mL. H2O2Assays
H2O2concentrations were measured using the mod-ified methods of Nouroozzadeh et al.31and a
peroxi-detect kit (Sigma). 20μL whole hemolymph in marine anticoagulant (MAC, 0.1 M glucose, 15 mM trisodium citrate, 13 mM citric acid, 50 mM EDTA, 0.45 M NaCl, pH 7.5) was added per well to flat bottom 96 well microtitre plates. Plates were incubated at room tem-perature for 20 min to allow hemocytes to settle and adhere. A working color reagent was prepared by mixing 100 mL distilled water containing 100 mM sorbitol and 125μM xylenol orange (Sigma) with 1 mL 25 mM ferrous ammonium sulphate prepared in 2.5 M sulphuric acid (Sigma). 200μL of this reagent was then added to each well and allowed to incubate at room temperature for 1 h. Absorbance was read at 560 nm and concentrations of H2O2were interpolated from a standard curve. Concentrations are expressed as nM/mL.
Lysozyme Activity Assays
Lysozyme activity was quantified in hemolymph according to the methods described by Santarém et
al.32. Briefly, pooled hemolymph was centrifuged at 780×g for 10 min and the supernatant was collected. Hemolymph was then frozen and stored at -80�C until use. To quantify lysozyme activity, 10μL hemo-lymph was added to 200μL of a 0.15% suspension of
Micrococcus lysodeikticus (Sigma) in 66 mM
phos-phate buffer, pH 6.2. Decreases in absorbance (ΔA/min) were then continuously recorded at 450 nm for 5 min at 20�C in a 96 well plate. The average decrease in absorbance per min was determined for each enzyme solution, and a standard curve of enzyme concentra-tion vs. ΔA/min was constructed. One unit of lyso-zyme was defined as the amount of enlyso-zyme produc-ing activity equivalent to 1μg lysozyme in the condi-tions described above. Results are expressed as μg lysozyme/mg protein.
Plasma Parameters Analysis
Plasma GOT and GPT were examined using a bio-chemistry autoanalyzer (Hitachi).
Statistical Analysis
All data were analyzed using the SPSS statistical package (version 10.0; SPSS Inc., USA). One way ANOVA followed by Tukey post hoc test was used to compare differences in the data (P⁄0.05). Values are expressed as mean±S.D.
Acknowledgements
This work was supported in part by the Korea Re-search Foundation Grant by the Korean Government (KRF-2008-331-F00040), and in part by the MKE
(The Ministry of Knowledge Economy), Korea, under the ITRC (Information Technology Research Center) support program supervised by the IITA (Institute for Information Technology Advancement (IITA-2009-C1090-0903-0007).
References
1. Rainbow, P. S. Biomonitoring of heavy metal avail-ability in the marine environment. Mar Pollut Bull 31:183-192 (1995).
2. Kim, S. G., Jee, J. H. & Kang, J. C. Cadmium accu-mulation and elimination in tissues of juvenile olive flounder, Paralichthys olivaceus after subchronic cad-mium exposure. Environ Pollut 127:117-123 (2004). 3. Benavides, M. P., Gallego, S. M. & Tomaro, M. L.
Cadmium toxicity in plants. Braz J Plant Physiol 17: 21-34 (2005).
4. Jo, P. G., Choi, Y. K. & Choi, C.Y. Cloning and mRNA expression of antioxidant enzymes in the Pacific oys-ter, Crassostrea gigas in response to cadmium expo-sure. Comp Biochem Physiol 147C:460-469 (2008). 5. Maguire, R. J. Environmental aspects of tributyltin.
Appl Organomet Chem 1:475-498 (1987).
6. Antizlar-Ladislao, B. Environmental levels, toxicity and human exposure to tributyltin (TBT)-contaminat-ed marine environment. Environ Int 34:292-308 (2008). 7. Langston, W. J. Recent developments in TBT
ecotox-icology. Toxicol Ecotox News 3:179-187 (1996). 8. Huang, Z. et al. Antioxidant responses in Meretrix
meretrix exposed to environmentally relevant doses
of tributyltin. Environ Toxicol Pharmacol 20:107-111 (2005).
9. McFarland, V. A. et al. Biomarkers of oxidative stress and genotoxicity in livers of field-collected brown bullhead, Ameiurus nebulosus. Arch Environ Con Tox
37:236-241 (1999).
10. Hansen, B. H., Romma, S., Garmo, O. A., Olsvik, P. A. & Andersen, R. A. Antioxidative stress proteins and their gene expression in brown trout (Salmo trutta) from three rivers with different heavy metal levels.
Comp Biochem Physiol 143C:263-274 (2006).
11. Kashiwagi, A., Kashiwagi, K., Takase, M., Hanada, H. & Nakamura, M. Comparison of catalase in diploid and haploid Rana rugosa using heat and chemical inactivation techniques. Comp Biochem Physiol 118B: 499-503 (1997).
12. Mruk, D. D., Silverstrini, B., Mo, M. & Chenga, C. Y. Antioxidant superoxide dismutase-a review: its func-tion, regulation in the testis, and role in male fertility.
Contraception 65:305-311 (2002).
13. Monari, M. et al. Effect of exposure to benzo[a]pyrene on SODs, CYP1A1/1A2- and CYP2E1 immunoposi-tive proteins in the blood clam Scapharca
inaequival-vis. Mar Environ Res 63:200-218 (2007).
14. Faria, M. et al. Multi-biomarker responses in the fresh-water mussel Dreissena polymorpha exposed to
poly-chlorobiphenyls and metals. Comp Biochem Physiol
149C:281-288 (2009).
15. Wheeler, C. R., Salzman, J. A. & Elsayed, N. M. Auto-mated assays for superoxide dismutase, catalase, gluta-thione peroxidase, and glutagluta-thione reductase activity.
Anal Biochem 184:193-199 (1990).
16. Richardson, B. J. et al. Antioxidant responses to poly-cyclic aromatic hydrocarbons and organochlorine pesticides in green-lipped mussels (Perna viridis): Do mussels “integrate” biomarker responses? Mar Pollut
Bull 57:503-514 (2008).
17. Suresh, K. & Mohandas, A. Hemolymph acid phos-phatase activity pattern in copper-stressed bivalves. J
Invertebr Pathol 55:118-125 (1990).
18. Grundy, M. M., Moore, M. N., Howell, S. M. & Rat-cliffe, N. A. Phagocytic reduction and effects on lyso-somal membranes by polycyclic aromatic hydrocar-bons, in haemocytes of Mytilus edulis. Aquat Toxicol
34:273-290 (1996).
19. Livingstone, D. R., Lips, F., Garcia Martinez, P. & Pipe, R. K. Antioxidant enzymes in the digestive gland of the common mussel Mytilus edulis. Mar Biol 122: 265-276 (1992).
20. Funes, V., Alhama, J., Navas, J. I., López-Barea, J. & Peinado, J. Ecotoxicological effects of metal pollution in two mollusc species from the Spanish South Atlantic littoral. Environ Pollut 139:214-223 (2006).
21. Rice, C. D. & Weeks, B. A. Tributyltin stimulates reactive oxygen formation in toadfish microphages.
Dev Comp Immunol 15:431-436 (1991).
22. Kim, C. K., Kim D. H., Lee, J. S. & Lee, K. T. Influ-ence of heavy metals, ammonia, and organotin com-pounds on the survival of arkshell clams, Scapharca
broughtonii. Kor J Malacol 20:93-105 (2004).
23. Park, M. S., Jo, P. G., Choi, Y. K., An, K. W. & Choi, C. Y. Characterization and mRNA expression of Mn-SOD and physiological responses to stresses in the Pacific oyster Crassostrea gigas. Mar Biol Res In Press, Accepted Manuscript (2009).
24. Wang, C. et al. Effects of tributyltin, benzo[a]pyrene, and their mixture on antioxidant defense systems in
Sebastiscus marmoratus. Ecotoxicol Environ Saf 65:
381-387 (2006).
25. Xue, Q. & Tristan, R. Enzymatic activities in European flat oyster, Ostrea edulis, and Pacific oyster,
Crassos-trea gigas, hemolymph. J Invertebr Pathol
76:155-163 (2000).
26. Pipe, R. K. Generation of reactive oxygen metabolites by the haemocytes of the mussel Mytilus edulis. Dev
Comp Immunol 16:111-122 (1992).
27. Chen, M., Yang, H., Delaporte, M. & Zhao, S. Immune condition of Chlamys farreri in reponse to acute tem-perature challenge. Aquaculture 271:479-487 (2007). 28. Vaglio, A. & Landriscina, C. Changes in liver enzyme
activity in the teleost Sparus aurata in response to cad-mium intoxication. Ecotoxicol Environ Saf 43:111-116 (1999).
in-duced by bis (tributyltin) oxide. Arch Toxicol 66:182-187 (1992).
30. Crapo, J. D., McCord, J. M. & Fridovich, I. Prepara-tion and assay of superoxide dismutases. Meth
Enzy-mol 53:382-393 (1978).
31. Nouroozzadeh, J., Tajaddinisarmadi, J. & Wolff, S. P. Measurement of plasma hydroperoxide concentrations
by ferrous oxidation-xylenol orange assay in conjunc-tion with triphenylphosphine. Anal Biochem 220:403-409 (1994).
32. Santarém, M. M., Robledo, J. A. F. & Figueras, A. Seasonal changes in hemocytes and serum defense factors in the blue mussel, Mytilus galloprovincialis.