Copyright © 2021 Techno-Press, Ltd.
http://www.techno-press.com/journals/was&subpage=7 ISSN: 1226-6116 (Print), 1598-6225 (Online) 1. Introduction
With the development and widespread use of the high-speed train technologies, the train need to operate in various climate situations. For example, the railway from Lanchow to Urumqi in China is effected by the strong wind environment due to complex landforms (Zhang et al. 2015, Liu and Zhang 2013, Zhang et al. 2017a). Moreover, the wind also effects the train running in the desert area such Saudi Arabia (Paz et al. 2015), the wind blow sand effect the aerodynamics forces of the train.
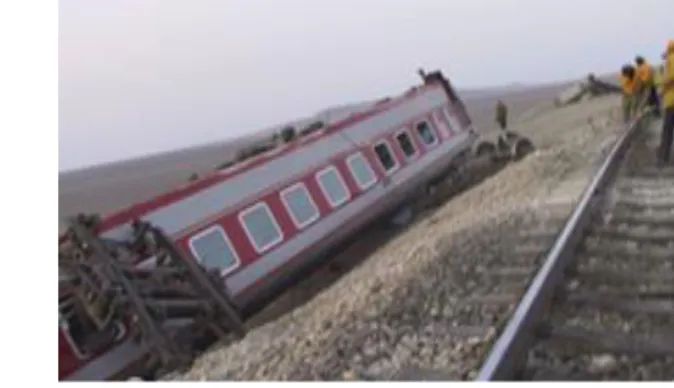
In the dry desert region, the windblown sand particles will collide on the train windows when the train running through and make the window class broken as showing in Fig. 1. It threats the train operation stability and takes the fear to the passengers. The sand particle’s collision force on the train surface makes an influence of the train body material using life. Thus, the investigations on the sand impact force on the train surface are respected to provide references to the study of high-speed train operation safety in wind-sand environment.
Paz et al. (Paz et al. 2015) studied the wind-blown sand influence on the train aerodynamics performance utilizing
Corresponding author, Ph.D. E-mail: [email protected] aAssistant Professor E-mail: [email protected] bPh.D. E-mail: [email protected]the DPM method in FLUENT. The mean force that sand load exerting on the train is estimated by time average momentum equation. The sand diameter, sand load and particle’s restitution are considered. However, the particle contact time on the train surface is not accurate for considering the average moving time as the contact time and sand particles distribution is neglected. The Hertzian impact theory (McLaskeya and Glaser 2010) is applied to calculate the force that a small size spherical particle collides on the infinite flat. In this study, the sand particle’s size is much smaller than the train surface structure. Thus, the model of windblown sand impact force on the high-speed train in the wind-sand environment is investigated based on the DPM method coupled with Hertzian impact theory.
The structure of this paper is organized as follows. The section 2 briefly introduces the CFD model and sand particle impact model. The section 3 presents the numerical simulations using proposed sand particle impact model. The section 4 draws conclusions of proposed model in wind-blown sand impacts.
2. CFD model and sand particle impact mode
2.1 Simulation method
Unsteady incompressible RANS equation and the SST k–ω model are utilized to calculate the turbulent air phase (Smyth and Thomas, 2016), Discrete Phase Method based on Eulerain-Lagriangian approach(DPM) is adopted to simulate the sand particle phase (Paz et al. 2015, Ke et al.
Modelling the multi-physics of wind-blown sand impacts on high-speed train
Yani Zhang
1a, Chen Jiang
2and Xuhe Zhan
1,2b1National Innovation Centre of High-speed Train, Qingdao 266000, China
2Key Laboratory of Traffic Safety on Track of Ministry of Education, School of Traffic & Transportation Engineering,
Central South University, Changsha 410075, China
(Received July 21, 2020, Revised April 8, 2021,Accepted April 26, 2021)
Abstract. The wind-blown sand effect on the high-speed train is investigated. Unsteady RANS equation and the SST k–ω
turbulent model coupled with the discrete phase model (DPM) are utilized to simulate the two-phase of air-sand. Sand impact force is calculated based on the Hertzian impact theory. The different cases, including various wind velocity, train speed, sand particle diameter, were simulated. The train’s flow field characteristics and the sand impact force were analyzed. The results show that the sand environment makes the pressure increase under different wind velocity and train speed situations. Sand impact force increases with the increasing train speed and sand particle diameter under the same particle mass flow rate. The train aerodynamic force connected with sand impact force when the train running in the wind-sand environment were compared with the aerodynamic force when the train running in the pure wind environment. The results show that the head car longitudinal force increase with wind speed increasing. When the crosswind speed is larger than 35m/s, the effect of the wind- sand environment on the train increases obviously. The longitudinal force of head car increases 23% and lateral force of tail increases 12% comparing to the pure wind environment. The sand concentration in air is the most important factor which influences the sand impact force on the train.
Yani Zhang, Chen Jiang and Xuhe Zhan
2020, Xin et al. 2018). There are many investigators utilized the DPM method to simulate the sand-air two phase flow. A k-epsilon model was implemented to solve gas flow behavior and Discrete Phase Model (DPM) was used to track solid particles (Aa 2020, Khan 2020). Discrete Phase Method (DPM) are used to simulate the characteristic movement of sand particles in wind flow (Sarafrazi and Talaee 2019).
In DPM, the particles are regarded as many spheres with pre-defined diameter. Therefore, DPM can easily consider the aerodynamic forces acted on particles by turbulent air phase, and the additional sources of air phase caused by spherical particles movements. Although complex interactions between continuous phase, discrete phase and walls can be achieved by DPM, the impact forces of spherical particles on walls are absent in current simulations.
In fact, the Hertzian impact theory (McLaskeya and Glaser 2010) can calculate the impact behaviors of a spherical ball impacting with a semi-infinite plane. The impacts of sand particles on train surfaces are regarded as a
large quantity of separate tiny sphere impacts on a massive body. Meanwhile, collisions between particles are ignored. The Hertzian impact theory, respect to those physic processes, is implemented into adopted Eulerian-Lagriangian approach to estimate the sand particle impact forces on the train surface.
However, there are four assumptions in Hertzian impact theory to apply for the sand particle impact force calculation:
(1) Firstly, sand grains are simplified to ideal elastic spherical particle.
(2) Secondly, the collision between the sand grains and the train body and other ancillary structures is elastic collision. Plastic deformation and brittle fracture will not occur in sand grains or train parts.
(3) The tangential behavior of sand particle is frictionless. The size of sand grains is negligible compared to the size of train surface.
(4) In the same area of the train’s surface, only one sand particle collided with the area in the same instantaneous period.
(a) Windblown sand broke the passenger car window (b) The overturning of the train in the desert Fig. 1 The damage of windblown sand on high-speed train
Fig. 2 The impact force calculation process of user defined function Simulation in FLUENT
Monitoring the parameters of the particles which collide on the
train surface
Get the node and element information of the train
grid
Particles velocity Particles position
Calculate the sand impact forces of each sand particle acting on the train surface based on Hertzian
Impact theory in MATLAB 488
Considering one single sand particle impact on train surface, four assumptions in Hertzian impact theory can be satisfied. For assumption (1), although it is not advisable to simplify sand particle to ideal spherical particle when considering the impact of an object
which is the same size as sand particle, but it is acceptable to consider a single sand particle as an ideal spherical particle when it impacting on a train surface. Because the train surface area, even the surface grid, is much larger than the sand particle’s diameter.
Assumption (2) is satisfied based on the fact that the sand particle has enough strength to endure the contact force without breakup. Because sand particles can often cause window broken when it collides on the train surface.
Assumption (3) can not be rigorously met in this circumstance. But the smoothness of train painting outer surface and dry sands indicates a very small friction coefficient between them. Therefore, the regardless of friction is reasonable.
Assumption (4) is satisfied based on the fact that the contact time between sand particle and train surface elements is extremely short due to high elastic modulus of train high-strength alumina body.
According to this theory, the sand particle size is much smaller than the train surface, thus, the situation that small sand particle colliding on the train surface is same as a small size ball imparts to a massive body. Consequently, the impact force of the single sand particle is calculated by Eqs. (1)-(2). The maximum force is utilized to estimate the force
impact on the train.
𝑓𝐻𝑚𝑎𝑥= 1.917𝜌13 5⁄ (𝛿1+ 𝛿2)−2 5⁄ 𝑅12𝑣06 5⁄ (1)
𝛿𝑖=
(1 − 𝜐𝑖2) (𝜋𝐸𝑖)
(2) Where R1, ρ1, v0 are the radius, approach velocity, and density of the sand particle. E and ʋ are the Young’s modulus and Poisson’s ratio. The impact force is determined by the velocity of the particle and the material properties of the sand particle and train surface.
The sand impact force calculation process is showed in Fig. 2. The impact force on the train surface is calculated by a user defined function, which reads in the approach velocity of the particles monitored by FLUENT simulation process. Since the friction is relatively small and friction coefficient is hard to measure, the force normal to the train surface is considered in this study.
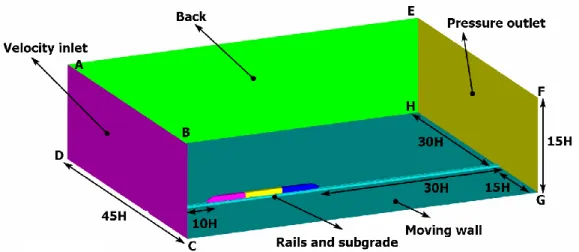
2.2 Geometry model, mesh and boundary conditions The simulation domain, geometry model and boundary conditions are showed in Fig. 3. The velocity setup in the inlet ABCD of domain is the train speed, and in the velocity inlet BCGF of domain is the crosswind speed. Rails and subgrade are set as moving wall with the same train speed. The DPM conditions on the train surface and rails are reflection. The restitution coefficient is 1. The sand density Fig.3 Geometry model and computational domain
(a) The side view (b) The bogie surface grid
Yani Zhang, Chen Jiang and Xuhe Zhan
is 2650 kg/m3. The sand particle’s mass flow rate setup refers to the research of Jiang et al. (Jiang et al. 2010).
The grid showed in Fig. 4 is generated by Open FOAM. The mesh is dominated by hexahedrons. The train surface mesh size is 31.25 mm. The grid size on the bogie is 15.625 mm. There are 10 boundary layers on the train and bogies, and 6 layers on the rails. The boundary layer thickness is 3.125 mm on the train body.
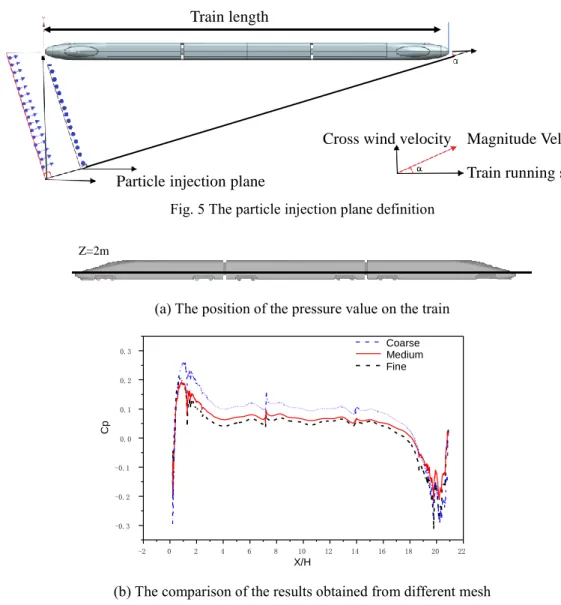
The sand particle injection plane in the discrete phase simulation is sat as showing in Fig. 5. Based on the investigation in the sand environment study of Jiang (Jiang et al. 2010), the sand particle volume fraction in the space above the height of 5 m is rather less, and almost of the sand is dust. Thus, the sand particle injection plane is 5m height in this study.
The particle injection plane width is defined according to the magnitude velocity direction angle of the train running speed and crosswind speed, showing in Fig. 5. The sand particle distribution in space is expected to covering the train running area, thus shortest particle injection plane is defined by the largest crosswind speed and the smallest train running speed. In order to promise the sand particle distributing in the space reaching the certain moving velocity, the injection plane is sat 15 m from the train head after simulation test.
The discrete phase total flow rate is defined based on the sand flow density in different heights. The total flow rate is uniformly distributing in the space of certain height. The sand flow density is defined by Eq. (3).
Fig. 5 The particle injection plane definition
(a) The position of the pressure value on the train
(b) The comparison of the results obtained from different mesh Fig. 6 Pressure coefficients comparison on the train surface Table1 Particle injection total flow rate (g/s)
Height (m) 0-0.5 0.5-1 1-2 2-3 3-5 23 m/s 0.39 2.40 0.28 0.19 0.30 29 m/s 0.67 0.40 0.48 0.33 0.51 35 m/s 5.38 03.24 3.83 2.65 04.10 41 m/s 436.81 263.64 315.99 217.46 333.74
列车长度
Train length
Train running speed
Cross wind velocity
Magnitude Velocity
Particle injection plane
Z=2m -2 0 2 4 6 8 10 12 14 16 18 20 22 -0.3 -0.2 -0.1 0.0 0.1 0.2 0.3 Coarse Medium Fine Cp X/H 490
𝑄ℎ = ∑𝜌𝑖𝐴𝑉ℎ𝑇 (3)
𝑄ℎ(kg) is the sand collection total mass in certain height, 𝜌𝑖 (kg/m3) is the windblown sand density, A (m2) is sand collection container inlet area, 𝑉ℎ(m/s) is the wind velocity corresponding to the sand density, T(s) is the collection time under the wind velocity.
The injection total flow rate (kg/s) is defined by the particle flow density at the certain height multiplying by
corresponding wind velocity and injection plane area. The injection total flow rate at different height is showing in Table1.
2.3 Validation
In order to promote the simulation accuracy and calculation efficiency, the simulation results obtained from different mesh were compared. The train pressure Fig. 7 The pressure monitoring position on the train
Fig. 8 The pressure comparation of the simulation results and experiment data
(a)35m/s
(b) 41m/s
Fig. 9 Sand volume fraction in the air
0 1 2 3 4 5 6 7 8 9 10 11 12 13 14 15 -0.4 -0.3 -0.2 -0.1 0.0 0.1 0.2 0.3 0.4 Simulation Experiment Cp X/H
Yani Zhang, Chen Jiang and Xuhe Zhan
coefficient is defined as following
(4) where p is the air density, with a value of 1.225 kg/m3, 𝑈𝑟𝑒𝑓 is the train speed (m/s). p is the static pressure (Pa) on the train surface. 𝑃∞ is the atmospheric pressure (Pa), with a reference pressure of 0 Pa.
The coarse mesh, medium and fine mesh were generated with grid number of 14 million, 25 million, and 42 million respectively. The pressure value coefficient on train surface showed in Fig. 6(a) were obtained. The comparison in Fig.
6(b) shows that the results of the medium mesh and fine mesh are close, thus the simulation in the study is based on the second mesh for the simulation efficiency.
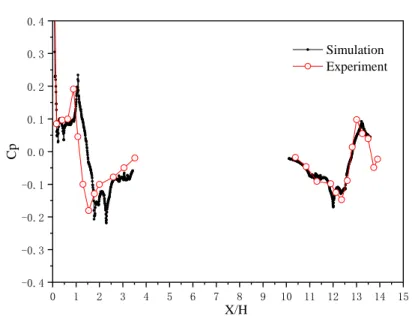
The air phase simulation method is validated by comparing the simulation results with the wind tunnel experiment results in references (Niu et al. 2016). The simulation is based on a scaled geometry model of ratio 1:8. The case is the wind speed is 60m/s with the 15° yaw angle. The pressure coefficient on the train head and tail surface showed in Fig. 8 were obtained to compare with the experiment results of study (Niu et al. 2016). The comparison showed in Fig. 8 indicates that the simulation Fig. 10 The drag curve with simulation timesteps
(a) The sand particle impact force curve in 1.2s~2.5s
(b) The sand particle impact force curve in 2.5s~5s Fig. 11 The sand particle impact force curves
1.2 1.3 1.4 1.5 1.6 1.7 1.8 1.9 2.0 2.1 2.2 2.3 2.4 2.5 -40 -20 0 20 40 60 80 100 120 Fx Sand particle i mpact force ( N ) Simulation time(s) 2.5 3.0 3.5 4.0 4.5 5.0 -40 -20 0 20 40 60 80 100 120 Fx Sand p article imp act fo rce ( N ) Simulation time(s) 492
results of the pressure value on the head and tail are close to the experiment data. Thus, the air phase simulation method is reliable.
As for the sand impact force, the study showed that the
windblown sand making the train resistance increase more than 10% when the sand volume fraction is more than 4×10⁵ and the sand particle’s diameter is larger than 0.5 mm (Paz et al. 2015). The investigation in this study showed the Fig. 12 The monitored position of the velocity and pressure distribution
(a) Pressure distribution in the train surface of the heasd (b) Pressure distribution on the train surface of the middle
(c) Pressure distribution on the train surface of the trail (d) Velocity distribution near the train surface Fig. 13 Flow field around the train
X=12.5m X=37.5m X=62.5m Z=0.75m Z=1.5m Windward side Leeward side B A 0.0 0.5 1.0 1.5 2.0 2.5 3.0 3.5 4.0 -6000 -5000 -4000 -3000 -2000 -1000 0 1000 Wind-windward Sand-windward Wind-leeward Sand-leeward
Pr
essu
re (Pa)
Height(
m)
0.0 0.5 1.0 1.5 2.0 2.5 3.0 3.5 4.0 -5000 -4000 -3000 -2000 -1000 0 1000 Wind-windward Sand-windward Wind-leeward Sand-leedward Pr essu re (Pa) Height(
m)
0.0 0.5 1.0 1.5 2.0 2.5 3.0 3.5 4.0 -4000 -3000 -2000 -1000 0 1000 Wind-windward Sand-windward Wind-leeward Sand-leewardPr
essu
re (Pa)
Height(
m)
-20 0 20 40 60 80 100 20 30 40 50 60 70 80 Wind-windward Sand-leeward Wind-windward Sand-leewardVelo
ci
ty
(m/s)
X Distance
(
m
)
Yani Zhang, Chen Jiang and Xuhe Zhan
similar results. The sand volume fraction in the air is showing in Fig. 9, which the crosswind speed are 35m/s and 41m/s respectively. The sand volume fraction in those two cases are 0.0002 and 0.007. The train resistance increased 11.61% and 11.7% respectively. The results coincide to Paz’s research.
In this section, the air-sand two phase simulation convergence is validated by comparing different iteration results. The cases in this paper were simulated in the steady state firstly, and then changed to the transient mode. The simulation results of the case which train speed is 200km/h with wind speed 35 m/s are showed in Figs. 10 and 11. Drag curve with simulation time steps showed in Fig. 9
indicates that the drag varies regularly after 1.2 s. The drag force average value in time period of 1.5 s-2.5 s and 1.5s-5 s are 6032.65N and 6037.56N respectively. The relative error is 0.8%. Thus, it indicates the simulation convergence can be guaranteed for 2.5 s simulation.
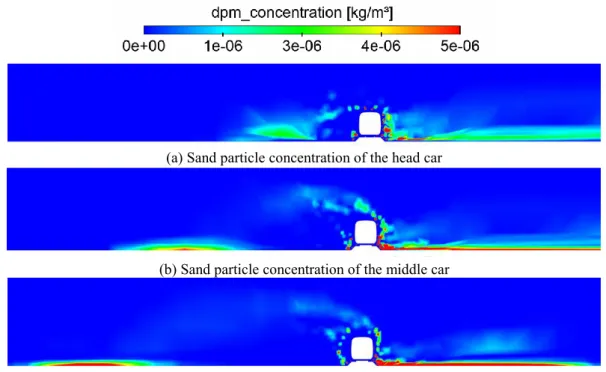
The sand impact force along the train running direction is showed in Fig. 11. The Fig. 11(a) shows the sand impact force in 1.2 s~2.5 s. Comparing to the sand impact force in 2.5 s-5 s showed in Fig. 11(b), it indicates that the simulation convergence can be guaranteed in 2.5 s simulation for the sand impact force showing regular fluctuations. Additionally, the sand particles in the air will increase with the longer simulation time, and considering (a) Sand particle concentration of the head car
(b) Sand particle concentration of the middle car
(c) Sand particle concentration on the tail
Fig. 14 sand particle concentration distribution on the lateral slice
(a) Top view
(b) Crosswind windward
(c) Crosswind leeward
(d) Upward view
Fig. 15 Sand particles impact magnitude force vector 494
(a) Longitudinal force on head train (b) Longitudinal force on middle train
(c) Longitudinal force on tail (d) Crosswise force on head
(e) Crosswise force on middle (f) Crosswise force on tail
(g) Vertical force on head train (h) Vertical force on middle Fig. 16 Continued 22 24 26 28 30 32 34 36 38 40 42 -10000 -8000 -6000 -4000 -2000 0 2000 4000 Lon git udina l forc e on hea d tra in(N) Crosswind speed (m/s) Pure wind Sand+wind 22 24 26 28 30 32 34 36 38 40 42 2000 2500 3000 3500 4000 4500 5000 5500 6000 6500 7000 7500 8000 Longit udi nal for ce on m iddl e t ra in(N ) Crosswind speed (m/s) Pure wind Sand+wind 22 24 26 28 30 32 34 36 38 40 42 4000 4500 5000 5500 6000 6500 7000 7500 8000 8500 9000 9500 10000 Lon git udina l forc e on ta il (N) Crosswind speed (m/s) Pure wind Sand+wind 22 24 26 28 30 32 34 36 38 40 42 60000 80000 100000 120000 140000 160000 Cross w ise f orc e on head( N ) Crosswind speed (m/s) Pure wind Sand+wind 22 24 26 28 30 32 34 36 38 40 42 60000 80000 100000 120000 140000 160000 Cross w ise f orc e on head( N ) Crosswind speed (m/s) Pure wind Sand+wind 22 24 26 28 30 32 34 36 38 40 42 0 5000 10000 15000 20000 25000 30000 35000 40000 45000 Cross w ise f orc e on t ai l(N ) Crosswind speed (m/s) Pure wind Sand+wind 22 24 26 28 30 32 34 36 38 40 42 80000 100000 120000 140000 160000 180000 200000 Vertiacal forc e on head train(N) Crosswind speed (m/s) Pure wind Sand+wind 22 24 26 28 30 32 34 36 38 40 42 80000 100000 120000 140000 160000 180000 200000 Vertiacal forc e on head train(N) Crosswind speed (m/s) Pure wind Sand+wind
Yani Zhang, Chen Jiang and Xuhe Zhan
the calculation resources and efficiency, the transient simulation time was sat as 2.5 s.
3. Numerical simulation results and discussions
3.1 The flow field around the train
In order to investigate the influence of the wind-blown sand on the flow field around the train, the velocity filed, pressure distribution and sand particles are analyzed in the flowing section. The case’s train speed is 200 km/h with wind speed of 35 m/s. The train flow field in the pure wind environment and windblown sand environment are compared.
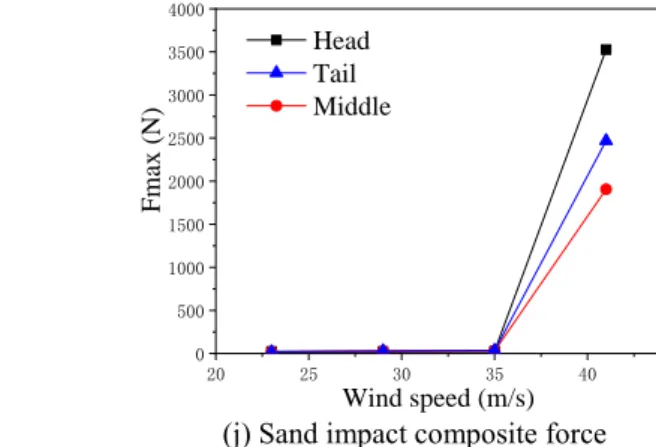
Table 2 Sand particle impact force values (N) on different cars at crosswind speed 41 m/s
41 m/s Fx Fy Fz Fmax
Head 1115.29 958.31 1165.95 3526.28
Middle 1238.89 467.43 313.24 1905.82
Tail 2014.18 643.17 384.56 2469.01
(i) Vertical force on tail (j) Sand impact composite force Fig. 16 Sand particle impact on train surface
(a) The longitudinal force acting on the train (b) The transverse force acting on the train
(c) The vertical force acing on the train (d) The maximum value of the sand particle force curve with train speed variation Fig. 17 The sand impact force effect on the train aerodynamic force with train speed variation
22 24 26 28 30 32 34 36 38 40 42 30000 35000 40000 45000 50000 55000 60000 65000 V er ti acal for ce on m iddl e t ra in(N ) Crosswind speed (m/s) Pure wind Sand+wind 20 25 30 35 40 45 0 500 1000 1500 2000 2500 3000 3500 4000 Fmax (N) Wind speed (m/s) Head Tail Middle 140 160 180 200 220 240 260 280 300 320 -5000 0 5000 10000 15000 Sand-middle Wind-middle Sand-tail Wind-tail Sand-head Wind-head
Longitudinal force acting on the tr
ian ( N ) Train speed (km/h) 140 160 180 200 220 240 260 280 300 320 0 20000 40000 60000 80000 100000 120000 140000 160000 Sand-tail Wind-tail Sand-middle Wind-middle Sand-head Wind-head Transeverse f
orce acting on the tra
in ( N ) Train speed (km/h) 140 160 180 200 220 240 260 280 300 320 40000 60000 80000 100000 120000 140000 160000 180000 200000 Wind-head Sand-head Wind-middle Sand-middle Wind-tail Sand-tail Vertical force acing on the train ( N ) Train speed(km/h) 140 160 180 200 220 240 260 280 300 320 40000 60000 80000 100000 120000 140000 160000 180000 200000 Wind-head Sand-head Wind-middle Sand-middle Wind-tail Sand-tail Vertical force acing on the train ( N ) Train speed(km/h) 496
The velocity and pressure value monitored position are showed inFig. 12. The pressure value is monitored on line A of head car surface. The velocity value is monitored on line B near the train surface, which Z=1.5 m.
Figs. 13(a)-13(c) show the pressure distribution on the windward and leeward of the train body. It indicates that the sand particles influence the leeward flow field mainly. Compared to the pure wind environment, it shows that, within the height of 2 m, the train leeward pressure increases in the windblown sand environment. At the height above 2 m, the sand particles lead to the pressure decrease in the train leeward side. Besides, the sand particles have little effect on the windward side flow field. The velocity around the train is showing in Fig. 13(d). Similar to the pressure distribution, the sand particles mainly effect the windward velocity value and leads to a fluctuation. The sand has little influence on the leeward side velocity value of the train.
The windblown sand particles in the flow field are influenced by the airflow around the train. Then the particles which collide on the train surface will impact the force acting on the train. Thus, the sand particles around the train are analyzed.
3.2 The sand impact force on the train surface The forces on the train surface in windblown sand condition includes two kinds of forces. The first is the change of train aerodynamic force caused by the sand influence on the flow field around the train. Another force is
generated when the wind-blown sand colliding on the train surface. These two forces act together on the train and will threat the train operation safety.
The sand impact force acting on the train surface will lead to erosion on the train surface. It will destroy the fatigue resistance of the material on train body. The sand particle impact force is calculated by a user defined method. Sand particles impact magnitude force vector on the train surface is showed in Fig. 15. The head car and middle car windward side wall greatly affected by sand impact force as showing in Figs. 15(a)-15(b) shows that the leeward side suffered less on the sand particles impact force. It effects the bogie cabin on the bottom on train seriously showing in Fig. 15(c). The reason is that the train bogie structure in the bottom is complex, thus, the airflow carries more sand particles into the area and collide on the train.
3.3 The comparison of windblown sand impact force and pure aerodynamic force
In this section, the cases with different crosswind speeds, train speeds, and sand particle’s diameters were simulated. The sand particle’s influence regulations on the train surfaces under different cases are analyzed by comparing sand particle impact force and train aerodynamic force connected with sand impact force. Additionally, the aerodynamic force under the pure wind flied and wind-blown sand particles were compared.
When the wind speed varies in the environment, the sand particles distribution in the air will be different. It will
(a) Head train (b) Middle
(c) Tail (d) Total force of sand particle impact force acting on the train Fig. 18 Sand impact force effect in the train with particle’s diameter variation
0.25 0.50 0.75 30 40 50 60 70 80 90 100 110 120 130 140 150 160 Fmax Fx Fy Fz Sand im pact force on hea d train ( N )
Sand particle diameter (mm)
0.25 0.50 0.75 20 40 60 80 100 120 140 160 180 Fmax Fx FY FZ Sand im pact force on m iddle train ( N )
Sand particle diameter (mm)
0.25 0.50 0.75 0 20 40 60 80 100 120 140 160 180 200
Sand particle diameter (mm) Fmax Fx FY FZ Sand im pact force on tail ( N ) ws 0.25 0.5 0.75 0.0 5.0x10⁴ 1.0x10⁵ 1.5x10⁵ 2.0x10⁵ 2.5x10⁵ 3.0x10⁵ 3.5x10⁵ 4.0x10⁵
Sand particle diameter (mm)
Fz Fy Fx Total force ( N )
Yani Zhang, Chen Jiang and Xuhe Zhan cause different impact on the forces train suffered during
operation. Thus, the cases under different cross-wind speed, were simulated to investigate the sand particle’s influence on the train operation safety. The wind speed is 23 m/s, 29 m/s, 35 m/s, and 41 m/s, respectively. The train aerodynamic force along the longitude, crosswise and vertical direction in the pure wind environment were compared with the forces connected with the sand impact force in the windblown sand environment. The force curves train suffered are showed in Fig. 16.
Fig. 16 shows that the drag force of the head train decreases with the crosswind speed increasing. The drag force of the middle train and tail increases with the crosswind speed increasing. The lateral force and lift force of the head car, the middle car and the tail car increase with the crosswind speed increase.
Fig. 16(b) shows that the effect of sand impact force on the middle train is less than 5% of the aerodynamic force in pure wind field when the wind speed bellow 35 m/h. When the wind speed larger than 35 m/s the force acting on the middle train in the wind-blown sand environment is larger than 32% of the force train suffered in the pure wind environment. Fig. 1(c) shows that the longitudinal force acting on the tail presenting the similar characteristics as the middle train. The force acting on the tail in windblown sand environment is 23% larger than it in the pure wind filed environment.
Fig. 16(d) shows that the crosswise force acting on the train is increasing with the crosswind speed increasing, the force acting on the tail in windblown sand environment is -3%, 8%, 1%,12% larger than it in the pure wind flied. The sand environment has little effect on the lateral force of the head and middle cars, and the vertical force has almost no effect by the windblown sand. Fig. 16(i) indicates that the composite force of the sand particle acting on the train increases with the wind speed increasing. Especially, the force value increased obviously when the wind speed largerthan 35 m/s It inferred from the analyzation that the aerodynamic force dominates head car resistance increasement when the crosswind speed bellow 35 m/s. Additionally, when the crosswind speed is 41m/s, the sand impact force contributes to the increasement of the resistance mainly. The windblown sand effect on the vertical force acting on the train is less than 3% comparing to the pure wind field.
Table 2 shows the sand particle impact force value on the train when the crosswind speed is 41 m/s. It shows the sand particle impact force along the train running direction is larger than 1000 N. As it showed in Figs. 16(a)-16(c) in the case which the wind speed is 41 m/s, the sand particle impact force influences the longitudinal force acting on the train obviously. The reason is that the when the wind speed is 41 m/s, the sand particles concentration is larger than other cases, then the number of the particles collide on the train surfaces is more than other cases. Thus, it come to a conclusion that the sand particles concentration in the flow field is an important factor for the windblown sand impact on the train.
When the train running with different speed in the open air, the flow field around the train are different. Therefore,
the four cases with different train speed in windblown sand environment are simulated in this section. The train speeds are 160 km/h, 200 km/h, 250 kn/h, 300 km/h separately. The crosswind speed is 35m/s with same sand particle concentration in the air. In Fig. 17, in order to analyze the train running speed effect on sand impact force on the train surface, the train aerodynamic forces along the longitude, crosswise and vertical direction in the pure wind environment were compared with the forces in the in the windblown sand environment, which are included the sand impact force. Fig. 17(a) showed that the train resistance varies with the train speed increases. The tail resistance in the pure wind environment is larger than it in the windblown sand environment in the cases the train speed blow 300km/h. The resistance in the sand environment is 1.3% larger than it in the pure wind environment in the case which the train speed is 300km/h.
Fig. 17(b) shows when the wind speed is 35 m/s, the sand particles effect the crosswise force acting on the tail mainly. Comparing to the pure wind environment, the crosswise force in four different train speed cases increase 9%, 1%, 15%, and 6% respectively. The sand effect on the crosswise force acting on the middle train is less than 1%.
Fig. 17(d) shows the sand particle impact force carves with different train speed. The maximum value of the sand particle impact force acting on the train surface increases with the train speed increasing. The Fx means the sand particle impact force along the train running direction, and it is larger than the crosswise force Fy and vertical force Fz. It indicates the sand particle force effects the train resistance obviously.
The sand particle impact force is relevant to the sand particle diameter. The influence of the sand particle diameter on the sand particle impact force on train surface is investigated in this section. The three cases with different sand particle diameters in the same windblown sand environment were simulated. The diameters are 0.25 mm, 0.5 mm, 0.75 mm, respectively. The maximum value of the sand particle impact force acting on the head, middle and tail train were analyzed in Fig. 18.
Figs. 18(a)-18(c) show that the sand impact force maximum value along the longitude direction is the largest comparing to the other two directions. The reason is that there are more sand particles colliding on the train surface along the train running direction. Additionally, the maximum value of the sand particle impact force acting on the head, middle and tail train increase with the sand particle diameter increasing. The tail increased obviously. The reason is that the wake flow of the train is more complicate and more particle were carried into the airflow around the train. Fig. 18(d) shows the total force of sand particle impact force and aerodynamic force acting on the train. It indicates the total force almost didn’t vary with sand particle diameter increase. The reason is that the crosswind speed of simulated cases is 35 m/s. In this situation the particle volume fraction in the air is small. Then the impact force colliding on the train surface account for a small proportion of the total force comparting to the aerodynamic force.
4. Conclusions
This study investigated the sand-wind two phase flow effect on the high-speed train. One calculation method based on Hertzian sphere ball impact theory for the windblown sand impact force on the train surface was proposed. The different cases, including various wind velocity, train speed, sand particle diameter, were simulated when the train running in the wind-sand environment. The train aerodynamic force in the pure wind and total force including the sand particle impact force acting on the train in sand environment were compared.
Comparing to the pure wind environment, the windblown sand mainly influences the train windward flow field, and has little effect on the train leeward flow field. Particle’s concentration in the windward is larger than in the train leeward side effected by the airflow around the train. The head train, train side wall and bogie cabin suffered seriously to the windblown sand erosion.
Head car longitudinal force increases with wind speed increasing, and the increase becomes larger. When the crosswind speed is larger than 35m/s, the effect of the wind sand environment on the train increases obviously. The longitudinal force on the head car increases 23% comparing to the head car drag in the pure wind environment. The crosswise force of the tail is 12% lager than it in pure wind environment. The sand particle in the flow flied have little influence on the crosswise force of head car and middle car. The vertical force has the same pattern as the crosswise force. Sand impact force increases with the increasing train speed and sand particle diameter under the same particle mass flow rate. It comes to a conclusion that the sand concentration in the air is the most important factor which influences the sand impact force on the train.
The investigation results in this paper are expected to provide references to the study of high-speed train operation safety in wind-sand environment. However, the Hertzian impact theory only considers the normal impact force of windblown sand particles. The future studies on windblown sands environment for high-speed train should work on the more realistic and comprehensive sand particle impact models.
Acknowledgements
Authors appreciate the supports from, National Key Research and Development Program of China (Grant No.2020YFA0710901), National Natural Science Foundation of China (Grant No. 1202395), Science Foundation of Hunan Province (Grant No. 2019JJ50790), and Start-up funding of Central South University of China.
References
Aa, A., Mm, A., Sj, A., Oyb, C., Aa, A. and Ma, A. (2020), “Cfd numerical simulation of standalone sand screen erosion due to gas-sand flow”, J. Nat. Gas Sci. Eng., 85. https://doi.org/10.1016/j.jngse.2020.103706.
Anderson, J.D. (1995), Computational Fluid Dynamics: The
Basics With Applications. McGraw-Hill, New York, U.S.A. Finnie, I. (1960), Erosion of Surfaces by Solid Particles[J] Wear.
3. 87-103. https://doi.org/10.1016/0043-1648(60)90055-7 Hunter, S.C. (1957), “Energy absorbed by elastic waves during
impact”, J. Mech. Phys. Solids, 5(3), 162-171. https://doi.org/10.1016/0022-5096(57)90002-9.
Jiang, F.Q., Li, Y., Li, K.C., Cheng, J.J., Xue, C.X. and Ge, S.C. (2010), “Study on structural characteristics of Gobi wind sand flow in 100 km wind area along Lan-xin railway”, J. China Railway Soc., 3. https://doi.org/10.3969/j.issn.1001-8360.2010.03.019
Ke, S.T., Dong, Y.F., Zhu, R.K. and Wang, T.G. (2020), “Wind-sand coupling movement induced by strong typhoon and its influences on aerodynamic force distribution of the wind turbine”, Wind Struct., 30(4), 433-450.
https://doi.org/10.12989/was.2020.30.4.433.
Khan, R., Ya, H.H., Pao, W., Abdullah, M. and Dzubir, F.A. (2020), “Influence of sand fines transport velocity on erosion-corrosion phenomena of carbon steel 90-degree elbow”, Metals -Open Access Metallurgy J., 10(5), 626. https://doi.org/10.3390/met10050626.
Liu, T.H. and Zhang, J. (2013), “Effect of landform on aerodynamic performance of high-speed trains in cutting under cross wind”, J. Central South Univ., 20(3), 830-836. https://doi.org/10.1007/s11771-013-1554-3
McLaskeya, G.C. and Glaser, S.D. (2010), “Hertzian impact: Experimental study of the force pulse and resulting stress waves”, J. Acoustic. Soc. Amer., 128(3), 1087-1096. https://doi.org/10.1121/1.3466847.
Moris, S.A. and Alexander, A.J. (1972), “An investigation of particle trajectories in two-phase flow systems”, J. Fluid Mech., 55(2), 193-208. https://doi.org/10.1017/S0022112072001806. Niu, J., Liang, X. and Zhou, D. (2016), “Experimental study on
the effect of Reynolds number on aerodynamic performance of high-speed train with and without yaw angle”, J. Wind Eng. Ind. Aerod., 157, 36-46. https://doi.org/10.1016/j.jweia.2016.08.007. Niu, J., Zhou, D. and Wang, Y. (2018), “Numerical comparison of aerodynamic performance of stationary and moving trains with or without windbreak wall under crosswind”, J. Wind Eng. Ind. Aerod., 182, 1-15. https://doi.org/10.1016/j.jweia.2018.09.011. Paz, C., Suarez, E., Gil, C. and Concheiro, M. (2015), “Numerical
study of the impact of windblown sand particles on a high-speed train”, J. Wind Eng. Ind. Aerod., 145, 87-93. https://doi.org/10.1016/j.jweia.2015.06.008.
Sarafrazi, V. and Talaee, M.R. (2019), “Numerical simulation of sand transfer in wind storm using the eulerian-lagrangian two-phase flow model”, Europ. Phys. J. E., 42(4), https://doi.org/10.1140/epje/i2019-11809-8.
Smyth, T.A. (2016), “A review of computational fluid dynamics (cfd) airflow modelling over aeolian landforms”, Aeolian Res., 22, 153-164. https://doi.org/10.1016/j.aeolia.2016.07.003. Wang, T.T., Jiang, C.W., Gao, Z.X. and Lee, C.H. (2017),
“Numerical simulation of sand load applied on high-speed train in sand environment”, J. Central South Univ., 24(2), 442-447. https://doi.org/10.1007/s11771-017-3446-4.
Xin, L.G., Cheng, J.J., Chen, B.Y. and Weng, R. (2018), “The motion rule of sand particles under control of the sand transportation engineering”, Wind Struct., 27(4), 213-221. https://doi.org/10.12989/was.2018.27.4.213.
Xiong, H.B., Yu, W.G., Chen, D.W. and Shao, X.M. (2011), “Numerical study on the aerodynamic performance and safe running of high-speed trains in sandstorms”, J. Zhejiang Univ. Sci. A, 12(12), 971-978.
https://doi.org/10.1631/jzus.A11GT005.