INTRODUCTION
Determining the appropriate orientation and location for glenoid components and assessing glenoid bone loss are very important for successful reverse total shoulder arthroplasty (RTSA) [1], be-cause malpositioning of the glenoid component can result in ear-ly component loosening, failure, and instability [2,3]. Therefore, precise evaluation for glenoid version and inclination is essential
Background: This study was performed to compare glenoid version and inclination measured using two-dimensional (2D) images from computed tomography (CT) scans or three-dimensional (3D) reconstructed bone models.
Methods: Thirty patients who had undergone conventional CT scans were included. Two orthopedic surgeons measured glenoid version and inclination three times on 2D images from CT scans (2D measurement), and two other orthopedic surgeons performed the same mea-surements using 3D reconstructed bone models (3D measurement). The 3D-reconstructed bone models were acquired and measured with Mimics and 3-Matics (Materialise).
Results: Mean glenoid version and inclination in 2D measurements were –1.705° and 9.08°, respectively, while those in 3D measurements were 2.635° and 7.23°. The intra-observer reliability in 2D measurements was 0.605 and 0.698, respectively, while that in 3D measurements was 0.883 and 0.892. The inter-observer reliability in 2D measurements was 0.456 and 0.374, respectively, while that in 3D measurements was 0.853 and 0.845.
Conclusions: The difference between 2D and 3D measurements is not due to differences in image data but to the use of different tools. However, more consistent results were obtained in 3D measurement. Therefore, 3D measurement can be a good alternative for measuring glenoid version and inclination.
Keywords: Glenoid version; Glenoid inclination; 2D measurement; 3D measurement Clin Shoulder Elbow 2020;23(3):119-124
https://doi.org/10.5397/cise.2020.00220
Comparative study of glenoid version and inclination using
two-dimensional images from computed tomography and
three-dimensional reconstructed bone models
Chang-Hyuk Choi, Hee-Chan Kim, Daewon Kang, Jun-Young Kim
Department of Orthopedic Surgery, School of Medicine, Catholic University of Daegu, Daegu, KoreaReceived: August 4, 2020 Revised: August 24, 2020 Accepted: August 24, 2020 Correspondence to: Jun-Young Kim
Department of Orthopedic Surgery, School of Medicine, Catholic University of Daegu, 33 Duryugongwon-ro 17-gil, Nam-gu, Daegu 42472, Korea Tel: +82-53-650-3068, E-mail: [email protected], ORCID: https://orcid.org/0000-0003-4700-3041
IRB approval: School of Medicine, Catholic University of Daegu (No. CR-19-090-L). Financial support: None.
Conflict of interest: None.
for preoperative RTSA planning procedures.
Conventional two-dimensional (2D) computed tomography (CT) images have been used as the gold standard to evaluate gle-noid version and inclination [4,5]. However, the accuracy of measurement based on 2D images from CT scans (2D measure-ment) depends on factors of the scapula plane, which can change based on patient positioning and scapula orientation (rotation or abduction) [6]. Furthermore, the results of 2D measurement can eISSN 2288-8721
Copyright© 2020 Korean Shoulder and Elbow Society. All Rights Reserved.
This is an Open Access article distributed under the terms of the Creative Commons Attribution Non-Commercial License (http://creativecommons.org/licenses/by-nc/4.0/) which permits unrestricted non-commercial use, distribution, and reproduction in any medium, provided the original work is properly cited.
differ depending on choice of axial or coronal plane. Recently, several studies have indicated that measurement using three-di-mensional (3D)-reconstructed bone models (3D measurement) for glenoid version and inclination is more accurate than 2D measurement [4,7,8]. More advanced analysis using software al-lows analysis of the scapula regardless of orientation [9]. There-fore, this study was performed to compare glenoid version and inclination in 2D and 3D measurements.
METHODS
Ethical Approval
This study was approved by the Institutional Review Board of School of Medicine, Catholic University of Daegu (IRB No. CR-19-090-L). Informed consent was obtained from all patients in-cluded in this study, who agreed to study publication including use of radiographic images.
Demographic Data
The population comprised 30 patients (7 males and 23 females) who had undergone conventional CT scans with the GE Revolu-tion CT system (GE Healthcare, Little Chalfont, UK) in our hos-pital between May 2018 and September 2019. The slice thickness of each image was 2.0 mm. The underlying diseases were cuff tear arthropathy (23 cases), osteoarthritis (two cases), avascular necrosis of the humeral head (two cases), nonunion after proxi-mal humerus fracture (two cases), and rheumatoid arthritis (one case). The mean age was 73 years (range, 58–86 years). Two or-thopedic surgeons (CHC and DK) measured glenoid version and inclination three times with 2D measurements, and another two orthopedic surgeons (JYK and HCK) performed the same using 3D measurements. A specialist and a resident were assigned to each group to account for ability and career knowledge.
2D Measurement
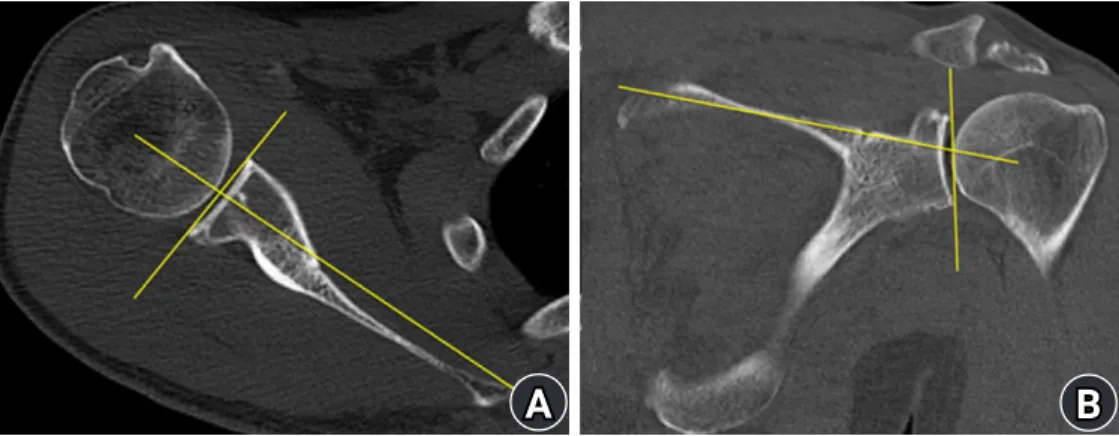
The 2D axial and coronal images from CT scans were used to measure glenoid version and inclination, respectively. For mea-suring glenoid version, we first marked two landmarks: (1) the center of the glenoid fossa and (2) the most medial location of the scapula on the first axial image below the coracoid process of the glenoid. This location represents the diameter of the glenoid, as this is where it is largest considering the anatomy of the gleno-humeral joint and 2-mm slice thickness. Second, we drew a transverse line between the two points to define the anatomical axis of the scapula [10]. Third, we drew a straight line between the anterior and posterior margins of the glenoid fossa. Finally, we measured the angle between the two lines (Fig. 1A); a positive value indicated anteversion. Conversely, a negative value indicat-ed retroversion.
For measuring glenoid inclination, a line was initially drawn along the most inferior margin of the supraspinatus fossa after se-lecting the coronal plane of the glenoid with the largest diameter [11]. Second, we drew a straight line between the superior and in-ferior margins of the glenoid fossa in that same coronal plane. Fi-nally, we measured the angle between the two lines (Fig. 1B).
3D Measurement
The 3D measurement comprised the following four steps: (1) segmentation and 3D bone model reconstruction, (2) creation of a best-fit circle and sphere and identifying the center of the gle-noid fossa, (3) creating three reference planes, and (4) measuring glenoid version and inclination. We used Mimics (Materialise, Leuven, Belgium) for 3D bone model reconstruction and 3-Mat-ic (Materialise) for 3D measurement.
Segmentation and 3D bone model reconstruction
Axial and coronal images from CT scans were formatted as
Digi-Fig. 1. Two-dimensional measurement of glenoid version and inclination. (A) Glenoid version. (B) Glenoid inclination.
B
A
tal Imaging and Communications in Medicine (DICOM) image files. We used Mimics to create the 3D reconstructed bone mod-els as follows. First, the threshold level was selected based on Hounsfield units to mark the skeletal region in the CT images. Second, the boundary of the skeletal region was adjusted using the split mask function. Third, manual mask editing was con-ducted to fill the holes on the surface of the skeletal region. Fourth, a 3D-reconstructed model was created. Finally, wrapping and smoothing techniques were applied to decrease the surface roughness of the 3D reconstructed model [12].
Best-fit circle and sphere creation and identification of the center of the glenoid fossa
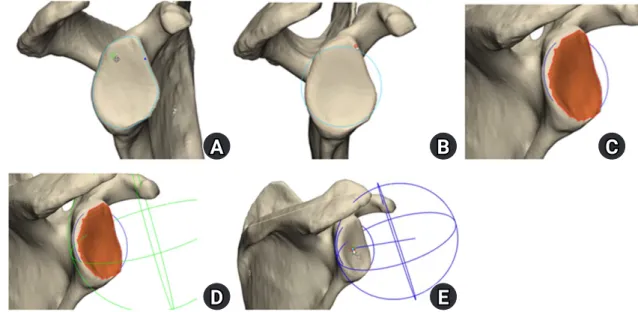
We created the anatomical best-fit circle and sphere to determine the center of the glenoid fossa. First, several points on the margin of the glenoid were marked (Fig. 2A). Second, we set the best-fit circle based on the identified points (Fig. 2B). The best-fit circle was determined by production of a circle based on the coordinates of the points above the glenoid margin with as little error as possible. Third, the inner surface of the glenoid fossa was marked (Fig. 2C). Fourth, we set the best-fit sphere based on the coordinate values of the glenoid inner surface (Fig. 2D). Finally, we drew a line between the center of the circle and sphere and marked the center of the glenoid fossa by extending the line (Fig. 2E).
Reference planes
The scapular anatomical plane (SAP) was defined as the coronal plane containing the following three landmarks: (1) the center of
the glenoid fossa, (2) the most inferior spot of the scapula body, (3) the intersection of the scapula spine and medial border (3rd point) (Fig. 3A) [2]. The axial anatomical plane was determined as that passing through the 3rd point and glenoid center while perpendicular to the SAP (Fig. 3B). The sagittal anatomical plane was defined as that passing through the glenoid center while ver-tical to the SAP and axial anatomical planes (Fig. 3B).
Measurement of glenoid version and inclination
We defined the anatomical axis as the line connecting the centers of the best-fit circle and sphere. Glenoid version was described as the angle between the anatomical axis and SAP (Fig. 4A). Gle-noid inclination was the angle between the anatomical axis and the axial anatomical plane (Fig. 4B) [2,9].
Statistical Analysis
Independent t-test and Pearson’s correlation analysis were ap-plied to compare the results between 2D and 3D measurements, including glenoid version and inclination. IBM SPSS ver. 19.0 (IBM Corp., Armonk, NY, USA) was utilized for statistical analy-sis, with P<0.05 indicating statistical significance.
RESULTS
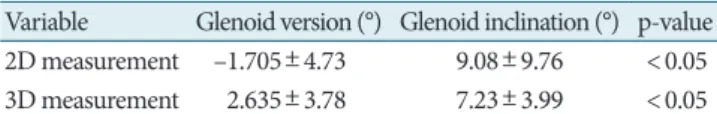
Mean glenoid version and inclination in 2D measurements were –1.705° (standard deviation [SD], 4.73°) and 9.08° (SD, 9.76°), respectively, while those in 3D measurements were 2.635° (SD, 3.78°) and 7.23° (SD, 3.99°) (Table 1). These results indicate
sta-B
D
A
C
E
Fig. 2. Making best-fit circle and sphere, and finding out the center of glenoid fossa. (A) Several points on the margin of glenoid is marked and connected. (B) Best-fit circle. (C) Inner surface of the glenoid fossa is marked. (D) Best-fit sphere. (E) The center of the glenoid fossa.
tistically different mean glenoid version and inclination between the two measurement methods. The result also indicates that 3D measurement is more consistent than 2D measurement. Intra- and inter-observer reliabilities were determined for glenoid version and inclination with 2D and 3D measurements. The intra-observer re-liability for glenoid version and inclination in 2D measurement was 0.605 and 0.698, respectively, while that in 3D measurement was 0.883 and 0.892 (Table 2). The inter-observer reliability for glenoid version and inclination in 2D measurement was 0.456 and 0.374, respectively, while that in 3D measurement was 0.853 and 0.845, respectively (Table 3). These outcomes show higher reliabili-ty of 3D measurement than that of 2D measurement.
DISCUSSION
Preoperative assessment of glenoid version and inclination is im-portant for implantation in RTSA. Conventional 2D images from CT scans have primarily been used to evaluate these values. However, measurement of glenoid version and inclination on ra-diographic images from CT scans have several drawbacks [6,13 -16]. The first is that reference planes can be determined
differ-ently based on patient position and scapula orientation. Second, the reference plane setup can differ based on wear pattern and asymmetric shape of the glenoid. Third, it is more difficult to precisely set the reference planes with thicker CT slice thickness. Fourth, when measuring glenoid version and inclination, indis-tinct shapes of anatomical landmarks can result in measurement errors. Because of these shortcomings, 3D-reconstructed bone models (3D measurement) have been introduced for measuring glenoid version and inclination. Several studies have shown that 3D measurement of glenoid version and inclination was more accurate than 2D measurement [4,7,8]. Despite the advantages, 3D measurement is more costly and time consuming than 2D measurement. In this study, 2D measurement in each case could be completed within an average of 3 minutes, while that of 3D measurement required about 15 minutes.
In this study, difference was shown in mean values calculated by the two measurement methods. The results also showed dif-fering intra- and inter-observer reliability, with more consistent values using 3D measurement. However, it is difficult to deter-mine if 3D measurement is superior to 2D measurement based on assessment by different measurement tools. As 2D images from CT scans are attained in the supine position, it is highly likely that scapula orientation is reflected. Furthermore, the out-comes of 2D measurement can differ depending on use of the axial or coronal plane. However, in 3D measurement, scapula Fig. 3. Making three reference planes. (A) Three landmarks. (B)
Three reference planes.
B
A
B
A
Fig. 4. Measurement of glenoid version and inclination. (A) Glenoid version is defined as the angle between the anatomical axis and scap-ular anatomical plane. (B) Glenoid inclination is decided as the angle between the anatomical axis and axial anatomical plane.
Table 1. Mean and standard deviation in two different measurement methods
Variable Glenoid version (°) Glenoid inclination (°) p-value
2D measurement –1.705±4.73 9.08±9.76 <0.05
3D measurement 2.635±3.78 7.23±3.99 <0.05
Values are presented as mean±standard deviation. 2D: two-dimensional, 3D: three-dimensional.
Table 2. Intra-observer reliability
Variable Glenoid version Glenoid inclination
2D measurement 0.605 0.698
3D measurement 0.883 0.892
p<0.001.
2D: two-dimensional, 3D: three-dimensional.
Table 3. Inter-observer reliability
Variable Glenoid version Glenoid inclination
2D measurement 0.456 0.374
3D measurement 0.853 0.845
p<0.001.
orientation and patient position are not considered because of the use of 3D-reconstructed bone models.
In addition, the 2D and 3D measurements suggest different outcomes due to the difference in measurement space. In 2D measurement, the angle between two lines is utilized to measure glenoid version and inclination. However, as the lines are mea-sured by shadows projected on the 2D plane, they do not reflect accurate anatomy. In comparison, in 3D measurement, glenoid version and inclination are measured as the angle between a line and plane and is more likely to represent reality because the line is not projected on the 2D plane.
In a previous study [2], the inner surface of the glenoid fossa was assumed to be a part of the sphere, and glenoid version and inclination were measured using the best-fit sphere method. However, because the inner surface of the glenoid fossa is not a perfect sphere, error can result when determining the precise lo-cation of the glenoid center. To reduce the probability of this er-ror, we created a best-fit circle based on the coordinates of several points in the glenoid margin. Then, the line connecting the cen-ters of the sphere and circle was set as the anatomical axis, and the point where the extension of this axis met the inner surface of the glenoid was defined as the glenoid center. If the margin of the glenoid is distorted due to other causes such as osteophytes or deformities, there is a possibility for an associated error in identification of the glenoid center. However, it is thought that a more accurate glenoid center can be determined when using the best-fit circle method “together” rather than the best-fit sphere method alone.
This study had several limitations. First, we did not consider patient positioning or scapula orientation. Second, there may be observation error in setting the anatomical axis and several coor-dinate values in 3D measurement. Third, the population of the study was collected from a single hospital and was small. Fourth, only static images that did not reflect range of motion were used. Finally, the difference in measurer abilities according to experi-ence was not considered.
In summary, the difference between 2D and 3D measurements is not due to differences in image data but to use of different tools. However, more consistent results were obtained in 3D measurement. Additionally, detailed analysis of preoperative 3D images could be very helpful during operation. Therefore, 3D measurement can be a good alternative for measuring glenoid version and inclination.
ORCID
Chang-Hyuk Choi https://orcid.org/0000-0003-1201-9828
Hee-Chan Kim https://orcid.org/0000-0003-2210-0662 Daewon Kang https://orcid.org/0000-0001-6730-4816 Jun-Young Kim https://orcid.org/0000-0003-4700-3041
REFERENCES
1. Walch G, Mesiha M, Boileau P, et al. Three-dimensional assess-ment of the dimensions of the osteoarthritic glenoid. Bone Joint J 2013;95:1377-82.
2. Boileau P, Cheval D, Gauci MO, Holzer N, Chaoui J, Walch G. Automated Three-dimensional measurement of glenoid ver-sion and inclination in arthritic shoulders. J Bone Joint Surg Am 2018;100:57-65.
3. Farron A, Terrier A, Büchler P. Risks of loosening of a prosthet-ic glenoid implanted in retroversion. J Shoulder Elbow Surg 2006;15:521-6.
4. Budge MD, Lewis GS, Schaefer E, Coquia S, Flemming DJ, Armstrong AD. Comparison of standard two-dimensional and three-dimensional corrected glenoid version measurements. J Shoulder Elbow Surg 2011;20:577-83.
5. Friedman RJ, Hawthorne KB, Genez BM. The use of computer-ized tomography in the measurement of glenoid version. J Bone Joint Surg Am 1992;74:1032-7.
6. Bokor DJ, O'Sullivan MD, Hazan GJ. Variability of measure-ment of glenoid version on computed tomography scan. J Shoulder Elbow Surg 1999;8:595-8.
7. Lewis GS, Armstrong AD. Glenoid spherical orientation and version. J Shoulder Elbow Surg 2011;20:3-11.
8. Ganapathi A, McCarron JA, Chen X, Iannotti JP. Predicting normal glenoid version from the pathologic scapula: a compar-ison of 4 methods in 2- and 3-dimensional models. J Shoulder Elbow Surg 2011;20:234-44.
9. Mizuno N, Nonaka S, Ozaki R, Yoshida M, Yoneda M, Walch G. Three-dimensional assessment of the normal Japanese glenoid and comparison with the normal French glenoid. Orthop Trau-matol Surg Res 2017;103:1271-5.
10. Friedman RJ. Glenohumeral translation after total shoulder ar-throplasty. J Shoulder Elbow Surg 1992;1:312-6.
11. Maurer A, Fucentese SF, Pfirrmann CW, et al. Assessment of glenoid inclination on routine clinical radiographs and comput-ed tomography examinations of the shoulder. J Shoulder Elbow Surg 2012;21:1096-103.
12. Hohne KH, Bernstein R. Shading 3D-images from CT using gray-level gradients. IEEE Trans Med Imaging 1986;5:45-7. 13. Hoenecke HR Jr, Hermida JC, Flores-Hernandez C, D'Lima
DD. Accuracy of CT-based measurements of glenoid version for total shoulder arthroplasty. J Shoulder Elbow Surg
2010;19:166-71.
14. Bryce CD, Davison AC, Lewis GS, Wang L, Flemming DJ, Arm-strong AD. Two-dimensional glenoid version measurements vary with coronal and sagittal scapular rotation. J Bone Joint Surg Am 2010;92:692-9.
15. Bercik MJ, Kruse K 2nd, Yalizis M, Gauci MO, Chaoui J, Walch G. A modification to the Walch classification of the glenoid in
primary glenohumeral osteoarthritis using three-dimensional imaging. J Shoulder Elbow Surg 2016;25:1601-6.
16. Sabesan VJ, Callanan M, Youderian A, Iannotti JP. 3D CT as-sessment of the relationship between humeral head alignment and glenoid retroversion in glenohumeral osteoarthritis. J Bone Joint Surg Am 2014;96:e64.