41
ISSN: 2288-2766 © 2021 KODISA & EABEA. http://eajbe.jams.or.kr
doi: http://dx.doi.org/10.20498/eajbe.2021.9.1.41
Analysis on Output Efficiency of Chinese Listed Port Companies
Based on DEA Model*
1*Yan XU
1, Hyung-Ho KIM
21 First Author
Professor, School of Business, Huaihua University, Hunan, China.
E-mail:[email protected]
2 Corresponding Author
Dept. of Air Transport and Logistics, Sehan University, Korea.
E-mail:[email protected]
Received: December 04, 2020. Revised: February 02, 2021. Accepted: February 15, 2021.
Abstract
Purpose
–
The purpose of this study is to propose strategies of improving efficiency of 20 listed port companies in China based on analysis of their input-output indexes from 2014 to 2018.Research design, data, and methodology
–
In this paper, the relevant input-output indicators of 20 listed port companies in China from 2014 to 2018 were adopted. Data derived from the company annual reports announced by Shanghai stock exchange and Shenzhen stock exchange. Comprehensive efficiency and pure technical efficiency were measured from output perspective by DEA and Malmquist index, and efficiency changes and regional efficiency were analyzed.Result
–
The results showed that the efficiency value of 20 listed port companies in China fluctuated and increased during 2014-2018, regional efficiency was unbalanced, and change of MPI was influenced by internal factors and external factors. Listed port companies affected by internal and external factors needed to make appropriate response to internal and external factors.Conclusion
–
The research conclusion can provide important reference information about management and planning for port companies in China and related areas. However, this paper is limited to the availability of data. So the improvement scheme for listed companies in inefficient regional ports needs further study, such as using AHP method.Keywords:
Listed Port Companies, Efficiency, DEA, Malmquist index, TECI, TCI JEL Classification Code: C8, L7, M0.* Acknowledgement: This study was supported by the Sehan University Research fund in 2021. ⓒ Copyright: The Author(s)
This is an Open Access article distributed under the terms of the Creative Commons Attribution Non-Commercial License (http://Creativecommons.org/licenses/by-nc/4.0/) which permits unrestricted noncommercial use, distribution, and reproduction in any medium, provided the original work is properly cited.
42
1. Introduction
With the rapid development of economic globalization and regional economic integration, the shipping trade among countries in the world has been on a straight upward trend, and maritime transport trade accounts for more than two thirds of the total trade. As the window of foreign trade and the hub of land and water transportation, ports play an important role in promoting regional economic development and international trade and exchange. Modern ports are not only transportation hubs, but also catalysts for economic and trade development. They generate huge commercial radiation to surrounding areas and hinterlands, so as to promote the development of regional economy and trade (Dong, 2016). Since China's reform and opening up, the rapid economic development has greatly promoted the development of listed port companies. China's listed port companies have increased their investment in fixed assets, current assets, employees and main business costs, but it should also be noted that there are still some waste in allocation of resources. There is a lot of room for improvement in efficiency.
Figure 1: Investment in Fixed Assets of Listed Port Companies in China from 2014 to 2018
Taking fixed assets investment as an example, the author has consulted the annual report of listed port companies in China. The current situation of fixed assets investment of listed port companies in China in the past five years is shown in figure 1.
Figure 1 shows that during the five-year period from 2014 to 2018, the fixed assets input of listed port companies in China changed every year, remaining at a relatively high level and showing an upward trend, especially Shanghai port, Ningbo port, Qingang stock and Dalian port. The investment of fixed assets in Merchant ports increased rapidly in 2018.
Although the development of port construction is rapid, there are also a lot of waste of resources. Therefore, it is necessary to evaluate the efficiency of listed port companies. To evaluate the efficiency of listed port companies can not only helps related companies to improve management problems and improve their own efficiency, but also provides important reference information for port management and planning of countries and related regions.
0.00 500000.00 1000000.00 1500000.00 2000000.00 2500000.00 3000000.00 3500000.00 4000000.00 2014 2015 2016 2017 2018
43 This study involves the development status of input-output of China's listed companies, and its purpose is to analyze their efficiency. Firstly, this paper uses DEA to measure the comprehensive efficiency of 20 listed port companies in China from 2014 to 2018.Subsequently, this paper uses Malmquist productivity index to conduct a dynamic analysis of the efficiency changes of 20 listed port companies from 2014 to 2018, and studies the impact of technological efficiency changes and technological progress on TFP. Its significance lies in finding efficient and non-efficient listed companies of foreign trade port and pointing out the direction of improvement.
Compared to current research, the innovations of this paper are as follows. First, the input variable increased the payable employee compensation which was not included in the previous study. Second, the Malmquist index was used to analyze the dynamic efficiency changes of 20 listed port companies during the four periods from 2014 to 2018 and the sample size and space were expanded as far as possible to ensure the stability of the empirical analysis results.
2. Literature Review
Foreign scholars started early in the study of port efficiency and made relatively more achievements. DEA is used to analyze the efficiency of national ports. Its basic idea is: each Unit or department to be evaluated is regarded as a Decision Making Unit (DMU for short), and the evaluation group is constituted by DMUs. Each DMU in the same evaluation group has the same kind of resource consumption, that is, each DMU has the same input index and the same output index (Li, Jeon, & Kim, 2020). For example, DEA method is used to classify ports according to their size, infrastructure construction and port functions, in order to analyze Australia and 12 other important international ports (Tone, 2001). Judging whether the DEA is valid according to the data observed on each DMU is essentially judging whether it is located on the “production frontier” of the production possible set (Yan, Kim, & Yang, 2020). According to the complexity of ports, the efficiency of 26 ports in Spain from 1993 to 1997 was studied (Martine-Budria, Diaz-Armas, Navarro-Ibanez, & Ravelo-Mesa, 1999). The efficiency of American 25 ports from 1998 to 2003 was studied (Borenstein, 2004). Some scholars analyze the efficiency of ports in the world. For example, DEA method was used to analyze the efficiency of 31 major ports in the Asia-Pacific region in 2003 (Cullinane, 2004), and to measure the efficiency of six major ports in West Africa from 2006 to 2012 (Vandyck, 2015).
Domestic scholars study on port efficiency relatively late. Firstly, the efficiency of coastal ports was analyzed. Pang (2006) found out the length of port berths and the number of port berths were selected as input indexes by DEA method, and the total port throughput as output indexes, in order to study the technical efficiency, scale efficiency and pure technical efficiency of 50 coastal ports in China. Secondly, comparative analysis was made on the efficiency of coastal ports and inland ports. SBM-DEA method was used to study the efficiency of 14 inland ports and 17 coastal ports in China, and relevant suggestions were put forward to improve efficiency of Chinese ports by Feng, Chen and Huang (2017). Thirdly, from the perspective of enterprise operation, SBM-DEA model is adopted to measure the operation efficiency of listed companies by Kuang and Chen (2007). Fourthly, to analyze the influence factors of port efficiency, DEA efficiency evaluation model and principal component analysis method were used to study the factors affecting the efficiency of eight main port in China by Wang and Bi (2010). Through empirical study of six big port, Ding (2018) found out the factors that influence efficiency of port and proposed the relevant countermeasure.
Through the review of relevant literature, it can be found that, on the one hand, we should learn from the research results of foreign scholars and fully absorb their essence, which is conducive to analyze efficiency of port enterprises, discover the shortcomings in their operations and timely improve them, so as to improve efficiency of enterprises and enhance their competitiveness. On the other hand, the study on the efficiency of port enterprises should also be combined with China's characteristics, instead of blindly copying foreign management and operation models. The innovations of this paper are as follows. First, most domestic and foreign scholars talk about efficiency from the perspective of port operation, while few literatures discuss efficiency from the perspective of port enterprises. In this paper, DEA and Malmquist are used to analyze the operating efficiency of listed port companies in China from the perspective of enterprise operation. Second, Input variable of salary payable to employees is added, which is not found in previous study. It not only considers enterprise’s “people” factor, but also combines enterprise’s cost input factor. Third, in this paper, Malmquist index was used to analyze dynamic changes in efficiency of 20 listed port companies during five periods from 2014 to 2018, and the sample size and space were expanded as far as possible to ensure the stability of empirical analysis results.
44
3. Analytical Methods
3.1. DEA Model
DEA, Data Envelopment Analysis (DEA), is a non-parametric method for estimating the production frontier in operational research and economics. It was firstly proposed by famous operational research experts A. Charnes, W. W. Cooper and E. Rhodes in 1978. As a mathematical method, DEA uses linear programming to measure the efficiency scores of multiple DMU decision units. DEA analysis method is able to handle multiple input and output problems, which does not need to explicitly specify the specific function relation between the input and output. Because of advantages of strong objectivity and practicability, DEA analysis method is more suitable for performance measurement of activities than the traditional measurement methods such as regression analysis and the simple ratio analysis, so does port efficiency study (Nie, 2018).
3.2
Malmquist
Index MethodThe Malmquist exponential method is a DEA model-based method that uses the ratio of distance functions to analyze input-output efficiency. On the one hand, the Malmquist index can be used to obtain information to find out the contribution of changes in the pure technical efficiency and scale efficiency of ports to changes in port technical efficiency. On the other hand, if the port has non-technical efficiency, we can find out how it is caused by pure technical inefficiency and scale inefficiency, so as to provide correct guidance for improvement (Dong, 2016).
In the empirical analysis of this study, the Malmquist index method of DEA was adopted to calculate and analyze changes of total factor productivity (TFP) of China's listed port companies, taking each listed port company in China as a decision-making unit.
3.3 Selection of Indicators
The selection of input-output indicators directly affects the analysis results of logistics efficiency (Qi, Chung, & Kim, 2020). There are two types of input-output indicators which are used to measure port efficiency. One is measured by currency. Input factors mainly include total assets, operating costs, management expenses and paid-in capital. Output factors mainly include net profit, main business income, earnings per share and so on. The other is measured by physical objects. Input factors mainly include berth quantity, crane quantity, berth length, draft depth, yard area, etc. Output factors are expressed mainly in terms of cargo throughput.
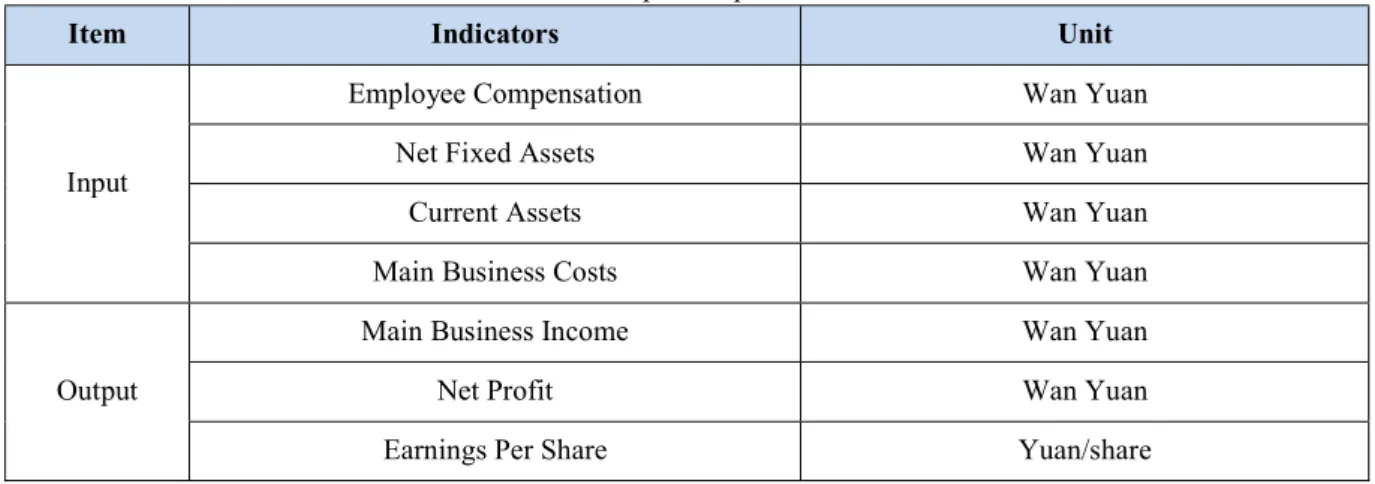
By referring to previous studies, this paper selects four input indicators including employee compensation, net fixed assets, current assets, main business costs, and selects three output indicators including main business income, net profit and earnings per share, which are Seen in table 1. These four input indicators not only comprehensively consider the input of port listed companies from the perspectives of “material”, “capital” and “manpower”, but also reflect the main input costs of their core business, reflecting the actual situation and basic characteristics of port listed companies. To a large extent, the salary of employees reflects the cost of port listed companies, which is the “human” cost input index of port listed companies. This is the author’s innovation. Under the modern enterprise operation mode, three output indicators above can better represent the enterprise output scale and economic benefits.
3.4 Data Sources and Research Objects
In this study, data were obtained from the company annual reports published by Shanghai stock exchange and Shenzhen stock exchange, and data from 2014-2018 were selected as samples. In this study, DMU is listed in 20 foreign trade ports in China. DMU includes Shanghai port, Ningbo port, Xiamen port, Tianjin port, Qingdao port, Huaihe energy, Tangshan port, China merchants port, Guangzhou port, Qingang stock, Dalian port, Chongqing port, Jinzhou port, Rizhao port, Yingkou port, Beibu gulf port, Zhuhai port, Lianyun port, Nanjing port, Yantian port. The calculation was performed using the Malmquist exponential analysis method.
45 Table 1: Input-Output Indicators
Item Indicators Unit
Input
Employee Compensation Wan Yuan
Net Fixed Assets Wan Yuan
Current Assets Wan Yuan
Main Business Costs Wan Yuan
Output
Main Business Income Wan Yuan
Net Profit Wan Yuan
Earnings Per Share Yuan/share
4. Empirical Analysis
All the data in this paper are from the company's annual reports published by the Shanghai stock exchange and Shenzhen stock exchange
4.1 DEA Static Analysis of Efficiency of Listed Port Companies
Because this paper analyzes the efficiency of port listed companies and studies on enterprises, it is necessary to analyze their efficiency from the perspective of output. Therefore, both DEA analysis and malmquist analysis only analyzed BCC-O and CCR-O models.
4.1.1 Comprehensive Efficiency Analysis
In this paper, DEA Frontier was used to process the sample data. By using CCR model and BCC model in DEA method, the comprehensive efficiency, pure technical efficiency and scale efficiency of listed companies in each port are measured. The range of value is 0-1. When the efficiency value is 1, DEA is effective. Firstly, through using CCR model, the comprehensive efficiency TE of 20 listed port companies was measured, whose comprehensive efficiency was given in table 2.
Table 2: Comprehensive Efficiency of 20 Listed Port Companies in China from 2014 to 2018
DMU 2014 2015 2016 2017 2018 Avg
Beibu gulf port 100.00% 88.10% 90.60% 92.10% 93.30% 0.9282
Chongqing port 100.00% 100.00% 100.00% 100.00% 100.00% 1 Dalian port 74.30% 78.70% 85.00% 76.90% 79.00% 0.7878 Guangzhoug port 100.00% 100.00% 100.00% 100.00% 100.00% 1 Huaihe energy 100.00% 92.30% 86.20% 95.20% 100.00% 0.9474 Jinzhou port 72.80% 73.90% 74.60% 79.10% 100.00% 0.8008 Lianyun port 89.00% 88.20% 95.80% 94.60% 89.40% 0.914 Nanjing port 100.00% 100.00% 100.00% 100.00% 100.00% 1 Ningbo port 100.00% 100.00% 98.90% 100.00% 100.00% 0.9978 Qingang stock 100.00% 100.00% 92.90% 100.00% 100.00% 0.9858
46 Qingdao port 89.00% 92.30% 93.50% 94.60% 95.70% 0.9302 Rizhao port 81.40% 74.50% 77.90% 85.20% 94.70% 0.8274 Shanghai port 100.00% 100.00% 100.00% 100.00% 100.00% 1 Tangshan port 99.70% 100.00% 100.00% 93.90% 100.00% 0.9872 Tianjin port 100.00% 100.00% 100.00% 100.00% 98.50% 0.997 Xiamen port 100.00% 100.00% 100.00% 100.00% 100.00% 1 Yantian port 100.00% 100.00% 100.00% 100.00% 100.00% 1 Yingkou port 90.10% 99.20% 100.00% 97.90% 100.00% 0.9744
China merchants port 100.00% 100.00% 100.00% 100.00% 97.80% 0.9956
Zhuhai port 90.80% 90.80% 88.80% 91.50% 97.70% 0.9192
Avg 0.9436 0.9390 0.9421 0.9505 0.9731
It can be found from table 2 that the annual comprehensive efficiency values of Chongqing, Guangzhou, Nanjing, Shanghai, Xiamen and Yantian ports (6 listed port companies) from2014-2018 are 1. That is to say, DEA is effective. The comprehensive efficiency values of Ningbo port and Qingang stock port were also 1 in 2014, 2015, 2017, 2018, but in 2016, comprehensive efficiency values of these two ports is 0.9890 and 0.9290 respectively. Tianjin port and China merchants port had a comprehensive efficiency value of 0.9850 and 0.9780 in 2018, and the comprehensive efficiency value of all other years was also 1. Average comprehensive efficiency of Lianyun port, Huaihe energy, Beibu gulf port, Zhuhai port Yingkou port, Qingdao port and Tangshan port was above 0.9, which was relatively high. However, Rizhao port, Jinzhou port and Dalian port are the last three ports in terms of value, with the mean comprehensive efficiency of 0.82748, 0.8008 and 0.7878 respectively. Average efficiency during 2014-2018 was 0.9436, 0.9390, 0.9421, 0.9590 and 0.9731 respectively. The overall efficiency of DMU showed that the listed companies of Chinese ports had better efficiency with the characteristics of increasing volatility.
Through further analysis of these listed port companies, it can be clearly found that both the listed port companies located in the core area of Yangtze river delta region which is economically developed region, including Nanjing port, Shanghai port, Ningbo port and all of the listed port companies located in the core area of the pearl river delta region have relatively high efficiency values. These areas have strong industrial base, developed commodity economy, convenient land and water transportation and large export volume, which provide good conditions for the development of listed companies in ports. On the other hand, Dalian port is located in the Liaodong peninsula, with the three northeastern provinces as the economic hinterland. Compared with the Yangtze river delta and the pearl river delta, the three northeastern provinces have slower economic development and less complete infrastructure. In addition, Dalian port is also facing fierce competition from its neighboring ports, including Yingkou port, Tianjin port and Qingdao port. Due to its underdeveloped railway transportation system, it is not in an advantageous position in the competition. Rizhao port and Jinzhou port are located in the southeast of the mountain. Compared with the economically developed Yangtze river delta and the pearl river delta, these regions have relatively small economic development and cannot provide strong support for the development of enterprises. So, the efficiency of listed companies in these ports is naturally relatively low.
4.1.2 Pure Technical Efficiency Analysis
In order to further study the efficiency of 20 port enterprises, by using the BCC model based on variable return to scale, the pure technical efficiency value of each port listed company was calculated and analyzed. The pure technical efficiency values of the 20 listed port companies from 2014 to 2018 are shown in table 3.
47 Table 3: Pure Technical Efficiency of 20 Listed Port Companies in China from 2014 to 2018
DMU 2014 2015 2016 2017 2018 Avg
Beibu gulf port 100.00% 88.40% 92.70% 96.00% 100.00% 0.9542
Chongqing port 100.00% 100.00% 100.00% 100.00% 100.00% 1 Dalian port 74.30% 78.80% 85.50% 79.70% 80.80% 0.7982 Guangzhou port 100.00% 100.00% 100.00% 100.00% 100.00% 1 Huaihe energy 100.00% 92.80% 86.50% 95.20% 100.00% 0.949 Jinzhoug port 73.40% 74.10% 74.90% 79.70% 100.00% 0.8042 Lianyun port 90.40% 100.00% 100.00% 100.00% 100.00% 0.9808 Nanjing port 100.00% 100.00% 100.00% 100.00% 100.00% 1 Ningbo port 100.00% 100.00% 100.00% 100.00% 100.00% 1 Qingang stock 100.00% 100.00% 94.40% 100.00% 100.00% 0.9888 Qingdao port 95.30% 96.00% 96.20% 96.70% 100.00% 0.9684 Rizhao port 81.60% 74.80% 81.40% 87.60% 96.10% 0.843 Shanghai port 100.00% 100.00% 100.00% 100.00% 100.00% 1 Tangshan port 100.00% 100.00% 100.00% 95.10% 100.00% 0.9902 Tianjin port 100.00% 100.00% 100.00% 100.00% 100.00% 1 Xiamen port 100.00% 100.00% 100.00% 100.00% 100.00% 1 Yantian port 100.00% 100.00% 100.00% 100.00% 100.00% 1 Yingkou port 91.10% 100.00% 100.00% 99.20% 100.00% 0.9806
China merchants port 100.00% 100.00% 100.00% 100.00% 100.00% 1
Zhuhai port 92.20% 92.00% 100.00% 97.70% 100.00% 0.9638
Avg 0.94915 0.94845 0.9558 0.96345 0.98845
As shown in table 3, in addition to Chongqing harbor port, Guangzhou port, Nanjing port, Shanghai port, Xiamen port and Yantian port, whose pure technical efficiency values are 1 in each year, pure technical efficiency values of Ningbo port, China merchants port and Tianjin port are valid for DEA. However, Rizhao port, Jinzhou port and Dalian port are still the last three ports in terms of value. Their five-year average comprehensive efficiency is 0.8430, 0.8042 and 0.7982 respectively, indicating their poor technical efficiency. It may be caused by their relatively backward management and operation mode. The remaining eight listed port companies all have annual pure technical efficiency values more than 0.9. Average pure technical efficiency during 2014-2018 was 0.9492, 0.9485, 0.9558, 0.9635 and 0.9885 respectively. BCC model of efficiency data was higher than the CCR model, and the overall DMU efficiency also showed the characteristics of increasing fluctuation.
48
4.2 Malmquist Index Results and Dynamic Analysis of the Efficiency of Listed Port Companies
4.2.1 Malmquist Index Measurement ResultWhen DEA method is used to analyze port efficiency, it can only be used for static comparison and cannot be used for dynamic comparison. That is to say, it cannot be used to analyze the dynamic changes of port efficiency during the sample period. At this point, the Malmquist productivity index method is introduced.
DEA Frontier was used to investigate the efficiency changes of BCC-O models in four periods of 20 listed port companies in China, namely 2014-2015, 2015-2016, 2016-2017 and 2017-2018. See table 4 for details.
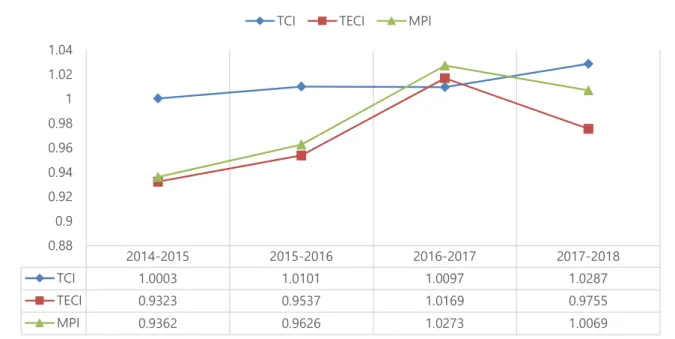
MPI is called total factor productivity, which is efficient when it is equal or greater than1.Internal factor is called technical efficiency (TCI). External factor is called technological progress (TECI). MPI is influenced by both internal factor (TCI) and external factor (TECI). Comparing the values of TCI and TECI, the one which is larger has a greater impact on MPI.
It can be seen from Fig.2 that the mean dynamic change of total factor productivity (MPI) of 20 listed port companies in 2014-2015 was 0.9362, down by 6.38%. In 2015-2016, it was 0.9626, down by 3.74%. The mean dynamic changes of total factor productivity (MPI) between 2016-2017 and 2017-2018 were 1.0273 and 1.0069 respectively, indicating that the total factor productivity of 20 listed port companies improved by 2.73% and 0.69% respectively during these evaluation periods. On the whole, the total factor productivity of these 20 listed port companies deteriorated in 2014-2015 and 2015-2016, while remaining two evaluation periods showed an improvement trend.
Figure 2: Variation Tendency of TCI, TECI and MPI
Further analysis shows that the change of MPI in 2016-2017 is mainly due to the technical change of TECI, an external factor. From 2016 to 2017, MPI improved by 2.73%, while mean of external factors was 1.0169. That is to say, the technological progress was 1.69%, accounting for most of the total factor change. The improvement of total factor productivity (MPI) from 2017 to 2018 was mainly due to the change of technical efficiency of internal factor (TCI). The mean change of technical efficiency of internal factor (TCI) was 1.0287, an improvement of 2.87%. However, the external factor TECI (technical change) decreased by 2.45%, and the effect of internal factor improvement was greater than that of external factor reduction, resulting in a 0.69% increase in MPI improvement. In 2018, China strengthened adjustment of the industrial structure and increased investment in the research and development of the core technologies of the Internet. Port construction has been developing towards automation and
2014-2015 2015-2016 2016-2017 2017-2018 TCI 1.0003 1.0101 1.0097 1.0287 TECI 0.9323 0.9537 1.0169 0.9755 MPI 0.9362 0.9626 1.0273 1.0069 0.88 0.9 0.92 0.94 0.96 0.98 1 1.02 1.04
49 intelligence, which has strongly promoted the improvement of the efficiency of listed port companies. Maybe it is also related to the improvement of management methods and internal economic scale of listed port companies.
During 2014-2015 and 2015-2016, external factor (TECI) decreased by 6.77% and 4.63%, while internal factor (TCI) improved by 0.03% and 1.01%. It can be seen that decline of external factor is greater than the improvement of internal factor, which leads to decline of MPI in these two periods. That is to say, the deterioration of technology leads to decline of MPI. It may have something to do with sustained economic recovery of western developed countries, which have emerged from the recession period, strengthened the stimulus to domestic demand and have increased exports, thus having an adverse impact on China's listed port companies.
4.2.2 Regional Efficiency Analysis
In order to further analyze changes in efficiency of each listed port company, this paper divides 20 listed port companies into Yangtze river delta, pearl river delta and Bohai bay according to their geographical locations. Yangtze river delta region includes Shanghai port, Nanjing port, Ningbo port, Lianyun port, Huaihe river energy, Beibu bay; pearl river delta region includes Zhuhai port, Yantian port, Xiamen port, Chongqing port, China merchants port and Guangzhou port. Bohai bay region includes Tianjin port, Dalian port, Yingkou port, Jinzhou port, Rizhao port, Qingang stock, Qingdao port and Tangshan port. Table 4 shows efficiency changes of these three regions in four periods of 2014-2015, 2015-2016, 2016-2017 and 2017-2018.
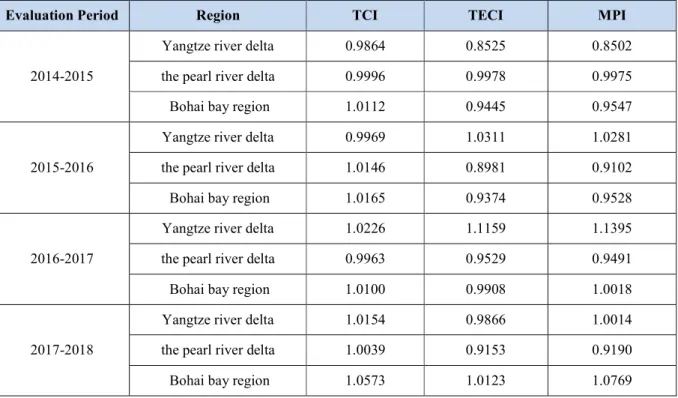
Table 4 reveals that the total factor productivity of listed port companies in these three regions showed a regressive trend from 2014 to 2015. The total factor productivity in the Yangtze river delta was 0.8502, with the most regressive rate of 14.92%. In addition, external factors (TECI) of these three regions in 2014-2015 were all less than 1 (0.8525, 0.9978 and 0.9445, respectively), and the technical changes showed a trend of regression. From 2015 to 2016, only the listed port companies in the Yangtze river delta region improved their total factor productivity, which was due to technological progress of external factors (TECI>TCI). In 2016-2017 and 2017-2018, total factor productivity of listed port companies in the pearl river delta region declined, and the influence of internal factors (TCI) was greater than that of external factors (TECI).
Table 4: Total Factor Productivity of Three Regions from 2014 to 2018
Evaluation Period Region TCI TECI MPI
2014-2015
Yangtze river delta 0.9864 0.8525 0.8502
the pearl river delta 0.9996 0.9978 0.9975
Bohai bay region 1.0112 0.9445 0.9547
2015-2016
Yangtze river delta 0.9969 1.0311 1.0281
the pearl river delta 1.0146 0.8981 0.9102
Bohai bay region 1.0165 0.9374 0.9528
2016-2017
Yangtze river delta 1.0226 1.1159 1.1395
the pearl river delta 0.9963 0.9529 0.9491
Bohai bay region 1.0100 0.9908 1.0018
2017-2018
Yangtze river delta 1.0154 0.9866 1.0014
the pearl river delta 1.0039 0.9153 0.9190
50 Throughout the three regions during these four evaluation periods, total factor productivity (MPI) of the pearl river delta during four evaluation periods showed a regressive trend, all of which were caused by the influence of internal factors (TCE) rather than external factors (TECI). It may have something to do with appearance of China’s new labour contract law in 2008, which led to higher wages for workers and higher production costs for companies. However, total factor productivity in Bohai bay region improved in 2016-2017 and 2017-2018, and the influence of internal factors (TCI) was greater than that of external factors (TECI), indicating that internal management of enterprises in Bohai bay region was increasingly improved. In these three evaluation periods of 2015-2016, 2016-2017 and 2017-2018, total factor productivity in the Yangtze river delta region was improved, among which improvement in 2015-2016 and 2015-2016-2017 was due to the influence of greater external factors greater, While improvement in 2017-2018 was due to the influence of greater internal factors greater. Yangtze river delta is one of the most economically developed areas in China, with high degree of internationalization, a large number of outstanding domestic talents, its port facilities by rapid development of automation and intelligent, advanced management mode and greater investment in research and development of enterprise innovation. So technical efficiency improvement and technical progress are faster and faster. In turn, total factor productivity improves. Pearl river delta region, as one of the most developed area in our country, combined with national policy tilt. Under the new situation of transformation and upgrading of economic structure, regional economy gradient around as well as the transformation and upgrading of processing trade, Pearl river delta region must accelerate enterprise’s internal reform of management system and adapt to changes in external environment, so as to lay the role of enterprise leaders effectively.
5. Conclusions
In this study, DEA and Malmquist index methods were used to analyze output efficiency of listed port companies in China from 2014 to 2018. DEA was used to measure comprehensive efficiency and pure technical efficiency of 20 listed port companies in China from 2014 to 2018. Malmquist productivity index was used not only to conduct dynamic analysis on efficiency changes of 20 listed port companies from 2014 to 2018, but also to study the impact of technological efficiency changes and technological progress on TFP. The main conclusions of this paper are as follows.
First, regarding with DMU as a whole, comprehensive efficiency value and pure technical efficiency value of the 20 listed port companies in China during 2014-2018 are both higher, showing the feature of increasing volatility, and efficiency data of BCC model is higher than that of CCR model. Comprehensive efficiency and pure technical efficiency of the listed port companies located in the core area of the economically developed Yangtze river delta, including Nanjing port, Shanghai port, Ningbo port, and all of the listed port companies located in the core area of the pearl river delta region are relatively high. Rizhao port, Jinzhou port and Dalian port are the last three ports with relatively low efficiency.
Second, affected by external factors, total factor productivity of the 20 listed port companies deteriorated in 2014-2015, 2015-2016 and improved in 2016-2017. Influenced by internal factors, MPI showed an improvement trend in 2017-2018.
Third, regarding with the three regions during the four evaluation periods, total factor productivity (MPI) in Pearl river delta during the four evaluation periods declined due to greater influence of internal factors (TCE) than external factors (TECI), while the MPI in the Bohai bay region improved during 2016-2017 and 2017-2018. Influenced by both internal factors and external factors, total factor productivity in Yangtze river delta region improved during the three evaluation periods of 2015-2016, 2016-2017 and 2017-2018, which strongly demonstrates that the economic hinterland has an important impact on the efficiency of listed port companies.
Regarding with listed port companies affected by internal factors, it is suggested to strengthen internal coordination, restructure and improve business operations. Those listed port companies affected by external factors need to make appropriate responses to external factors such as government policies, economic environment, social environment and technological development in order to improve efficiency. This paper analyzes output efficiency of listed port companies in China and studies the impact of technological efficiency changes and technological progress on total factor productivity. Its significance lies in finding efficient and non-efficient listed port companies and pointing out the improvement direction for these listed companies.
51 However, the research of this paper has some limitations, which are mainly reflected in the following aspects. First, in terms of selection of input-output indicators, the input and output indicators selected in this paper have certain limitations. There are many factors affecting port efficiency. In this paper, only the indicators of port enterprises are taken into consideration, and the overall analysis of port infrastructure and throughput as input and output indicators is not conducted from the perspective of production method. The results would be more accurate if more input-output indicators were added.
Second, the port efficiency calculated by the DEA model in this paper is the absolute value rather than the relative value, so it is not suitable for comparative analysis. For example, if the comprehensive technical efficiency of Guangzhou Port and Nanjing Port is 1, it only means that the absolute value of the comprehensive technical efficiency of the port is 1. Therefore, a three-stage DEA model study should be carried out in the future.
Third, the improvement plan for listed port companies in low efficiency areas needs to be further studied, such as adopting AHP method. In the future research, the efficiency prediction can be researched. The establishment of efficiency evaluation and prediction mechanism can help the government and ports to analyze current developments and give early warning of future changes.
References
Borenstein, D. (2004). Measuring the efficiency of Brazilian port office stores using data envelopment analysis. International Journal of Operations& Production Management, 24(10), 1055-1078.
Cullinane, K. (2004). An application of DEA windows analysis to container port production efficiency. Review of Network Economics, 3(2), 184-206.
Ding, C. H. (2018). Efficiency evaluation of large ports in Jiangsu province based on three-stage DEA model. (Master’s dissertation, Jiangsu University of Science and Technology in China).
Dong, B. (2016). Research on the efficiency of listed companies in china's port industry--based on super-efficiency DEA and Malmquist index. (Master’s dissertation, Southwest University of Political Science and Law in China). Feng, F., Chen, L., & Huang, H. (2017). Measurement and improvement path of operation efficiency of china's listed
port companies. China Circulation Economy, 31(6), 3.
Kuang, H. B. & Chen, S. W. (2007). Research and demonstration on production efficiency of Chinese ports. Scientific Research Management, 28(9), 170-177.
Li, C. J., Jeon, J. W., & Kim, H. H. (2020). An efficiency analysis of fishery output in coastal areas of china. International Journal of Advanced Smart Convergence, 9(3), 127-136.
Martine-Budria, E., Diaz-Armas, R., Navarro-Ibanez, M., & Ravelo-Mesa, T. (1999). A study of the efficiency of Spanish port authorities using data envelopment analysis. International Journal of Transport Economics, 26(2), 237-253.
Nie, J. L. (2018). Efficiency study of Shenzhen port based on DEA model. Comprehensive Transport, 40(8), 2-11. Pang, R. Z. (2006). Dynamic evaluation of china's major coastal ports. Economic Research, 9(6), 92-100.
Qi, L., Chung, G. Y., & Kim, H. H. (2020). Analysis on logistics efficiency of china's agricultural products cold chain from the green perspective. International Journal of Advanced Culture Technology, 8(2), 192-203.
Tone, K. (2001). A slacks-based measure of efficiency in data envelopment analysis. European Journal of Operational Research, 130(3), 498-509.
Vandyck, G. K. (2015). Assessment of port efficiency in west Africa using data envelopment analysis. American Journal of Industrial and Business Management, 5(4), 208-218.
Wang, L. & Bi, Z. W. (2010). Study on the efficiency of china's major inland ports based on three-stage DEA model. Research on Industrial Economy Investigate, 47(4), 40-48.
Yan, H. S., Kim, H. H., & Yang, J. W. (2020). Efficiency analysis of Chinese blockchain concept stock listed companies. International Journal of Advanced Smart Convergence, 9(3), 17-27.