This is an Open Access article distributed under the terms of the Cre-ative Commons Attribution Non-Commercial License (http://creCre-ative- (http://creative-commons.org/licenses/by-nc/4.0/) which permits unrestricted non-commercial use, distri-bution, and reproduction in any medium, provided the original work is properly cited.
Corresponding author: Kang Su Cho https://orcid.org/0000-0002-3500-8833 Department of Urology, Gangnam Severance Hospital, Yonsei University College of Medicine, 211 Eonju-ro, Gangnam-gu, Seoul 06273, Korea E-mail: [email protected] / Tel: +82-2-2019-3471 / Fax: +82-2-3462-8887 Submitted: September 29, 2016 / Accepted after revision: November 29, 2016
INTRODUCTION
Lower urinary tract symptoms (LUTS) are known to be closely
related to benign prostatic enlargement, benign prostatic ob-struction (BPO), and benign prostatic hyperplasia (BPH). Ac-cordingly, the “static” prostate enlargement determined by the
Original Article
https://doi.org/10.5213/inj.1732732.366 pISSN 2093-4777 · eISSN 2093-6931
Volume 19 | Number 2 | June 2015
pages 131-210
INJ
INTERNA TIONAL NEU RO UROLOGY JOURNAL Official Journal ofKorean Continence Society / Korean Society of Urological Research / The Korean Children’s Continence and Enuresis Society / The Korean Association of Urogenital Tract Infection and Inflammation
einj.org Mobile Web pISSN 2093-4777 eISSN 2093-6931 INTERNA TIONAL NEUROUROLOGY JOURNAL
Purpose: To assess the impact of periurethral calcification (PUC) according to its location on uroflowmetric parameters and urinary symptoms in patients with small prostate volume (PV).
Methods: Records were obtained from a prospectively maintained database of first-visit men with lower urinary tract symp-toms (LUTS). Patients whose PV was >30 mL were excluded to elucidate more clearly the impact of PUC on LUTS. A total of 539 patients were enrolled in the study. The prostatic urethra was examined by transrectal ultrasonography for PUC, and the location of PUC was divided into 3 areas (proximal, mid, and distal).
Results: The characteristics according to the location of PUC were compared using a 1-way analysis of variance test. The Total International Prostate Symptom Score (IPSS), postmicturition symptoms, and overactive bladder symptom score (OABSS) differed significantly among the groups. In the propensity score matching analysis, the proximal- and distal-PUC groups did not have a significantly different urinary flow rate or symptom score when compared to their matched control groups. How-ever, the mid-PUC group had significantly worse urinary symptoms than its matched control group (total IPSS [P=0.001], voiding symptoms [P=0.002], storage symptoms [P=0.041], and OABSS [P=0.015]). The peak urinary flow rate was also lower in the mid-PUC group with borderline significance (P=0.082). On multivariate linear regression analysis, mid-PUC was independently associated with IPSS and OABSS (P=0.035 and P=0.011, respectively).
Conclusions: Only mid-PUC was associated with symptom severity in men with LUTS and a small PV. Our findings suggest that mid-PUC could be a potential causal factor of LUTS, and the midportion of the prostatic urethra might play a pivotal role in the process of micturition.
Keywords: Urethra; Prostatic hyperplasia; Lower urinary tract symptoms; Calculi; Inflammation
• Research Ethics: The study was performed in accordance with applicable laws and regulations, good clinical practices, and ethical principles as described in the Declaration of Helsinki. This study protocol was approved by the Institutional Review Board of Gangnam Severance Hospital (approval number: 3-2016-0149). Written informed consent was obtained from all subjects.
• Conflict of Interest: No potential conflict of interest relevant to this article was reported.
Clinical Significance of Periurethral Calcification According to the
Location in Men With Lower Urinary Tract Symptoms and a
Small Prostate Volume
Jang Hee Han1, Joo Yong Lee2, Jong Kyu Kwon2, Jong Soo Lee1, Kang Su Cho1
1Department of Urology, Gangnam Severance Hospital, Yonsei University College of Medicine, Seoul, Korea
2Department of Urology, Severance Hospital, Urological Science Institute, Yonsei University College of Medicine, Seoul, Korea
Int Neurourol J 2017;21:220-228
1 / 1 CROSSMARK_logo_3_Test
2017-03-16 https://crossmark-cdn.crossref.org/widget/v2.0/logos/CROSSMARK_Color_square.svg
Han, et al. • Urethral Calcification With Urinary Symptoms
INJ
tone of the prostate and “dynamic” alpha-receptor-mediated smooth muscle tension are regarded as 2 major components connected to male LUTS [1]. However, in clinical practice, ap-proximately half of LUTS patients have a relatively small pros-tate (30 mL or less) [2] and undoubtedly have a weaker correla-tion with those volume factors. Moreover, urodynamic findings showed that only half of the patients demonstrated bladder outlet obstruction in LUTS patients with a small prostate vol-ume (PV), indicating the heterogeneity of this disease [3]. For this reason, several anatomical prostatic factors, such as the transitional zone index (TZI) and prostatic urethral angle (PUA), rather than simple volume parameters, have been inves-tigated [4,5].
Male LUTS has a multifactorial etiology, and, recently, a third major hypothetical factor has been proposed, prostatic inflam-mation [1]. In particular, inflaminflam-mation of the periurethral area, which ultimately induces periurethral fibrosis, could maximize induction of LUTS [6]. Although the etiology of prostatic calci-fication remains unclear, calcicalci-fication of the urethra can, similar to other tissues, result in urethral stiffness [7,8]. Based upon this theoretical hypothesis, we have previously demonstrated the significant impact of periurethral calcification (PUC) on LUTS.
To more clearly elucidate the impact of PUC on LUTS, the volume factor was purely confined in this study (PV≤30 mL). Herein, we evaluated the association between PUC, urinary symptoms, and uroflowmetric measurements with a small PV and further analyzed the clinical impact of PUC according to its location (proximal, mid, or distal) on the prostatic urethra.
MATERIALS AND METHODS
Patient Cohort
This study is a retrospective analysis of a prospectively main-tained database of male patients with LUTS/BPH who had their initial visit at our outpatient clinic between April 2010 and April 2013. During this period, 1,199 patients were registered in our database. A detailed medical history was obtained for patients aged 40 to 80 years after excluding the following conditions that are potential LUTS inducing factors: (1) clinically apparent bladder or prostate cancer, (2) neurologic disease that could in-fluence voiding symptoms, (3) uncontrolled diabetes mellitus, (4) history of a previous lower urinary tract surgery, (5) history of radiotherapy to the pelvis, and (6) urinary tract infections. A total of 1,030 patients were initially enrolled, and those with a
total prostate volume (TPV) >30 mL were excluded. Finally, 539 patients were eligible for the final analysis.
Good Clinical Practice Protocols
The study was performed in accordance with applicable laws and regulations, good clinical practices, and ethical principles as described in the Declaration of Helsinki. This study protocol was approved by the Institutional Review Board of Gangnam Severance Hospital (approval number: 3-2016-0149). Written informed consent was obtained from all subjects.
Assessment of Urinary Symptoms and Uroflowmetric Measurements
LUTS were evaluated using the International Prostate Symptom Score (IPSS), quality of life score, and overactive bladder symp-tom score (OABSS). The total IPSS was subcategorized into voiding, storage, and postmicturition symptom scores. For uro-flowmetric measurements, maximum urinary flow rate (Qmax) and postvoid residual volume (PVR) were evaluated. Both uro-flowmetric and PVR measurements were repeated if the voided volume was <125 mL. The assessment was made using Blue-tooth uroflowmetry (Urodyn+; Mediwatch Ltd., Rugby, UK) and a bladder scanner (BioCon-500; MCube Technology Co., Ltd, Seoul, Korea).
Assessment of Prostatic Anatomical Factors
Transrectal ultrasonography (TRUS) was performed on all sub-jects (Prosound Alpha 5 SV, Hitachi Aloka Medical, Ltd., To-kyo, Japan [between April 2010 and November 2012]; Pro Fo-cus 2202 Ultrasound System, BK-Medical, Herlev, Denmark [between December 2012 and April 2013]). TPV and transi-tional zone volume (TZV) were measured using the prolate el-lipsoid formula (height×width×length×π/6). The TZI was calculated according to the formula, TZI=TZV/TPV [9]. Prostatic calculi were viewed and scored in both axial and sagittal planes. Two investigators (JHH and JKK) independent-ly determined the degree of prostatic calculi. Disagreement be-tween the 2 investigators was resolved by a discussion with an-other investigator (KSC). The prostatic urethra was examined along the midsagittal plane. PUC was assessed for all of the sag-ittal images taken serially on TRUS, and we defined PUC as prostatic calcification that is within 2 mm of the prostatic ure-thra on the sagittal view of TRUS [10]. According to the classi-cal definition demonstrated by Harada et al. [11], prostatic classi- cal-cification demonstrating a burden or mass along the prostatic
Han, et al. • Urethral Calcification With Urinary Symptoms
INJ
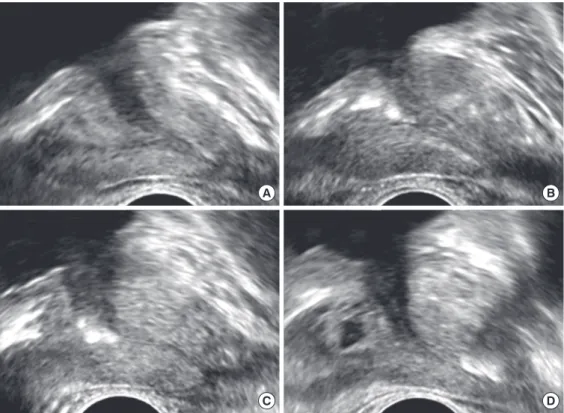
urethra was considered to be a clinically significant PUC, while the absence of or a small solitary calcification was considered to be an insignificant PUC. Overall PUC was determined based on the proportion of the urethra with significant calcification to the entire prostatic urethral length. The location of the PUC was divided into 3 consecutive nonoverlapping periurethral ar-eas (proximal 1/3, middle 1/3, and distal 1/3) (Fig. 1).
Statistical Analysis
A 1-way analysis of variance (ANOVA) test was applied to compare the clinical characteristics of the 3 different PUC groups according to the location of the PUC. To clarify our comparisons, we targeted the patients that had PUC only in one location (proximal PUC only, mid-PUC only, or distal PUC only). Using a propensity score matching analysis, the vol-ume factor (TPV), age, and voided volvol-ume were matched, and each PUC group was sequentially compared to their matched control group using a paired t-test. All statistical analyses were performed using R software (version 3.0.3, R Foundation for Statistical Computing, Vienna, Austria; http://www.r-project. org). A P-value <0.05 was considered statistically significant,
and all statistical tests were 2-sided.
RESULTS
As the result of interobserver reliability measurement, we re-corded intraclass correlation coefficients for a PUC of 0.981 (95% confidence interval, 0.978–0.983), which indicates an ex-cellent reliability. In terms of the patient baseline characteristics, the mean patient age was 60.03±10.00 years, and the mean TPV and mean TZV were 23.05±4.12 and 9.71±2.88, respec-tively. On the midsagittal plane, overall PUC was classified into 3 groups. The numbers of patients with no, mild, and moderate to severe PUC were 351 (65.1%), 126 (23.4%), and 62 (11.5%), respectively. Regarding the distribution of PUC location, the number of patients in the proximal-, mid-, and distal-PUC groups were 79 (14.7%), 124 (23.0%), and 69 (12.8%) (Table 1). We included 117 out of 539 patients (21.7%) who had only one location with PUC in the 1-way ANOVA test. The proxi-mal-PUC only (p-PUC), mid-PUC only (m-PUC), and distal-PUC only (d-distal-PUC) groups were composed of 35, 63, and 19 patients, respectively. The 3 groups significantly differed in the
Fig. 1. Representative images of the 3 groups of periurethral calcification (PUC) according to their location on the midsagittal plane during transrectal ultrasonography. Midsagittal plane demonstrating the trace of the urethra without PUC (A), proximal PUC (B), mid-PUC (C), and distal PUC (D).
A B
Han, et al. • Urethral Calcification With Urinary Symptoms
INJ
total IPSS, postmicturition symptoms, and OABSS, and the m-PUC group displayed the worst symptom scores in all fields, followed by the p-PUC and d-PUC groups. Total IPSS for the m-PUC group was 19.3±7.5, compared to 16.5±6.0 and 14.7±7.2 for the p-PUC and d-PUC groups, respectively (P=0.026). Post-micturition symptoms were 3.0±1.6 vs. 2.3±1.5 and 2.1±1.4, re-spectively (P=0.016). OABSS was 5.9±3.8 vs. 4.1±3.3 and 3.8± 2.1, respectively (P=0.017). There were no differences in the mean patient age or total PV among the three groups (Table 2). Propensity score matching analysis was performed for each group (p-PUC, m-PUC, and PUC). Neither the p-PUC or d-PUC groups demonstrated any significant impact on urinary symptoms or Qmax when compared to their matched control
group (Tables 3, 4). However, the m-PUC group displayed sig-nificantly worse urinary symptoms than its matched control group (Total IPSS [19.3±7.5 vs. 16.2±6.8, P=0.001], voiding symptoms [8.7±4.0 vs. 7.3±3.6, P=0.002], storage symptoms [7.5±3.5 vs. 6.4±3.3, P=0.041], and OABSS [5.9±3.8 vs. 4.2±3.2, P=0.015]). Qmax was also lower in the m-PUC group, with borderline significance (13.7±5.3 and 15.7±7.9, P=0.082) (Ta-ble 5).
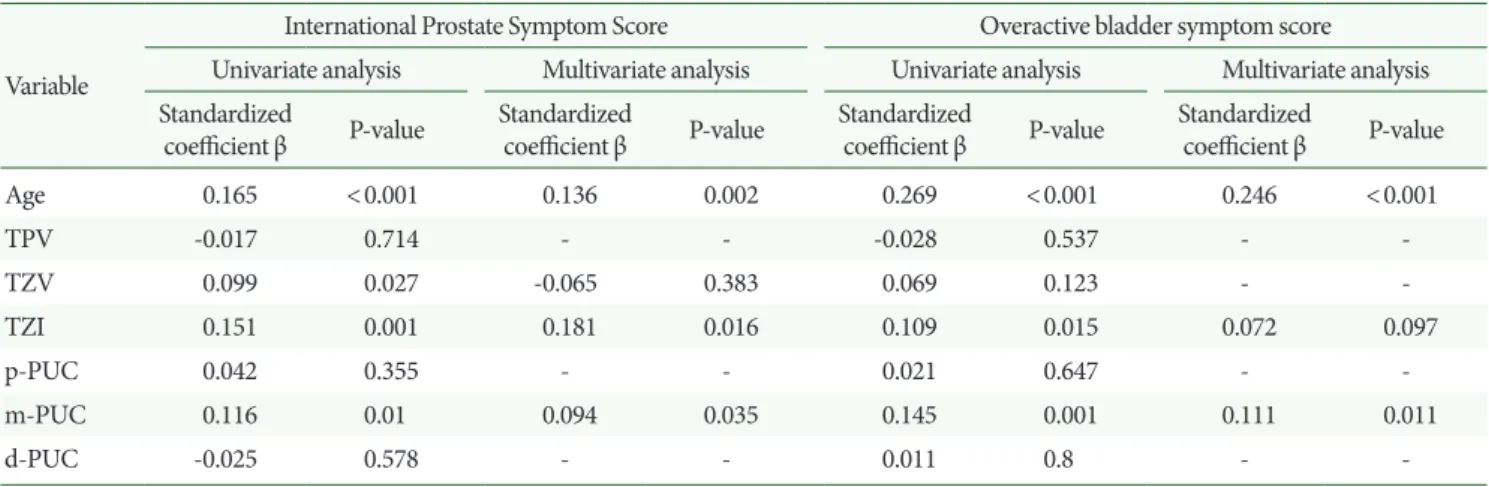
To confirm the independent clinical power of PUC, we per-formed univariate and multivariate linear regression analysis following propensity score matching analysis. For the multivar-iate model, variables proven significant in univarmultivar-iate analysis were taken into account. Multivariate linear regression analysis showed age, TZI, and m-PUC significantly affected IPSS total (P=0.002, P=0.016, and P=0.035, respectively). For the OABSS, only age and m-PUC were independently correlated (P<0.001 and P=0.011, respectively) (Table 6).
DISCUSSION
Male LUTS associated with a small PV represents approximate-ly half of the total LUTS patients [2]. This ratio was also consis-tent with our data (539 of 1,030, 52.3%). Because the number of LUTS patients has increased over time, there have been several efforts to search for the significant prostatic anatomical param-eters capable of predicting male LUTS, such as intravesical prostatic protrusion, TZI, presumed circle area ratio, peripheral zone thickness, and PUA. However, despite the high proportion of patients that have a small PV (<30 mL), only PUA and TZI have been shown to be independent factors affecting LUTS in this group [4,5].
LUTS in patients with a small PV is being highlighted due to the difference in its characteristics compared to those of general LUTS/BPH. Small PV LUTS patients are not likely to have BPO. The classical dynamic and static components of the pros-tate cannot explain the exact pathophysiology of small PV LUTS. The 5-alpha-reductase inhibitor finasteride has been shown in large cohort studies to have unsatisfactory results in small PV patients [12]. Alpha blockers play a role in reducing dynamic obstruction; however, outcome data is variable regard-ing small PV, makregard-ing achievregard-ing a reliable assessment of the ef-fects of medical treatments more difficult [13].
We focused on prostatic inflammation in small PV. For gen-eral LUTS/BPH, prostatic inflammation in a previous study was correlated with symptomatic progression, risk for urinary
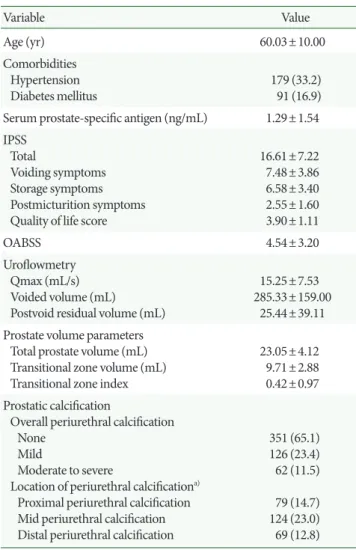
Table 1. Clinical features of subjects (n=539)
Variable Value Age (yr) 60.03±10.00 Comorbidities Hypertension Diabetes mellitus 179 (33.2) 91 (16.9) Serum prostate-specific antigen (ng/mL) 1.29±1.54 IPSS
Total
Voiding symptoms Storage symptoms Postmicturition symptoms Quality of life score
16.61±7.22 7.48±3.86 6.58±3.40 2.55±1.60 3.90±1.11 OABSS 4.54±3.20 Uroflowmetry Qmax (mL/s) Voided volume (mL) Postvoid residual volume (mL)
15.25±7.53 285.33±159.00
25.44±39.11 Prostate volume parameters
Total prostate volume (mL) Transitional zone volume (mL) Transitional zone index
23.05±4.12
9.71±2.88 0.42±0.97 Prostatic calcification
Overall periurethral calcification None
Mild
Moderate to severe
Location of periurethral calcificationa)
Proximal periurethral calcification Mid periurethral calcification Distal periurethral calcification
351 (65.1) 126 (23.4) 62 (11.5) 79 (14.7) 124 (23.0) 69 (12.8) Values are presented as mean±standard deviation or number (%). IPSS, International Prostate Symptom Score; OABSS, overactive blad-der symptom score; Qmax, maximum urinary flow rate.
Han, et al. • Urethral Calcification With Urinary Symptoms
INJ
retention, and the need for surgery [14]. Complete understand-ing of the inflammatory process and its pathogenesis is still in progress; however, inflammation is emerging as the new target-ed process for male LUTS [15]. Within the prostate’s anatomic structure, inflammation of the periurethral region, leading to periurethral fibrosis, was recently highlighted as a
LUTS-induc-ing factor [6,16-18]. Cantiello et al. [19] assessed periurethral tissues from radical prostatectomy specimens and suggested that fibrotic changes in periurethral prostatic tissues induced by prostate inflammation may eventually promote urethral stiff-ness and LUTS. Kim et al. [16] tested the association between prostate elasticity and LUTS with a novel palpation system
(In-Table 2. Comparisons of clinical features according to location of periurethral calcification (PUC)
Variable Total (n=117) Proximal-PUC (n=35) Mid-PUC (n=63) Distal-PUC (n=19) P-value
Age (yr) 62.0±9.9 61.7±10.5 61.7±9.7 63.6±10.0 0.752
Serum prostate-specific antigen (ng/mL) 1.2±1.2 1.2±1.1 1.1±1.0 1.6±1.6 0.153
IPSS Total
Voiding symptoms Storage symptoms Postmicturition symptoms Quality of life score
17.7±7.2 8.0±3.8 7.1±3.6 2.7±1.6 4.1±1.1 16.5±6.0 7.4±3.5 6.8±3.7 2.3±1.5 4.1±1.0 19.3±7.5 8.7±4.0 7.5±3.5 3.0±1.6 4.1±1.1 14.7±7.2 6.8±3.5 5.9±3.1 2.1±1.4 3.7±1.0 0.026 0.083 0.186 0.016 0.355 OABSS 5.0±3.6 4.1±3.3 5.9±3.8 3.8±2.1 0.017 Uroflowmetry Qmax (mL/s) Voided volume (mL) Postvoid residual volume (mL)
14.0±6.8 254.9±136.9 26.3±45.0 14.1±8.5 282.2±141.0 26.4±35.6 13.7±5.3 238.1±111.9 28.0±52.8 15.2±7.7 260.0±193.9 20.1±31.1 0.696 0.308 0.801 Prostate volume parameters
Total prostate volume (mL) Transitional zone volume (mL) Transitional zone index
23.1±4.5 10.1±3.0 0.4±0.1 22.5±4.4 9.6±2.8 0.4±0.1 23.9±4.2 10.7±3.1 0.4±0.1 21.6±5.3 9.0±2.4 0.4±0.1 0.113 0.036 0.394 Values are presented as mean±standard deviation.
IPSS, International Prostate Symptom Score; OABSS, overactive bladder symptom score; Qmax, maximum urinary flow rate.
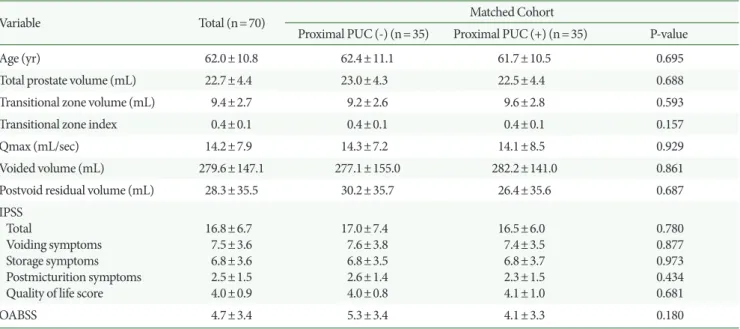
Table 3. Matched cohorts of proximal periurethral calcification (PUC) present vs. absent groups using propensity scores
Variable Total (n=70) Matched Cohort
Proximal PUC (-) (n=35) Proximal PUC (+) (n=35) P-value
Age (yr) 62.0±10.8 62.4±11.1 61.7±10.5 0.695
Total prostate volume (mL) 22.7±4.4 23.0±4.3 22.5±4.4 0.688
Transitional zone volume (mL) 9.4±2.7 9.2±2.6 9.6±2.8 0.593
Transitional zone index 0.4±0.1 0.4±0.1 0.4±0.1 0.157
Qmax (mL/sec) 14.2±7.9 14.3±7.2 14.1±8.5 0.929
Voided volume (mL) 279.6±147.1 277.1±155.0 282.2±141.0 0.861
Postvoid residual volume (mL) 28.3±35.5 30.2±35.7 26.4±35.6 0.687
IPSS Total
Voiding symptoms Storage symptoms Postmicturition symptoms Quality of life score
16.8±6.7 7.5±3.6 6.8±3.6 2.5±1.5 4.0±0.9 17.0±7.4 7.6±3.8 6.8±3.5 2.6±1.4 4.0±0.8 16.5±6.0 7.4±3.5 6.8±3.7 2.3±1.5 4.1±1.0 0.780 0.877 0.973 0.434 0.681 OABSS 4.7±3.4 5.3±3.4 4.1±3.3 0.180
Values are presented as mean±standard deviation.
Han, et al. • Urethral Calcification With Urinary Symptoms
INJ
denter) and showed that prostate elasticity was independently associated with voiding symptoms. Based on these studies, periurethral fibrosis can be assumed to be a cause of LUTS through decreased urethral flexibility while compromising the ability of the prostatic urethra to enlarge to adequately accom-modate urinary flow during micturition [10,19].
Prostatic calcification has a pathological connection with prostatic inflammation and fibrosis. The etiology of prostatic calcification is not yet fully understood; however, studies at the molecular level have shown that calcifications induced by flammation generate a microenvironment that drives more in-flammatory change, characterized by lymphocyte infiltration,
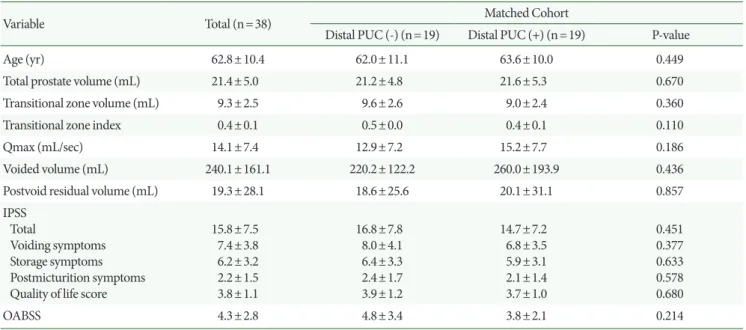
Table 4. Matched cohorts of distal periurethral calcification (PUC) present vs. absent groups using propensity scores
Variable Total (n=38) Matched Cohort
Distal PUC (-) (n=19) Distal PUC (+) (n=19) P-value
Age (yr) 62.8±10.4 62.0±11.1 63.6±10.0 0.449
Total prostate volume (mL) 21.4±5.0 21.2±4.8 21.6±5.3 0.670
Transitional zone volume (mL) 9.3±2.5 9.6±2.6 9.0±2.4 0.360
Transitional zone index 0.4±0.1 0.5±0.0 0.4±0.1 0.110
Qmax (mL/sec) 14.1±7.4 12.9±7.2 15.2±7.7 0.186
Voided volume (mL) 240.1±161.1 220.2±122.2 260.0±193.9 0.436
Postvoid residual volume (mL) 19.3±28.1 18.6±25.6 20.1±31.1 0.857
IPSS Total
Voiding symptoms Storage symptoms Postmicturition symptoms Quality of life score
15.8±7.5 7.4±3.8 6.2±3.2 2.2±1.5 3.8±1.1 16.8±7.8 8.0±4.1 6.4±3.3 2.4±1.7 3.9±1.2 14.7±7.2 6.8±3.5 5.9±3.1 2.1±1.4 3.7±1.0 0.451 0.377 0.633 0.578 0.680 OABSS 4.3±2.8 4.8±3.4 3.8±2.1 0.214
Values are presented as mean±standard deviation.
Qmax, maximum urinary flow rate; IPSS, International Prostate Symptom Score; OABSS, overactive bladder symptom score.
Table 5. Matched cohorts of mid-periurethral calcification (PUC) present vs. absent groups using propensity scores
Variable Total (n=126) Matched Cohort
Mid-PUC (-) (n=63) Mid-PUC (+) (n=63) P-value
Age (yr) 61.4±9.5 61.1±9.3 61.7±9.7 0.755
Total prostate volume (mL) 24.1±3.8 24.3±3.3 23.9±4.2 0.455
Transitional zone volume (mL) 10.5±2.8 10.4±2.6 10.7±3.1 0.499
Transitional zone index 0.4±0.1 0.4±0.1 0.4±0.1 0.369
Qmax (mL/sec) 14.7±6.8 15.7±7.9 13.7±5.3 0.082
Voided volume (mL) 257.9±134.7 277.7±152.5 238.1±111.9 0.124
Postvoid residual volume (mL) 30.3±48.4 32.5±43.8 28.0±52.8 0.611
IPSS Total
Voiding symptoms Storage symptoms Postmicturition symptoms Quality of life score
17.7±7.3 8.0±3.9 6.9±3.5 2.8±1.6 4.0±1.0 16.2±6.8 7.3±3.6 6.4±3.3 2.6±0.6 3.9±0.9 19.3±7.5 8.7±4.0 7.5±3.5 3.0±1.6 4.1±1.1 0.001 0.002 0.041 0.055 0.137 OABSS 5.1±3.6 4.2±3.2 5.9±3.8 0.015
Values are presented as mean±standard deviation.
Han, et al. • Urethral Calcification With Urinary Symptoms
INJ
cytokine activation, and release of reactive oxygen species [20-22]. Prostatic calcification is not synonymous with prostatic fi-brosis, but chronic inflammation can eventually lead to fibrosis-related calcification, a proven phenomenon in other tissues [23-25]. If inflammation induces urethral calcification, this process can, as shown in other tissues, affect urethral stiffness [7,8]. In this study, PUC was proposed as an independent risk fac-tor for male small PV LUTS. Notably, this is the first trial to as-sess PUC according to its location and to demonstrate that PUC is independently associated with worse urinary symptom scores in a small PV. We previously reported that overall PUC was associated with Qmax, total IPSS, and storage symptoms in TPV [10]. However, in the current study overall PUC was only associated with the Qmax when limited to small PV (data not shown). Taking these findings together, we can deduce that periurethral inflammation has a more synergistic effect on male LUTS if accompanied by a larger prostate.
The degree of overall PUC according to TPV in those with a small PV was similar (none, mild, moderate to severe: 63.5%, 22.6%, and 13.9% vs. 65.1%, 23.4%, and 11.5%). The mean age difference between the 2 trials was approximately 2 years, and the mean PV difference was approximately 10 g (i.e., the TPV group was older and had larger prostates).
For the proximal PUC, we considered this presentation to be inflammation and fibrosis of the proximal prostatic urethra and bladder neck, which could hypothetically play a major role in micturition initiation. In clinical practice, primary bladder neck obstruction without BPH is related to a reduced flow rate and higher urinary symptom scores by disturbing bladder neck
re-laxation during the voiding phase. Its etiology varies, and one of the etiologies is known to be an inflammatory-induced fi-brotic change [26,27]. However, in this study we failed to prove any clinical relevance of the p-PUC group with the peak uri-nary flow rate or uriuri-nary symptoms. A future study should be undertaken to evaluate the potential relationship between blad-der neck calcification and endoscopically proven bladblad-der neck obstruction.
Additionally, the d-PUC group also failed to show any signif-icant impact on the peak urinary flow rate or urinary symptom scores. In the one-way ANOVA test comparing the uroflow-metric measurements and urinary symptom scores among the 3 different PUC groups (p-PUC, m-PUC, and d-PUC), the pa-tient with distal-PUC typically had the best outcomes com-pared to the p-PUC and m-PUC groups. From this result, con-versely, we provisionally conclude that the distal portion of the prostatic urethra has a minimal role in the micturition process compared to the proximal and midportions.
Distinct from the p-PUC and d-PUC groups, the m-PUC group showed a significant impact on most of the urinary symp-toms in patients with a small PV. There have been several stud-ies demonstrating urethral movement during the voiding phase. Ukimura et al. [28] reported that the prostatic urethra is pulled upward in a ventral direction toward the pubic bone during voiding. This theory is consistent with PUA mechanics; the urethra tends to reduce its resistance by reducing the PUA by moving ventrally, consequently straightening the urethra. However, if the PUA remains high due to limited movement induced by PUC, energy loss proportional to the PUA could
Table 6. Multivariate linear regression analysis of prostatic parameters for IPSS and OABSS
Variable
International Prostate Symptom Score Overactive bladder symptom score Univariate analysis Multivariate analysis Univariate analysis Multivariate analysis Standardized
coefficient β P-value Standardized coefficient β P-value Standardized coefficient β P-value Standardized coefficient β P-value
Age 0.165 <0.001 0.136 0.002 0.269 <0.001 0.246 <0.001 TPV -0.017 0.714 - - -0.028 0.537 - -TZV 0.099 0.027 -0.065 0.383 0.069 0.123 - -TZI 0.151 0.001 0.181 0.016 0.109 0.015 0.072 0.097 p-PUC 0.042 0.355 - - 0.021 0.647 - -m-PUC 0.116 0.01 0.094 0.035 0.145 0.001 0.111 0.011 d-PUC -0.025 0.578 - - 0.011 0.8 -
-IPSS, International Prostate Symptom Score; OABSS, overactive bladder symptom score; TPV, total prostate volume; TZV, transitional zone volume; TZI, transitional zone index; p-PUC, proximal periurethral calcification; m-PUC, mid periurethral calcification; d-PUC, distal periurethral calcification.
Han, et al. • Urethral Calcification With Urinary Symptoms
INJ
occur during micturition and could result in a decrease in urine velocity, consequently causing LUTS [4,29]. Theoretically, due to the mid-PUC leading to midperiurethral fibrosis, the PUA could have a fixed tone, causing ineffective voiding, and ulti-mately causing LUTS. From the urethral dynamic mechanics proven above, we believe these significant findings regarding the mid-PUC indirectly support the idea that the midportion of the prostatic urethra is a clinically important region with re-spect to male LUTS.
However, our study has some limitations. First, this study in-cluded a small number of subjects; thus, further study with a larger cohort is needed to draw a more objective and concise conclusion regarding PUC in patients with a small PV. Al-though PUC, inflammation, and fibrosis are hypothetically mutually related, it remains unclear whether these 3 factors have the same impact on LUTS or not [10]. Studies on the dif-ferences in pathological prostatic tissue according to varying prostate PUC location are warranted. Regarding proximal PUC, further study is required to assess the relationship be-tween the proximal-PUC group and bladder neck fibrosis, ac-companied by a pathological and mechanical analysis. Further-more, a meticulous assessment of the dynamic movement of the urethra is still imperative, and additional controlled pro-spective studies regarding the effect of urethral stiffness on the 3-dimensional movement of the urethra should be described in future studies.
In conclusion, only mid-PUC was associated with urinary symptom severity in men with LUTS and a small PV. Our find-ings suggest that the mid-PUC could be a potential causal fac-tor of LUTS, and the midportion of the prostatic urethra might play a pivotal role in the process of micturition.
REFERENCES
1. Nickel JC, Roehrborn CG, O’Leary MP, Bostwick DG, Somerville MC, Rittmaster RS. The relationship between prostate inflamma-tion and lower urinary tract symptoms: examinainflamma-tion of baseline data from the REDUCE trial. Eur Urol 2008;54:1379-84.
2. Overland GB, Vatten L, Rhodes T, DeMuro C, Jacobsen G, Vada K, et al. Lower urinary tract symptoms, prostate volume and uroflow in norwegian community men. Eur Urol 2001;39:36-41.
3. Gomes CM, Nunes RV, Araújo RM, Sacomani CR, Trigo-Rocha FE, Bruschini H, et al. Urodynamic evaluation of patients with lower urinary tract symptoms and small prostate volume. Urol Int 2008;81:129-34.
4. Kang DH, Lee JY, Hah YS, Chung DY, Lee DH, Cho KS. Correla-tion of prostatic urethral angle with the severity of urinary symp-tom and peak flow rate in men with small prostate volume. PLoS One 2014;9:e104395.
5. Choi J, Ikeguchi EF, Lee SW, Choi HY, Te AE, Kaplan SA. Is the higher prevalence of benign prostatic hyperplasia related to lower urinary tract symptoms in Korean men due to a high transition zone index? Eur Urol 2002;42:7-11.
6. Rodriguez-Nieves JA, Macoska JA. Prostatic fibrosis, lower urinary tract symptoms, and BPH. Nat Rev Urol 2013;10:546-50.
7. Forman JL, Kent RW. The effect of calcification on the structural mechanics of the costal cartilage. Comput Methods Biomech Biomed Engin 2014;17:94-107.
8. Sekikawa A, Shin C, Curb JD, Barinas-Mitchell E, Masaki K, El-Saed A, et al. Aortic stiffness and calcification in men in a popula-tion-based international study. Atherosclerosis 2012;222:473-7. 9. Kaplan SA, Te AE, Pressler LB, Olsson CA. Transition zone index
as a method of assessing benign prostatic hyperplasia: correlation with symptoms, urine flow and detrusor pressure. J Urol 1995;154: 1764-9.
10. Han JH, Kwon JK, Lee JY, Kang DH, Choi HC, Lee JS, et al. Is peri-urethral calcification associated with urinary flow rate and symp-tom severity in men with lower urinary tract sympsymp-toms-benign prostatic hyperplasia? A retrospective review. Urology 2015;85: 1156-61.
11. Harada K, Igari D, Tanahashi Y. Gray scale transrectal ultransonog-raphy of the prostate. J Clin Ultrasound 1979;7:45-9.
12. Kaplan SA, Lee JY, Meehan AG, Kusek JW; MTOPS Research Group. Long-term treatment with finasteride improves clinical progression of benign prostatic hyperplasia in men with an en-larged versus a smaller prostate: data from the MTOPS trial. J Urol 2011;185:1369-73.
13. Kaplan SA, McConnell JD, Roehrborn CG, Meehan AG, Lee MW, Noble WR, et al. Combination therapy with doxazosin and finaste-ride for benign prostatic hyperplasia in patients with lower urinary tract symptoms and a baseline total prostate volume of 25 ml or greater. J Urol 2006;175:217-20.
14. Roehrborn CG. Definition of at-risk patients: baseline variables. BJU Int 2006;97 Suppl 2:7-11.
15. Vela Navarrete R, Garcia Cardoso JV, Barat A, Manzarbeitia F, López Farré A. BPH and inflammation: pharmacological effects of Permixon on histological and molecular inflammatory markers. Results of a double blind pilot clinical assay. Eur Urol 2003;44:549-55.
In-Han, et al. • Urethral Calcification With Urinary Symptoms
INJ
denter study: associations between prostate elasticity and lower urinary tract symptoms. Urology 2014;83:544-8.
17. Ma J, Gharaee-Kermani M, Kunju L, Hollingsworth JM, Adler J, Arruda EM, et al. Prostatic fibrosis is associated with lower urinary tract symptoms. J Urol 2012;188:1375-81.
18. Gharaee-Kermani M, Rodriguez-Nieves JA, Mehra R, Vezina CA, Sarma AV, Macoska JA. Obesity-induced diabetes and lower uri-nary tract fibrosis promote uriuri-nary voiding dysfunction in a mouse model. Prostate 2013;73:1123-33.
19. Cantiello F, Cicione A, Salonia A, Autorino R, Tucci L, Madeo I, et al. Periurethral fibrosis secondary to prostatic inflammation caus-ing lower urinary tract symptoms: a prospective cohort study. Urology 2013;81:1018-24.
20. Shoskes DA, Lee CT, Murphy D, Kefer J, Wood HM. Incidence and significance of prostatic stones in men with chronic prostatitis/ chronic pelvic pain syndrome. Urology 2007;70:235-8.
21. Gandaglia G, Briganti A, Gontero P, Mondaini N, Novara G, Salo-nia A, et al. The role of chronic prostatic inflammation in the pathogenesis and progression of benign prostatic hyperplasia (BPH). BJU Int 2013;112:432-41.
22. Ficarra V, Sekulovic S, Zattoni F, Zazzera M, Novara G. Why and how to evaluate chronic prostatic inflammation. Eur Urol Suppl
2013;12:110-5.
23. Balin SJ, Wetter DA, Andersen LK, Davis MD. Calcinosis cutis oc-curring in association with autoimmune connective tissue disease: the Mayo Clinic experience with 78 patients, 1996-2009. Arch Der-matol 2012;148:455-62.
24. New SE, Aikawa E. Cardiovascular calcification: an inflammatory disease. Circ J 2011;75:1305-13.
25. Detlefsen S, Sipos B, Feyerabend B, Klöppel G. Pancreatic fibrosis associated with age and ductal papillary hyperplasia. Virchows Arch 2005;447:800-5.
26. Huckabay C, Nitti VW. Diagnosis and treatment of primary blad-der neck obstruction in men. Curr Urol Rep 2005;6:271-5. 27. Nitti VW. Primary bladder neck obstruction in men and women.
Rev Urol 2005;7 Suppl 8:S12-7.
28. Ukimura O, Iwata T, Ushijima S, Suzuki K, Honjo H, Okihara K, et al. Possible contribution of prostatic anterior fibromuscular stroma to age-related urinary disturbance in reference to pressure-flow study. Ultrasound Med Biol 2004;30:575-81.
29. Cho KS, Kim JH, Kim DJ, Choi YD, Kim JH, Hong SJ. Relationship between prostatic urethral angle and urinary flow rate: its implica-tion in benign prostatic hyperplasia pathogenesis. Urology 2008; 71:858-62.