저작자표시-비영리-변경금지 2.0 대한민국 이용자는 아래의 조건을 따르는 경우에 한하여 자유롭게 l 이 저작물을 복제, 배포, 전송, 전시, 공연 및 방송할 수 있습니다. 다음과 같은 조건을 따라야 합니다: l 귀하는, 이 저작물의 재이용이나 배포의 경우, 이 저작물에 적용된 이용허락조건 을 명확하게 나타내어야 합니다. l 저작권자로부터 별도의 허가를 받으면 이러한 조건들은 적용되지 않습니다. 저작권법에 따른 이용자의 권리는 위의 내용에 의하여 영향을 받지 않습니다. 이것은 이용허락규약(Legal Code)을 이해하기 쉽게 요약한 것입니다. Disclaimer 저작자표시. 귀하는 원저작자를 표시하여야 합니다. 비영리. 귀하는 이 저작물을 영리 목적으로 이용할 수 없습니다. 변경금지. 귀하는 이 저작물을 개작, 변형 또는 가공할 수 없습니다.
Thesis for the Degree of Doctor of Philosophy
Bidirectional transcriptome analysis of rat
bone marrow-derived mesenchymal stem
cells and activated microglia in an in vitro
coculture system
The Graduate School of Ajou University
Department of Biomedical Sciences
Bidirectional transcriptome analysis of rat
bone marrow-derived mesenchymal stem
cells and activated microglia in an in vitro
coculture system
Gwang Lee, Advisor
I submit this thesis as the
Doctoral thesis in Ajou University Graduate School.
August, 2020
Ajou University Graduate School
Department of Biomedical Sciences
Da Yeon Lee
The Doctoral thesis of Da Yeon Lee in Graduate School of Ajou
University is hereby approved.
Ajou University Graduate School
i ABSTRACT
Microglia contribute to the pathogenesis of brain diseases by regulating of neuroinflammation. Thus, targeting of neuroinflammation triggered by activated microglia in brain diseases has become a promising curative strategy. Bone marrow-derived mesenchymal stem cells (BM-MSCs) have been shown to have therapeutic effects, resulting from the regulation of inflammatory conditions in the brain. In this study, Gene expression pattern in rat BM-MSCs (rBM-MSCs) cocultured with lipopolysaccharide- (LPS-) stimulated primary rat microglia were investigated using microarray analysis and the functional relationships were evaluated through Ingenuity Pathway Analysis (IPA). The effects of rBM-MSC on LPS-stimulated microglia were also assessed using a reverse coculture system and the same transcriptomic analysis. In rBM-MSCs, 67 genes were differentially expressed, which were highly related with migration of cells, compared to control. The gene network was predicted using IPA and LPS-stimulated primary rat microglia increase the migration of rBM-MSCs was validated by experiments. Reversely, expression patterns of the transcriptome in LPS-stimulated primary rat microglia cocultured with rBM-MSCs were changed. Results showed that 64 genes were altered, which were highly related with inflammatory response, compared to absence of rBM-MSCs. In the same procedure with the aforementioned, the prediction of the gene network and experimental validation showed that rBM-MSCs decrease the inflammatory response of stimulated primary rat microglia. These indicate that LPS-stimulated microglia increase the migration of rBM-MSCs and that rBM-MSCs reduce the inflammatory activity in LPS-stimulated microglia. The results of this study show complex mechanisms underlying the interaction between rBM-MSCs and activated microglia and may be supportive for the advance of stem cell therapy for brain diseases. This study is based on a previously published report (1).
Keywords: bone marrow-derived mesenchymal stem cells; inflammation; microglia; migration; transcriptome analysis
ii TABLE OF CONTENTS ABSTRACT ... ⅰ TABLE OF CONTENTS ... ⅱ LIST OF TABLES ... ⅳ LIST OF FIGURES ... ⅴ 1. Introduction ... 1
2. Materials and methods ... 5
2.1. Isolation and maintenance of rat bone marrow-derived mesenchymal stem cells (rBM-MSCs). ... 5
2.2. Rat microglia primary cultures ... 7
2.3. Coculture of LPS-stimulated or non-stimulated microglia and rBM-MSCs. ... 9
2.4. Total RNA isolation and microarray analysis ... 9
2.5. Transcriptomic analysis using Ingenuity Pathway Analysis ... 10
2.6. Quantitative real-time PCR (qPCR) ... 14
2.7. Migration assay ... 17
2.8. Statistical analysis ... 17
3. Results ... 18
3.1. Cellular movement-related transcriptomic changes in rBM-MSCs cocultured with LPS-stimulated microglia. ... 18
3.2. Functional prediction of transcriptomic networks in rBM-MSCs cocultured with LPS-stimulated microglia. ... 23
3.3. Increased migratory activity in rBM-MSCs cocultured with LPS-stimulated microglia. ... 28
3.4. Transcriptomic analysis in LPS-stimulated microglia cocultured with rBM- MSCs. ... 30 3.5. Functional prediction of transcriptomic networks and reduced inflammatory
iii
response in LPS-stimulated microglia cocultured with rBM-MSCs. ... 34
4. Discussion ... 41
CONCLUSION... 44
iv
LIST OF TABLES
Table 1. Quantitative real-time PCR (qPCR) primer sequences for genes encoding transcriptomic network related to cell migration ... 15 Table 2. qPCR primer sequences for genes encoding transcriptomic network related to inflammatory response ... 16 Table 3. Top 20 canonical pathways constructed algorithmically by Ingenuity Pathway Analysis (IPA) in rat bone marrow-derived mesenchymal stem cells (rBM-MSCs) cocultured with lipopolysaccharide (LPS)-stimulated microglia compared to rBM-MSCs cocultured with microglia ... 21 Table 4. 67 genes related to cell migration in rat bone marrow-derived mesenchymal stem cells (rBM-MSCs) cocultured with LPS-stimulated microglia compared to rBM-MSCs cocultured with microglia ... 26 Table 5. Top 20 canonical pathways constructed algorithmically by IPA in LPS-stimulated microglia cocultured with rBM-MSCs compared to LPS-LPS-stimulated microglia ... 33 Table 6. 64 genes related to inflammatory response in LPS-stimulated microglia cocultured with rat bone marrow-derived mesenchymal stem cells (rBM-MSCs) compared to LPS-stimulated microglia ... 37
v
LIST OF FIGURES
Figure 1. Immunocytochemical analysis of surface markers on rat bone marrow-derived mesenchymal stem cells (rBM-MSCs). ... 6 Figure 2. Flow cytometry analysis of Iba1 positive cells in primary microglia isolated from SD rat pups... 8 Figure 3. Transcriptomic network analysis in four different culture conditions of rBM-MSCs (>1.5 fold-change). ... 11 Figure 4. Gene network related to cell migration in rBM-MSCs cocultured with LPS-stimulated microglia compared to rBM-MSCs cocultured with microglia (>1.5 fold-change) ... 12 Figure 5. Gene network related to inflammatory response in LPS-stimulated microglia cocultured with rBM-MSCs compared to microglia only (>1.5 fold-change). ... 13 Figure 6. Cellular movement-related gene expression variation in rBM-MSCs cocultured with LPS-stimulated microglia. ... 19 Figure 7. Plotting of signal intensities in three different culture conditions of rBM-MSCs compared to control (rBM-rBM-MSCs only). ... 20 Figure 8. Top 20 list of function or diseases constructed algorithmically by Ingenuity Pathway Analysis (IPA) in rBM-MSCs cocultured with LPS-stimulated microglia compared to rBM-MSCs cocultured with microglia. ... 22 Figure 9. Transcriptomic network analysis in four different culture conditions of rBM-MSCs. ... 24 Figure 10. Increase in migration of rBM-MSCs cocultured with LPS-stimulated microglia. ... 25 Figure 11. Migration assays with rBM-MSCs cocultured with LPS-stimulated microglia. ... 29
vi
Figure 12. Inflammation-related gene expression variation in LPS-stimulated microglia cocultured with rBM-MSCs ... 31 Figure 13. Top 20 list of function or diseases constructed algorithmically by IPA in LPS-stimulated microglia cocultured with rBM-MSCs compared to LPS-stimulated microglia. ... 32 Figure 14. Transcriptomic network analysis in two different culture conditions of LPS-stimulated microglia. ... 35 Figure 15. Reduced inflammatory response in LPS-stimulated microglia cocultured with rBM-MSCs. ... 36 Figure 16. Western blot analysis in LPS-stimulated microglia cocultured with rBM-MSCs... ... 39 Figure 17. Schematic representation of bidirectional interaction between rat rBM-MSCs and activated microglia... ... 40
- 1 -
1. Introduction
Brain cells are composed of neurons and glial cells. The two cell types work together to monitor the microenvironment of brain. Neurons, which is main functional cell of nervous system, communicate via chemical and electrical synapses, in a process known as synaptic transmission. And glial cells give not only structural support but also functional help through the release of neuromodulators, axonal myelin formation, and the regulation of synaptic activity. These cells play various roles for maintaining the brain tissue homeostasis and neuronal integrity (2). Astrocytes, oligodendrocytes, and microglia are representative glia cells in brain. Astrocytes and oligodendrocytes connected with the vasculature are equipped with glycolytic machinery and efficiently provide nutrients and energy substrates from blood to the neurons and their long-extended axons (3).
Microglia are brain resident immune cells and represent around 10% of adult central nervous system (CNS) cells, with variable cell density across distinct regions. Recent microglia originate from early erythromyeloid progenitors (EMPs) in the extraembryonic yolk sac, which seed the CNS of the embryo, differentiating into matured microglia through a stepwise developmental program was elucidated by fate-mapping studies. Remarkably, microglia self-renew through low-rate proliferation in combination with apoptosis throughout life, without any involvement from bone-marrow-derived monocytes to the microglial pool, at least under homeostatic conditions (4).
Microglia participate in various physiological functions, such as pruning, regulating plasticity, and neurogenesis, to maintain homeostasis (5). Multibranched resting microglia exist in a quiescent state in healthy conditions; however, upon sensing a disturbance in homeostasis, microglia become more rounded and amoeboid-shaped and increase phagocytosis and secretion of pro-inflammatory cytokines (6). Activated microglia induce inflammatory environments by producing a variety of inflammatory molecules, including nitric oxide (NO), tumor necrosis
- 2 -
factor (TNF-α), interleukin 1-β (IL1-β), and reactive oxygen species (ROS) that have been closely associated with the pathogenesis of neural damage resulting from ischemia, inflammation and primary neurodegeneration (7). Furthermore, many studies have been reported that activated microglia cause neurological diseases such as neurodegenerative disorders, multiple sclerosis (MS), stroke, and neuropathic pain disease (8-11).
Controlling of microglia-mediated inflammation has been considered a therapeutic strategy in brain diseases. Several anti-inflammatory drugs such as glucocorticoids, minocycline, endocannabinoids, and nonsteroidal anti-inflammatory drugs are effective in regulating microglial activation and exert neuroprotective effects in the brain following different types of injuries and neurodegenerative diseases (12, 13). Although several drugs reduce the symptoms of brain diseases, they are frequently associated with side effects (14, 15).
Mesenchymal stem cells (MSCs) are a heterogeneous subset of stromal stem cells that can be isolated from many adult tissues. They can differentiate into cells of the mesodermal lineage, for example adipocytes, osteocytes, and chondrocytes, as well as cells of other embryonic lineages. MSCs can interact with both the innate and adaptive immune systems, leading to the modulation of several effector functions to immune cells (16).
Especially, bone marrow-derived mesenchymal stem cells (BM-MSCs) can meet many of the needs and requirements of a cell system delivery for nervous tissue transplantation and repair owing to their capability of turning into nonmesenchymal lineages. Besides, BM-MSCs have ability that rapidly and extensively expanding in
vitro under culture conditions. Thus, small amount of BM-MSCs can produce sufficient cells for transplantation. Moreover, the BM-MSCs are immune controlled cells, which make them the best choice for allogeneic transplantation, avoiding tissue-rejection effects and the use of immune suppressive drugs. There are several other advantages, such as their capability of releasing paracrine factors, the ability
- 3 -
of homing to injury sites, as well as integrating and surviving within the host tissue; suitability for stable transfection by exogenous genes; the lack of important ethical problems compared to embryonic stem cells; and their safety and efficacy (17).
For the last two decades, the ability of BM-MSCs to reduce symptoms of brain diseases such as stroke, Parkinson’s disease, and multiple system atrophy has been investigated (18-21). Moreover, BM-MSCs have a therapeutic effect which is downregulating ability of excessive inflammation in the brain (19, 22, 23). Particularly, the immunomodulation of BM-MSCs play an important role in the treatment of inflammatory diseases, including neurodegenerative disorders.
The observation that BM-MSCs neuroprotective effect may occur through the interaction with local neural cells is consistent with experiments addressing the interaction between BM-MSCs and microglia. BM-MSCs are able to inhibit LPS-stimulated microglia activation and the production of inflammatory factors through diffusible molecules and that BM-MSCs sense inflammatory molecules, released by the activated microglia, thus increasing significantly the production of neurotrophic factors, which are involved in neuroprotection (7).
Importantly, this immunomodulatory ability is highly flexible according to complex changes in the inflammatory niche. Given the dynamic inflammation in neurodegenerative diseases, BM-MSC-mediated immunomodulation in cell therapy for these diseases deserves more attention (24).
Although many studies have reported the effects of BM-MSC transplantation in brain disease animal models in reducing neuroinflammation induced by microglia (23, 25, 26), the underlying mechanisms of BM-MSCs in targeting microglia-mediated neuroinflammation and the cellular network of activated microglia are still unclear. Additionally, even though mutual reactions between BM-MSC and activated microglia were investigated in vitro (27), their interactions were analysed in targeted approaches with limitations to elucidate the corresponding mechanisms. In this study, the relationship between rat bone marrow-derived mesenchymal stem cells
(rBM-- 4 (rBM--
MSCs) and activated microglia was evaluated using bidirectional transcriptomic analysis.
- 5 -
2. Materials and methods
2.1. Isolation and maintenance of rat bone marrow-derived mesenchymal stem cells (rBM-MSCs)
rBM-MSCs were isolated from 8–12-week-old Sprague Dawley (SD) rats and characterised as previously described (28). Briefly, cells were isolated from the tibias and femurs and separated using 80% Percoll gradient centrifugation at 1300 rpm for 10 min at RT. Cells in the low-density fraction were washed with Dulbecco’s modified Eagle’s medium (DMEM; Gibco, USA) supplemented with 10% foetal bovine serum (FBS), 100 U/mL penicillin, and 100 μg/mL streptomycin sulphate (HyClone, USA). Next, 1.6 × 10⁵ cells were seeded onto 10 cm culture dishes (SPL, South Korea) containing a control medium and cultured as adherent cells in a humidified chamber at 5% CO2 and 37°C for 3–4 weeks. The media was changed
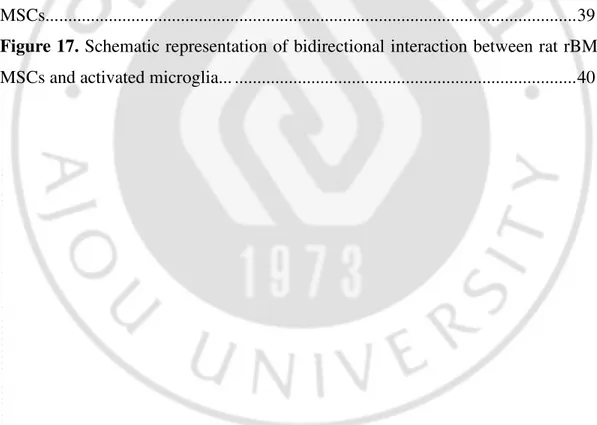
every 3 days. Upon reaching a confluence of 70–80%, cells were subcultured at a ratio of 1: 4 for up to four passages. rBM-MSCs from SD rat were characterised with anti-CD34 monoclonal antibody as negative control and anti-CD29 and CD44 antibodies as positive marker. rBM-MSCs were highly stained with only positive markers (Figure 1), which are consistent with previous report (28)
- 6 -
Figure 1. Immunocytochemical analysis of surface markers on rat bone marrow-derived mesenchymal stem cells (rBM-MSCs). rBM-MSCs from SD rat characterised by Immunocytochemistry (ICC) with the following positive markers: CD29, CD45, and negative marker: CD34.
- 7 - 2.2. Rat microglia primary cultures
Microglial primary cultures were obtained from the midbrain of one-day-old Sprague Dawley (SD) rat pups purchased from Nara Bio (Gyeonggi, South Korea). Briefly, mid-brain tissues were isolated from rat pups and rinsed with minimum essential medium (MEM; HyClone, USA) containing 10% FBS, 100 U/mL penicillin, and 100 μg/mL streptomycin sulphate (HyClone, USA). Tissues were mechanically dissociated, and the cells were plated in 10 cm culture dishes (SPL, South Korea). After 13–15 days, the microglia were detached from the flasks and applied to a nylon mesh to remove astrocytes. The collected microglia were cultured in control media in a humidified chamber at 5% CO2 and 37°C. Microglia were trypsinized and
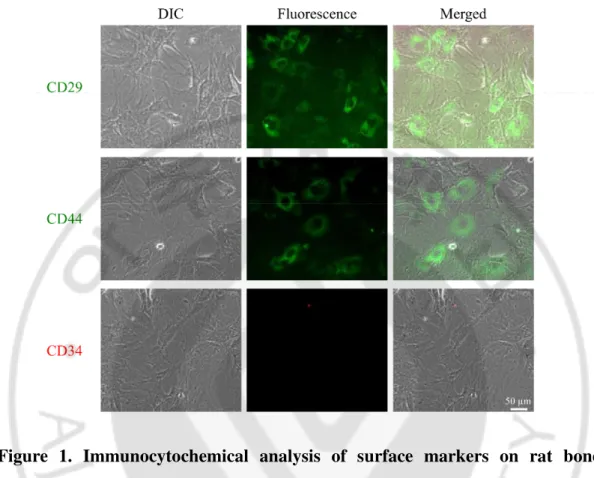
washed twice with PBS and fixed in Cytofix buffer (BD, USA) for 30 min at room temperature. Cells were incubated 1 h at room temperature with anti-Iba1 mouse monoclonal antibody (1: 100, Santa Cruz Biotechnology, USA) for characterisation of microglia. Cells were washed twice with PBS and incubated with FITC-conjugated anti-mouse goat antibody (1: 100, Vector Laboratories, USA) in PBS for 1 h in ice. After washing twice with PBS, labeled cells were analysed by a flow cytometer (FACS Aria II™, BD, USA). Cells showed high expression (~86.5%) of positive marker (Figure 2).
- 8 -
Figure 2. Flow cytometry analysis of Iba1 positive cells in primary microglia isolated from SD rat pups. Flow cytometry analysis was performed by staining with anti-Iba1. The percentage of Iba1 positive cells were determined as purity of microglia. (86.5%)
- 9 -
2.3. Coculture of LPS-stimulated or non-stimulated microglia and rBM-MSCs The effects of LPS-stimulated microglia on rBM-MSCs and of rBM-MSCs on LPS-stimulated microglia were investigated using Costar transwell system as previously reported (23), which consists of coculture without direct cell contact between both populations. Subject groups of cells (1–2 × 10⁵ cells/well) were seeded in the bottom chamber, and effector groups of cells (1 × 10⁴ cells/well) were seeded in the insert (0.4 μm pore size; Corning, USA). LPS stimulation of microglia was performed with 100 ng/mL LPS (Sigma, USA) for 4 h prior to coculture. After coculture for 12 h, rBM-MSCs or microglia of subject groups were isolated and processed for further evaluations. Microglial activation was estimated by their morphological differences. Swelled microglia cells with rounder morphology were considered as activated microglia based on criteria for activated microglia (29, 30). Images were acquired with an optical lens and an Axiovert 200M fluorescence microscope (Zeiss, Jena, Germany).
2.4. Total RNA isolation and microarray analysis.
Differences in gene expression in subject groups of rBM-MSCs or microglia were analysed using the Illumina system (Illumina, USA) in conjunction with Sentrix Rat-Ref-12-v1 Expression Bead Chips including gene-specific oligonucleotides (~22,000 genes, Illumina, USA). Briefly, Total RNA was isolated with TRIzol reagent (Invitrogen, Carlsbad, CA, USA) according to standard procedures. And the RNA quality and integrity were checked using Agilent Bioanalyzer Nano chip. c RNA amplification and labeling with biotin were performed using Illumina total prep RNA amplification kit (ambion, Inc., austin, TX) with 250 ng of total RNA as input material. cRNA yields were quantified with Agilent Bioanalyzer and 1.5 μg of cRNA was hybridized to Expression Bead Chip. cRNA was hybridized to arrays for 16 h at 58°C, washed and stained with streptavidin-Cy3 according to the manufacturer's protocol. Then the bead chips were centrifuged to dry and scanned on the Illumina
- 10 -
Bead Array Reader confocal scanner. Differences in data distribution were analysed using Bead Studio software (Illumina, USA). Probe signals were quantile normalised, and those with a p-value of less than 0.05 were selected for further analysis.
2.5. Transcriptomic analysis using Ingenuity Pathway Analysis
Gene ontology and biological pathways and functions were determined using the web-based bioinformatics software Ingenuity Pathway Analysis (IPA; Ingenuity Systems, USA). A ±1.2 fold-change in expression levels was used as a cut-off to produce data sets of genes with a significantly changed expression. When a stringent ±1.5 cut-off was applied, the groups (experimental and control) cannot be assessed and the biological function of the gene network cannot be predicted. This is mainly because of the low abundance of changed genes (Figure 3,4, and 5). Genes related to same molecular functions were grouped and depicted as a network with indicate direct and indirect relationships as previous reported (31, 32).
- 11 -
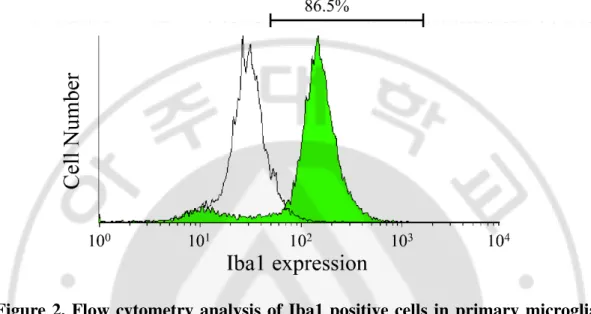
Figure 3. Transcriptomic network analysis in four different culture conditions of rBM-MSCs (>1.5 fold-change). Gene network related to cell migration was constructed algorithmically using Ingenuity Pathway Analysis. Transcriptome network of (a) rBM-MSCs cocultured with microglia, (b) LPS-treated rBM-MSCs, and (c) rBM-MSCs cocultured with LPS-stimulated microglia compared to control (rBM-MSCs only), respectively were shown. Red and green areas indicate up- and down-regulated genes, respectively. Differentially expressed genes were obtained from microarray data.
- 12 -
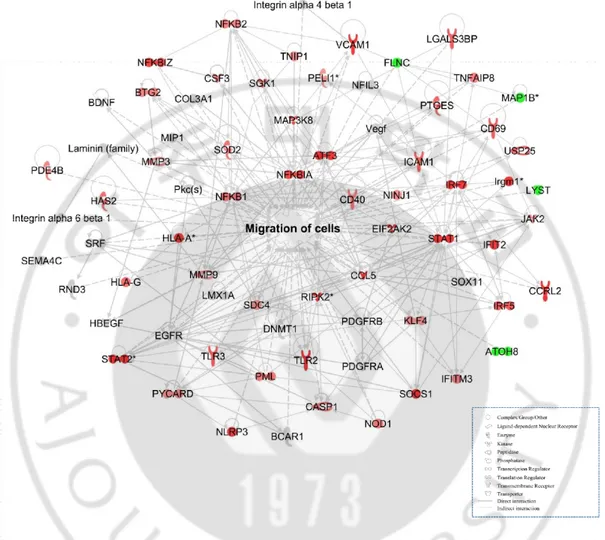
Figure 4. Gene network related to cell migration in rBM-MSCs cocultured with LPS-stimulated microglia compared to rBM-MSCs cocultured with microglia (>1.5 fold-change). Gene network related to cell migration was constructed algorithmically using Ingenuity Pathway Analysis. Red and green areas indicate up- and down-regulated genes, respectively. Differentially expressed genes were obtained from microarray data.
- 13 -
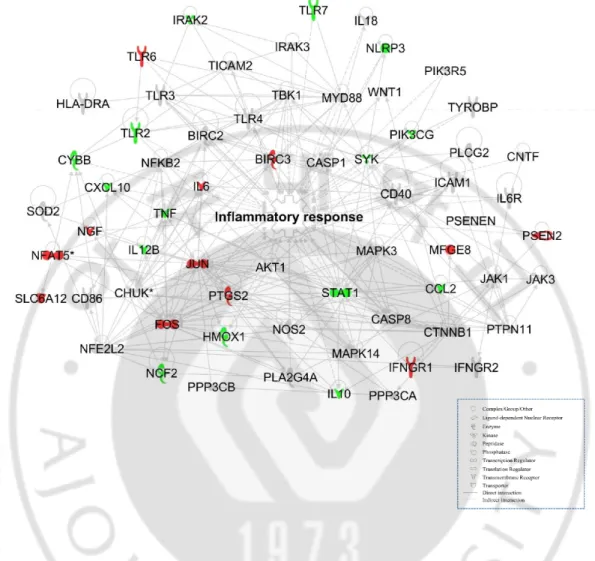
Figure 5. Gene network related to inflammatory response in LPS-stimulated microglia cocultured with rBM-MSCs compared to microglia only (>1.5 fold-change). Gene network related to inflammatory response was constructed algorithmically using Ingenuity Pathway Analysis. Red and green areas indicate up- and down-regulated genes, respectively. Differentially expressed genes were obtained from microarray data.
- 14 - 2.6. Quantitative real-time PCR (qPCR)
The expression levels of genes were quantified with qPCR using SsoAdvanced Universal SYBR Green Supermix real-time PCR kit (Bio-Rad, USA) and cDNA and gene-specific primer pairs (Tables 1 and 2) on a Rotor-Gene Q system (Qiagen, USA). Reaction conditions were as follows: 95°C for 5 min, followed by 50 cycles of 95°C for 5 s and 60°C for 30 s. The threshold/quantification cycle (Ct/Cq) value was determined as the point where the detected fluorescence was statistically higher than the background levels. PCR products were analysed using melting curves constructed with Rotor-Gene 1.7 software (Qiagen, USA). PCR reactions were prepared independently in triplicates. Relative quantification of target gene expression was calculated using the 2−ΔΔCt method.
- 15 -
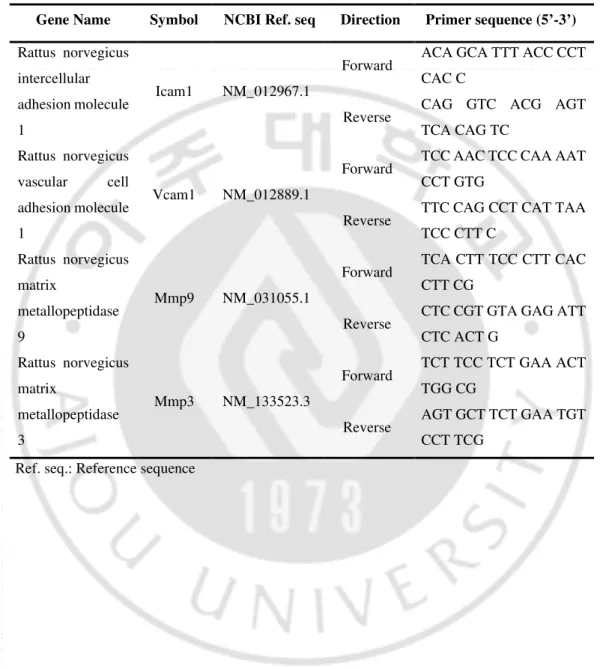
Table 1.: Quantitative real-time PCR primer sequences for genes encoding transcriptomic network related to cell migration
Gene Name Symbol NCBI Ref. seq Direction Primer sequence (5’-3’)
Rattus norvegicus intercellular adhesion molecule 1
Icam1 NM_012967.1
Forward ACA GCA TTT ACC CCT CAC C
Reverse CAG GTC ACG AGT TCA CAG TC Rattus norvegicus vascular cell adhesion molecule 1 Vcam1 NM_012889.1
Forward TCC AAC TCC CAA AAT CCT GTG
Reverse TTC CAG CCT CAT TAA TCC CTT C Rattus norvegicus matrix metallopeptidase 9 Mmp9 NM_031055.1
Forward TCA CTT TCC CTT CAC CTT CG
Reverse CTC CGT GTA GAG ATT CTC ACT G Rattus norvegicus matrix metallopeptidase 3 Mmp3 NM_133523.3
Forward TCT TCC TCT GAA ACT TGG CG
Reverse AGT GCT TCT GAA TGT CCT TCG
- 16 -
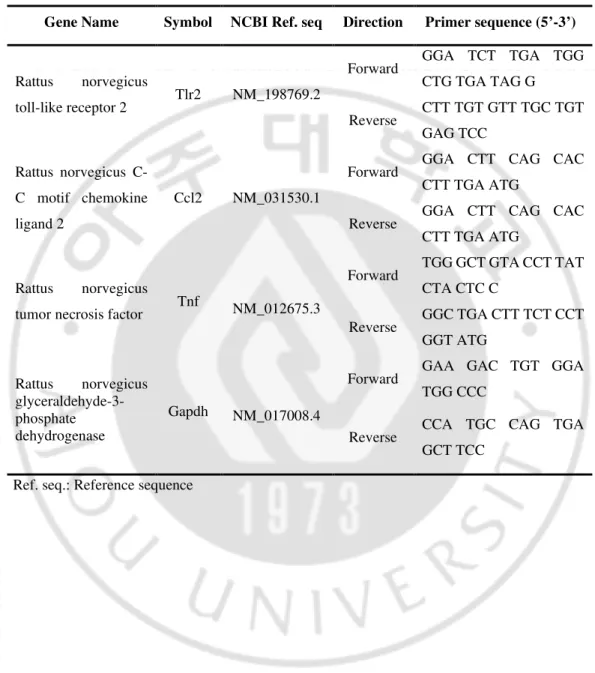
Table 2: Quantitative real-time PCR primer sequences for genes encoding transcriptomic network related to inflammatory response
Gene Name Symbol NCBI Ref. seq Direction Primer sequence (5’-3’)
Rattus norvegicus
toll-like receptor 2 Tlr2 NM_198769.2
Forward GGA TCT TGA TGG CTG TGA TAG G Reverse CTT TGT GTT TGC TGT GAG TCC Rattus norvegicus C-C motif chemokine ligand 2 Ccl2 NM_031530.1
Forward GGA CTT CAG CAC CTT TGA ATG
Reverse GGA CTT CAG CAC CTT TGA ATG
Rattus norvegicus
tumor necrosis factor Tnf NM_012675.3
Forward TGG GCT GTA CCT TAT CTA CTC C Reverse GGC TGA CTT TCT CCT GGT ATG Rattus norvegicus glyceraldehyde-3-phosphate dehydrogenase Gapdh NM_017008.4
Forward GAA GAC TGT GGA TGG CCC
Reverse CCA TGC CAG TGA GCT TCC
- 17 - 2.7. Migration assay
Migratory activity of rBM-MSCs was determined using an 8 μm pore-size transwell system (Corning, USA). The upper side of the insert was coated with Matrigel (1: 10 dilution in 0.01M Tris (pH 8.0), 0.7% NaCl, Corning, USA) for 2 h at 37°C. The bottom chambers contained one of five different conditions for comparison: MEM with 10% FBS as positive control, MEM without FBS as negative control, MEM with 100 ng/mL LPS, 5 × 10⁴ microglia with MEM, and LPS-stimulated 5 × 10⁴ microglia with MEM. Inserts containing 2.5 × 10⁴ rBM-MSCs were overlaid onto each conditioned well and incubated for 12 h. The inserts were gently washed with cold phosphate-buffered saline (PBS), and non-migrating cells remaining in the upper side of the inserts were removed with a cotton swab. The insert was fixed in Cytofix buffer (BD, San Jose, CA, USA) at 4°C for 30 min and stained with 10 μg/mL Hoechst 33342 at RT for 10 min. After washing twice with PBS, images were acquired using an Axiovert 200M fluorescence microscope (Zeiss, Jena, Germany). The excitation wavelength for Hoechst 33342 was 405 nm. Migrating cells were counted in ten random 378.27 mm2 (710.52 μm× 532.38 μm)
microscopic fields using ImageJ software.
2.8. Statistical analysis
Results were analysed using one-way analysis of variance (ANOVA) with Bonferroni’s multiple comparison test as a post hoc test and IBM-SPSS software (IBM, USA). I performed more than three independent experiments and carried out statistical analysis. Differences were considered significant for p values < 0 05.
- 18 -
3. Results
3.1. Cellular movement-related transcriptomic changes in rat bone marrow- derived mesenchymal stem cells (rBM-MSCs) cocultured with LPS-stimulated microglia
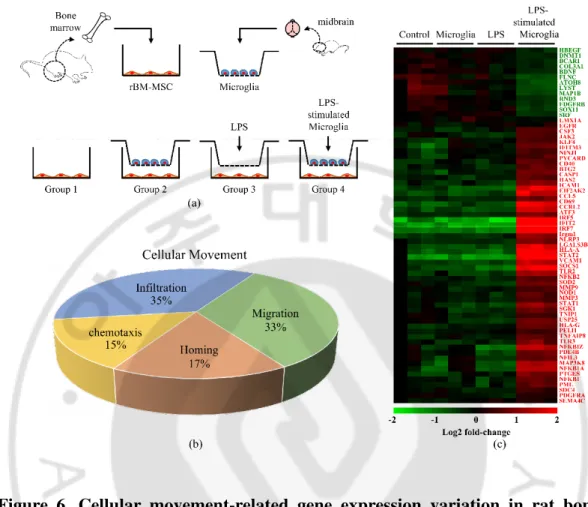
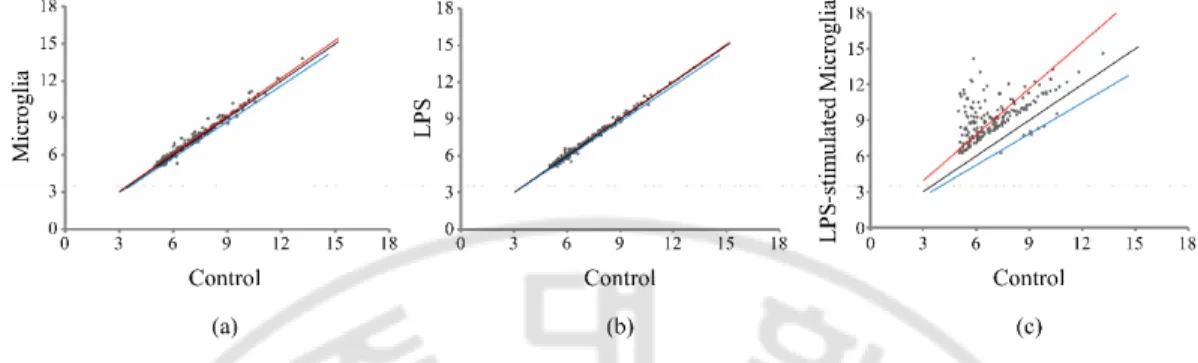
To evalutate the effect of LPS-stimulated microglia on rBM-MSCs, an in vitro coculture method was used (Figure 6(a)). For this study, rBM-MSCs were isolated from 8–12-week-old SD rats and primary microglia from the midbrain of 1-day-old rat pups. Groups of rBM-MSCs were seeded onto the bottom chamber and subjected to 4 different conditions (groups 1–4). Group 1 was the rBM-MSC-only control, group 2 was the coculture with microglia, group 3 was the LPS-treated rBM-MSCs, and group 4 was the coculture with LPS-stimulated microglia. There were no significant changes in cell density of rBM-MSCs (data not shown). In a microarray distribution analysis, gene expression was altered in groups 2, 3, and 4 compared to that of the control (Figure 7). Additionally, the most pronounced variation in the gene expression pattern was observed in group 4. Gene ontology analysis of the transcriptome from group 4 revealed that genes from several canonical pathways such as interferon signalling, death receptor signalling, hepatic fibrosis, and neuroinflammation showed variation in expression levels (Table 3). Expression of genes related to cellular functions, including death, survival, cell cycle, and cellular movement, was also highly altered in group 4 (Figure 8). I focused on the role of cell movement, because the homing of MSCs to the injury site is important for exerting anti-inflammatory effects (33). For detailed transcriptomic analysis of cellular movement, Genes related to cellular movement with altered expression were selected by IPA (Figure 6(b)). Heat map analysis showed clear differences in the gene expression pattern in group 4 compared to the control (Figure 6(c)).
- 19 -
Figure 6. Cellular movement-related gene expression variation in rat bone marrow-derived mesenchymal stem cells (rBM-MSCs) cocultured with LPS-stimulated microglia. (a) In vitro coculture experimental design. Four different conditions were used (groups 1–4): group 1, rBM-MSCs only (control); group 2, rBM-MSCs cocultured with microglia; group 3, LPS-treated rBM-MSCs; and group 4, rBM-MSCs cocultured with LPS-stimulated microglia. (b) Gene categorisation according to subgroups related to cellular movement. Genes involved with cellular movement were categorised in subgroups (chemotaxis, homing, migration, and infiltration) based on microarrays and Ingenuity Pathway Analysis. (c) Heat map of genes related to cell migration in the 4 different groups with altered expression levels. Gene expression values are coloured from green (downregulated) to red (upregulated).
- 20 -
Figure 7. Plotting of signal intensities in three different culture conditions of rat bone marrow-derived mesenchymal stem cells (rBM-MSCs) compared to control (rBM-MSCs only). Correlation of gene expression variation in experimental groups. The X axes indicate the signal intensities of control and Y axes indicate (a) rBM-MSCs cocultured with microglia, (b) LPS-treated rBM-MSCs, and (c) rBM-MSCs cocultured with LPS-stimulated microglia, respectively. The black line indicates the criterion line which is standardized with control intensities.
- 21 -
Table 3. Top 20 canonical pathways constructed algorithmically by Ingenuity Pathway Analysis in rat bone marrow-derived mesenchymal stem cells (rBM-MSCs) cocultured with lipopolysaccharide (LPS)-stimulated microglia compared to rBM-MSCs cocultured with microglia
Canonical Pathways
-log(p-value)
Number of genes
Interferon Signaling 13.7 20
Death Receptor Signaling 10.6 28
Hepatic Fibrosis / Hepatic Stellate Cell Activation 9.1 39
Neuroinflammation Signaling Pathway 8.71 53
iNOS Signaling 8.38 17
Activation of IRF by Cytosolic Pattern Recognition Receptors 8.21 20
TREM1 Signaling 7.51 21
Protein Ubiquitination Pathway 7.01 44
PPAR Signaling 6.87 23
Apoptosis Signaling 6.68 22
Role of JAK1, JAK2 and TYK2 in Interferon Signaling 6.65 11
Osteoarthritis Pathway 6.55 37
Granulocyte Adhesion and Diapedesis 6.47 33
TNFR2 Signaling 6.41 12
Role of Macrophages, Fibroblasts and Endothelial Cells in Rheumatoid
Arthritis 6.15 47
Colorectal Cancer Metastasis Signaling 6.09 49
IL-10 Signaling 6.03 18
Role of Pattern Recognition Receptors in Recognition of Bacteria and
Viruses 6 27
TNFR1 Signaling 5.96 15
- 22 -
Figure 8. Top 20 list of function or diseases constructed algorithmically by Ingenuity Pathway Analysis (IPA) in rat bone marrow-derived mesenchymal stem cells (rBM-MSCs) cocultured with LPS-stimulated microglia compared to rBM-MSCs cocultured with microglia
- 23 -
3.2. Functional prediction of transcriptomic networks in rBM-MSCs cocultured with LPS-stimulated microglia
To acquire detailed information of the genes showing variation in expression, Cell movement-related gene expression networks of groups 2, 3, and 4 compared to the network of group 1 were generated using IPA (Figure 9). The most pronounced alternation in the gene expression networks were also observed in group 4, and the related genes were linked with direct relationships. Based on up- or downregulation and stream relationships, prediction analysis of the networks showed that cell migration is predicted to be activated in group 4 (Figure 10(a) and Table 4). Four genes with altered expression levels were identified as being highly related to the migratory activity of cells, which was confirmed using quantitative qPCR (Figure 10(b)). The expression levels of matrix metallopeptidases 3 and 9 (Mmp3 and Mmp9, resp.), vascular cell adhesion protein 1 (Vcam1), and intercellular adhesion molecule 1 (Icam1) were significantly higher in group 4 than in group 2.
- 24 -
Figure 9. Transcriptomic network analysis in four different culture conditions of rat bone marrow-derived mesenchymal stem cells (rBM-MSCs). Gene network related to cell migration was constructed algorithmically using Ingenuity Pathway Analysis. Transcriptome network of (a) rBM-MSCs cocultured with microglia, (b) treated rBM-MSCs, and (c) rBM-MSCs cocultured with LPS-stimulated microglia compared to control (rBM-MSCs only), respectively were shown. Red and green areas indicate up- and down-regulated genes, respectively. Differentially expressed genes were obtained from microarray data (>1.2 fold-change).
- 25 -
Figure 10. Increase in migration of rat bone marrow-derived mesenchymal stem cells (rBM-MSCs) cocultured with LPS-stimulated microglia. (a) Gene network related to cell migration was constructed, and cellular function was predicted algorithmically using Ingenuity Pathway Analysis. Red and green areas indicate up- and downregulated genes, respectively. Differentially expressed genes were obtained from microarray data (>1.2 fold-change). (b) Quantitative real-time PCR analysis of gene expression related to cell migration in rBM-MSCs cocultured with LPS-stimulated microglia compared to rBM-MSCs cocultured with microglia. Data represent the mean of three independent experiments. (mean ± SD) *p <0.05 versus rBM-MSCs cocultured with microglia.
- 26 -
Table 4. 67 genes related to cell migration in rat bone marrow-derived mesenchymal stem cells (rBM-MSCs) cocultured with LPS-stimulated microglia compared to rBM-MSCs cocultured with microglia
No. Symbol Illumina Expr Fold Change Location
1 LYST ILMN_1367296 -1.84 Cytoplasm 2 FLNC ILMN_1360121 -1.64 Cytoplasm 3 MAP1B ILMN_1362692 -1.59 Cytoplasm 4 RND3 ILMN_1376851 -1.43 Cytoplasm 5 PELI1 ILMN_1357813 1.53 Cytoplasm 6 PYCARD ILMN_1372174 1.61 Cytoplasm 7 JAK2 ILMN_1361170 1.72 Cytoplasm 8 PDE4B ILMN_1353078 1.73 Cytoplasm 9 TNFAIP8 ILMN_1357231 1.81 Cytoplasm 10 NOD1 ILMN_1365499 1.93 Cytoplasm 11 SOD2 ILMN_1367263 2.01 Cytoplasm 12 CASP1 ILMN_1361826 2.07 Cytoplasm 13 USP25 ILMN_1363065 2.21 Cytoplasm 14 PTGES ILMN_1353392 2.24 Cytoplasm 15 SGK1 ILMN_1349269 2.35 Cytoplasm 16 MAP3K8 ILMN_1359072 2.46 Cytoplasm 17 NFKBIA ILMN_1356628 2.64 Cytoplasm 18 NLRP3 ILMN_1362786 2.83 Cytoplasm 19 SOCS1 ILMN_1371295 4.18 Cytoplasm 20 EIF2AK2 ILMN_1376267 5.19 Cytoplasm 21 Irgm1 ILMN_1376472 13.69 Cytoplasm 22 IFIT2 ILMN_1364134 32.84 Cytoplasm 23 BDNF ILMN_1360447 -1.45 Extracellular Space 24 COL3A1 ILMN_1354941 -1.28 Extracellular Space 25 HBEGF ILMN_1357783 -1.26 Extracellular Space 26 MMP9 ILMN_2039240 1.81 Extracellular Space 27 MMP3 ILMN_1361666 1.86 Extracellular Space 28 CSF3 ILMN_1349473 1.94 Extracellular Space 29 CCL5 ILMN_1355610 5.17 Extracellular Space 30 ATOH8 ILMN_1363251 -1.99 Nucleus 31 SOX11 ILMN_1359646 -1.49 Nucleus 32 SRF ILMN_1362760 -1.37 Nucleus
- 27 -
No. Symbol Illumina Expr Fold Change Location
33 DNMT1 ILMN_1350922 -1.33 Nucleus 33 DNMT1 ILMN_1350922 -1.33 Nucleus 34 LMX1A ILMN_1350102 -1.22 Nucleus 35 NFIL3 ILMN_1360188 1.47 Nucleus 36 KLF4 ILMN_1356110 1.56 Nucleus 37 TNIP1 ILMN_1357549 1.56 Nucleus 38 BTG2 ILMN_1368809 1.76 Nucleus 39 NFKB2 ILMN_1374155 1.83 Nucleus 40 PML ILMN_1359403 1.87 Nucleus 41 NFKB1 ILMN_1367023 1.90 Nucleus 42 IRF5 ILMN_1362902 2.40 Nucleus 43 NFKBIZ ILMN_1362295 2.67 Nucleus 44 STAT1 ILMN_1372159 3.01 Nucleus 45 ATF3 ILMN_1363083 4.38 Nucleus 46 STAT2 ILMN_1376440 6.55 Nucleus 47 IRF7 ILMN_1352469 36.26 Nucleus 48 PDGFRB ILMN_1360414 -1.43 Plasma Membrane 49 BCAR1 ILMN_1364063 -1.22 Plasma Membrane 50 EGFR ILMN_1362571 1.24 Plasma Membrane 51 PDGFRA ILMN_1355008 1.25 Plasma Membrane 52 SEMA4C ILMN_1364995 1.27 Plasma Membrane 53 SDC4 ILMN_1352387 1.53 Plasma Membrane 54 NINJ1 ILMN_1354493 1.55 Plasma Membrane 55 IFITM3 ILMN_1352762 1.79 Plasma Membrane 56 CD40 ILMN_1355111 1.93 Plasma Membrane 57 HLA-G ILMN_1360773 2.06 Plasma Membrane 58 HAS2 ILMN_1370907 2.07 Plasma Membrane 59 ICAM1 ILMN_1354506 2.25 Plasma Membrane 60 LGALS3BP ILMN_1352246 2.30 Plasma Membrane 61 CD69 ILMN_1360103 2.34 Plasma Membrane 62 TLR3 ILMN_1355463 2.35 Plasma Membrane 63 RIPK2 ILMN_1352868 3.58 Plasma Membrane 64 CCRL2 ILMN_1362435 5.39 Plasma Membrane 65 HLA-A ILMN_1376270 5.41 Plasma Membrane 66 TLR2 ILMN_1353896 6.24 Plasma Membrane 67 VCAM1 ILMN_1364472 23.76 Plasma Membrane Expr Fold Change: Experimental fold chang
- 28 -
3.3. Increased migratory activity in rBM-MSCs cocultured with LPS-stimulated microglia
Based on the transcriptomic analysis and prediction, there were changes in migratory activity of rBM-MSC influenced by LPS-stimulated microglia. To test the prediction, FBS-containing media condition was used as positive control, and the number of migrating cells was significantly increased in rBM-MSCs when cocultured with LPS-stimulated microglia (Figures 11(a) and 11(b)).
- 29 -
Figure 11. Migration assays with rat bone marrow-derived mesenchymal stem cells (rBM-MSCs) cocultured with LPS-stimulated microglia. (a) Images of migrated rBM-MSCs. Migratory activity of rBM-MSCs was examined under 5 different conditions: with foetal bovine serum (FBS) media (positive control), without FBS media (negative control), LPS-treated, cocultured with microglia, and cocultured with LPS-stimulated microglia. Migrating cells are colored cyan (10× magnification). Representative migration images are shown for each condition. Scale bar: 100 µm. (b) Migrating cells were quantified by counting colored dots in the images. Data represent the mean of ten random 372.23 mm2 (710.52 µm × 532.38 µm) microscopic fields (mean ±SD). *p < 0.05 vs. negative control (media without FBS).
- 30 -
3.4. Transcriptomic analysis in LPS-stimulated microglia cocultured with rBM-MSCs
The effects of rBM-MSCs on LPS-stimulated microglia were also determined via reversed conditions of the aforementioned coculture system in vitro. To that end, microglia were seeded on the bottom chamber as subject groups and subjected to 3 different conditions: control, LPS stimulation, and LPS stimulation with rBM-MSC coculture (Figure 12(a)). There were no significant changes in cell density of microglia (data not shown). The transcriptome of subject groups was analysed using microarrays and IPA. Comparison between LPS stimulation and LPS stimulation with rBM-MSC coculture showed changes in expression levels of genes related to cancer, organismal injury and abnormalities, and cell death (Figure 13). Gene ontology analysis of the transcriptome revealed altered expression levels of genes related to inflammatory response related canonical pathways such as triggering receptor expressed on myeloid cell 1 (TREM1) signalling, neuroinflammation, and rheumatoid arthritis (Table 4 and Figure 12(b)). Expression of genes related to TREM1 signalling and neuroinflammation was especially suppressed, as predicted (negative z-score). Focused gene expression analysis of the inflammatory response showed significantly altered levels in 64 genes between groups (Figure 12(c)). Although the differences were more pronounced after LPS stimulation, remarkable changes were also observed between the presence and absence of rBM-MSCs.
- 31 -
Figure 12. Inflammation-related gene expression variation in LPS-stimulated microglia cocultured with rat bone marrow-derived mesenchymal stem cells (rBM-MSCs). (a) In vitro reverse coculture experimental design. Three different conditions were used (group 1–3): group 1, control (microglia only); group 2, LPS-stimulated microglia; and group 3, LPS-stimulation with rBM-MSC coculture. (b) Canonical pathway analysis was constructed algorithmically using Ingenuity Pathway Analysis based on microarray data. Bars indicate canonical pathways containing genes with significantly altered expression. Bar graph colours from blue (inhibition) to orange (activation) represent gene activity of the corresponding pathway according to z-score. (c) Heat map of genes related to inflammation with altered expression levels. Gene expression values are coloured from green (downregulated) to red (upregulated).
- 32 -
Figure 13. Top 20 list of function or diseases constructed algorithmically by Ingenuity Pathway Analysis in LPS-stimulated microglia cocultured with rat bone marrow-derived mesenchymal stem cells (rBM-MSCs) compared to LPS-stimulated microglia.
- 33 -
Table 5. Top 20 canonical pathways constructed algorithmically by Ingenuity Pathway Analysis in LPS-stimulated microglia cocultured with rat bone marrow-derived mesenchymal stem cells (rBM-MSCs) compared to LPS-stimulated microglia
Canonical Pathways -log(p-value) Number of
genes
TREM1 Signaling 11.7 31
Neuroinflammation Signaling Pathway 10.4 73
Role of Macrophages, Fibroblasts and Endothelial Cells in
Rheumatoid Arthritis 9.65 70
Dendritic Cell Maturation 8.54 49
iNOS Signaling 7.17 19
IL-10 Signaling 7.04 24
Type I Diabetes Mellitus Signaling 6.93 31
Th1 Pathway 6.87 35
Role of PKR in Interferon Induction and Antiviral Response 6.83 18
Th1 and Th2 Activation Pathway 6.82 43
PI3K Signaling in B Lymphocytes 6.45 34
Altered T Cell and B Cell Signaling in Rheumatoid Arthritis 6.31 26
Colorectal Cancer Metastasis Signaling 5.97 51
JAK/Stat Signaling 5.88 24
Role of Pattern Recognition Receptors in Recognition of
Bacteria and Viruses 5.81 33
Crosstalk between Dendritic Cells and Natural Killer Cells 5.75 25
HMGB1 Signaling 5.64 32
Production of Nitric Oxide and Reactive Oxygen Species in
Macrophages 5.51 42
Death Receptor Signaling 5.46 25
- 34 -
3.5. Functional prediction of transcriptomic networks and reduced inflammatory response in LPS-stimulated microglia cocultured with rBM-MSCs
To examine differences in transcriptomes between LPS-stimulated microglia with and without rBM-MSCs, gene expression networks related to inflammatory were generated using IPA in the corresponding groups (Figure 14 and Table 5). A total of 65 genes highly related to the inflammatory response were identified, and the genes were directly linked. Based on the differential expression (upregulation or downregulation), prediction analysis of networks showed that the inflammatory response is predicted to be inhibited by rBM-MSCs (Figure 15(a) and Table 6). Three genes with altered expression levels were highly related to inflammation, which was confirmed using qPCR (Figure 15(b)). LPS-induced upregulated levels of tumor necrosis factor (Tnf), C-C motif chemokine ligand 2 (Ccl2), and toll-like receptor 2 (Tlr2) genes were significantly decreased after coculture with rBM-MSCs. These predicted functional results were confirmed in experiments using cell cultures, where the number of activated cells induced by LPS stimulation showing swelled and round morphology was significantly decreased by rBM-MSCs (Figure 15(c)). Moreover, the levels of protein markers for microglial activation, CD40 and CD74, were also lower in the presence of rBM-MSC than after LPS stimulation without rBM-MSC, indicating that direct phenotypical activation of microglia was reduced by rBM-MSCs (Figure 16).
- 35 -
Figure 14. Transcriptomic network analysis in two different culture conditions of LPS-stimulated microglia. Gene network related to inflammatory response was constructed algorithmically using Ingenuity Pathway Analysis. Transcriptome network of (a) LPS-stimulated microglia and (b) LPS-stimulated microglia cocultured with rBM-MSCs compared to control (microglia only), respectively were shown. Red and green areas indicate up- and down-regulated genes, respectively. Differentially expressed genes were obtained from microarray data (>1.2 fold-change).
- 36 -
Figure 15. Reduced inflammatory response in LPS-stimulated microglia cocultured with rat bone marrow-derived mesenchymal stem cells (rBM-MSCs). (a) Gene network related to inflammatory response was constructed, and cellular function was predicted algorithmically using Ingenuity Pathway Analysis. Red and green areas indicate up- and downregulated genes, respectively. Differentially expressed genes were obtained from microarray data (>1.2 fold-change). (b) Quantitative real-time PCR analysis of gene expression-related inflammation in LPS-stimulated microglia cocultured with rBM-MSCs compared to control (microglia only). (c) Activated microglia were counted in light microscopy images and quantified as the percentage of activated microglia/total cell number. Cells at the edge of the images were not counted. Scale bar: 20 μm. ∗p < 0.05 and ∗∗p < 0.01 versus control (microglia only).
- 37 -
Table 6. 64 genes related to inflammatory response in LPS-stimulated microglia cocultured with rat bone marrow-derived mesenchymal stem cells (rBM-MSCs) compared to LPS-stimulated microglia
No. Symbol Illumina Expr Fold Change Location
1 AKT1 ILMN_1353102 -1.35 Cytoplasm 2 BIRC2 ILMN_1650704 1.47 Cytoplasm 3 BIRC3 ILMN_1365233 1.67 Cytoplasm 4 CASP1 ILMN_1361826 -1.27 Cytoplasm 5 CHUK ILMN_2039288 1.24 Cytoplasm 6 CYBB ILMN_1352424 -1.53 Cytoplasm 7 HMOX1 ILMN_1650285 -1.61 Cytoplasm 8 IRAK3 ILMN_1361037 -1.31 Cytoplasm 9 JAK1 ILMN_1354897 -1.38 Cytoplasm 10 JAK3 ILMN_1355371 1.22 Cytoplasm 11 MAPK14 ILMN_1352809 1.35 Cytoplasm 12 MAPK3 ILMN_1366612 -1.31 Cytoplasm 13 NCF2 ILMN_1365484 -1.71 Cytoplasm 14 NLRP3 ILMN_1362786 -1.66 Cytoplasm 15 NOS2 ILMN_1372107 1.38 Cytoplasm 16 PIK3CG ILMN_1351492 -1.59 Cytoplasm 17 PIK3R5 ILMN_1350193 -1.32 Cytoplasm 18 PLA2G4A ILMN_1360060 1.21 Cytoplasm 19 PLCG2 ILMN_1367941 -1.28 Cytoplasm 20 PPP3CA ILMN_1372414 1.29 Cytoplasm 21 PSEN2 ILMN_1368494 1.53 Cytoplasm 22 PTGS2 ILMN_1349422 3.05 Cytoplasm 23 PTPN11 ILMN_1363069 -1.26 Cytoplasm 24 SOD2 ILMN_1367263 -1.25 Cytoplasm 25 SYK ILMN_1350279 -1.53 Cytoplasm 26 TBK1 ILMN_1367327 -1.42 Cytoplasm 27 CCL2 ILMN_1368224 -2.44 Extracellular Space 28 CNTF ILMN_1349254 1.27 Extracellular Space 29 CXCL10 ILMN_1364335 -1.84 Extracellular Space 30 IL10 ILMN_1369848 -1.63 Extracellular Space 31 IL12B ILMN_1354970 -1.54 Extracellular Space 32 IL18 ILMN_1352725 -1.34 Extracellular Space
- 38 -
No. Symbol Illumina Expr Fold Change Location
33 IL6 ILMN_1355154 1.61 Extracellular Space 34 MFGE8 ILMN_1363839 1.57 Extracellular Space 35 NGF ILMN_1362230 1.92 Extracellular Space 36 TNF ILMN_1357947 -2.55 Extracellular Space 37 WNT1 ILMN_1358775 1.21 Extracellular Space 38 CASP8 ILMN_1371431 -1.24 Nucleus 39 CTNNB1 ILMN_1352752 -1.34 Nucleus 40 FOS ILMN_1368356 5.65 Nucleus 41 JUN ILMN_1365705 1.74 Nucleus 42 NFAT5 ILMN_1373056 1.57 Nucleus 43 NFE2L2 ILMN_1372879 -1.34 Nucleus 44 NFKB2 ILMN_1374155 1.46 Nucleus 45 STAT1 ILMN_1372159 -1.54 Nucleus 46 CD40 ILMN_1355111 -1.38 Plasma Membrane 47 CD86 ILMN_1374614 1.21 Plasma Membrane 48 HLA-DRA ILMN_1376935 -1.28 Plasma Membrane 49 ICAM1 ILMN_1354506 -1.22 Plasma Membrane 50 IFNGR1 ILMN_1366851 2.55 Plasma Membrane 51 IFNGR2 ILMN_1356831 -1.26 Plasma Membrane 52 IL6R ILMN_1349175 1.41 Plasma Membrane 53 IRAK2 ILMN_1373683 -1.65 Plasma Membrane 54 MYD88 ILMN_1359024 -1.23 Plasma Membrane 55 PPP3CB ILMN_1351926 -1.23 Plasma Membrane 56 PSENEN ILMN_1374774 1.20 Plasma Membrane 57 SLC6A12 ILMN_1353136 1.90 Plasma Membrane 58 TICAM2 ILMN_1357791 -1.21 Plasma Membrane 59 TLR2 ILMN_1353896 -2.57 Plasma Membrane 60 TLR3 ILMN_1355463 -1.30 Plasma Membrane 61 TLR4 ILMN_1364385 -1.24 Plasma Membrane 62 TLR6 ILMN_1356202 1.53 Plasma Membrane 63 TLR7 ILMN_1371182 -1.56 Plasma Membrane 64 TYROBP ILMN_1372404 1.26 Plasma Membrane Expr Fold Change: Experimental fold change
- 39 -
(a) (b)
Figure 16. Western blot analysis in LPS-stimulated microglia cocultured with rat bone marrow-derived mesenchymal stem cells (rBM-MSCs). (a) Total Protein was extracted from microglia in three different conditions. Samples were resolved on a 15% gel and western blotting was performed using anti-CD40 and CD74 antibodies. β-actin served as a loading control. (b) The graph shows quantification of western blot bands. Data represent the mean of three independent experiments. (mean ± SD).
- 40 -
Figure 17. Schematic representation of bidirectional interaction between rat bone marrow-derived mesenchymal stem cells (rBM-MSCs) and activated microglia. Activated microglia increased movement of rBM-MSCs in rBM-MSCs cocultured with LPS-stimulated microglia in an in vitro coculture system. rBM-MSCs decreased the inflammation of activated microglia in a reversal coculture system.
- 41 -
4. Discussion
This research is the first bidirectional comprehensive investigation of the interaction between activated microglia and MSCs through transcriptomic analysis. Activated microglia increase migration of rBM-MSCs and that rBM-MSCs reduce inflammation of activated microglia at the cellular network level were shown. And bidirectional cellular interaction that occur between rBM-MSCs and LPS-stimulated microglia using transcriptomics (Figure 17). The results show that LPS-stimulated microglia help homing of rBM-MSCs via inducing transcriptomic changes and that rBM-MSCs reduce the inflammation of microglia by alternating the expression of the relevant genes.
Transplanted BM-MSCs migrate to the ischaemic border zone in animal models of stroke (34, 35), and to the substantia nigra (SN) induced by LPS and MPTP administration in animal models of Parkinson’s disease (23), in which inflammatory regions contain activated microglia. Additionally, BM-MSCs migrate to LPS-stimulated microglia in vitro in response to chemotactic factors (27). These reports indicate that activated microglia are a possible cause of movement of rBM-MSCs to the site of injury. However, detailed transcriptomic mechanisms of how activated microglia induce the movement of BM-MSCs are not well understood. In this study, the expression levels of 67 genes were significantly altered, and that network analysis predicted an increase in migration activity was shown. Meanwhile, CXCR4 receptor and its ligand stromal cell-derived factor-1 (SDF-1a) play an important role in homing of MSCs to brain lesions (36). However, there was no changes in microarray data and RT-PCR (data not shown). Further studies concerning the homing effects of rBM-MSC on microglia in coculture systems are needed.
The prediction was confirmed experimentally in rBM-MSCs cocultured with LPS-stimulated microglia compared with control and cells cocultured with microglia. Especially, Mmp3 and 9 are essential enzymes for migratory activity and the corresponding genes are induced in inflammatory conditions via pro-inflammatory
- 42 -
cytokines and oxidative substrates (37, 38). Thus, LPS-stimulated microglia might form a locally conditioned inflammatory region in the coculture system, and rBM-MSCs move toward this region.
Human BM-MSCs (hBM-MSCs) dramatically reduce neural damages in a LPS-stimulated mouse brain and reduce inflammation of microglia owing to the production of cytokines and trophic factors have been reported (39). In addition, co-cultured BM-MSCs reduce the expression of TNF-α and iNOS and NO production in LPS-stimulated microglia compared with non-cocultured BM-MSCs (23, 27). However, the detailed mechanism about how BM-MSCs down-regulate activated microglia has not been well studied. In this study, the expression levels of 64 genes were significantly altered, and gene network predicted the suppression of the inflammatory response were shown. This prediction was experimentally verified in LPS-stimulated microglia cocultured with rBM-MSCs. The results show that the levels of most pro-inflammatory genes were reduced when cocultured with rBM-MSCs. The expression levels of Ccl2, a key mediator of microglia activation (40, 41), were significantly decreased in the presence of rBM-MSCs, indicating anti-inflammatory effects by rBM-MSC. These phenomena may occur as a result of secreted molecules from both rBM-MSCs and LPS-stimulated microglia. Further studies are needed to identify the secreted molecules, i.e., the secretome, that increase invasive migratory activity of rBM-MSCs and decrease the inflammatory response of LPS-stimulated microglia. Therefore, detailed mechanism can be elucidated by connecting secretome of rBM-MSC with receptor of microglia and reverse condition.
There are several limitations in this study. First, ±1.2 fold-change in expression levels was used as a cut-off and identified low level of abundant genes due to the limitation in in vitro coculture system. In general, transwell coculture system has central limitations, such as cell density, fluid concentration, and cell-other cell direct interaction, compared to in vivo (42). However, the transcriptomic analysis for bidirectional effect of each cells and the above approach cannot be done in in vivo
- 43 -
system, due to diversity of cells in organ. The implied biological effect in our results might be more strongly expressed in in vivo were expected. Second, fundamental limitations reside in microarray and bioinformatics analysis. Although microarray is performed with additional probe for compensation of inaccuracies and statistically analysed, the reduction of false positive or negative is a challenging task (43). In addition, bioinformatics tool is constructed with existing knowledge, hence novel finding is limited (44). As a result, unique pathway cannot be deduced in our analysis system and individual analysis for genes can be biased, which could bring about false positive or negative result. Thus, I focused more in cellular process than target molecule. Finally, analysing specific pathway/s or molecule/s are beyond our limitation in this study. To find novel pathway/s or molecule/s, responsible for attracting rBM-MSCs or inflammatory response of microglia identified, other methodological biomolecular approaches are required.
- 44 - CONCLUSION
In conclusion, bidirectional transcriptomic analysis of activated microglia and BM-MSCs were performed. The results indicate that activated microglia in a neuroinflammatory condition enhance the migration of MSCs, and that BM-MSCs reduce microglia mediated inflammation. This study improves understanding of the relationship between activated microglia and transplanted stem cells and may prime to a new therapeutic strategy using stem cell therapy for brain diseases.
- 45 - REFERENCES
1. Lee DY, Jin MS, Manavalan B, Kim HK, Song JH, Shin TH, et al. Bidirectional Transcriptome Analysis of Rat Bone Marrow-Derived Mesenchymal Stem Cells and Activated Microglia in an In Vitro Coculture System. Stem Cells Int. 2018;2018:6126413. 2. Jäkel S, Dimou L. Glial Cells and Their Function in the Adult Brain: A Journey through the History of Their Ablation. Frontiers in Cellular Neuroscience. 2017;11(24). 3. Benraiss A, Wang S, Herrlinger S, Li X, Chandler-Militello D, Mauceri J, et al. Human glia can both induce and rescue aspects of disease phenotype in Huntington disease. Nature Communications. 2016;7(1):11758.
4. Masuda T, Sankowski R, Staszewski O, Prinz M. Microglia Heterogeneity in the Single-Cell Era. Cell Reports. 2020;30(5):1271-81.
5. Salter MW, Stevens B. Microglia emerge as central players in brain disease. Nature medicine. 2017;23(9):1018.
6. Colonna M, Butovsky O. Microglia function in the central nervous system during health and neurodegeneration. Annual review of immunology. 2017;35:441-68.
7. Uccelli A, Benvenuto F, Laroni A, Giunti D. Neuroprotective features of mesenchymal stem cells. Best Practice & Research Clinical Haematology. 2011;24(1):59-64.
8. Beschorner R, Schluesener HJ, Gözalan F, Meyermann R, Schwab JM. Infiltrating CD14+ monocytes and expression of CD14 by activated parenchymal microglia/macrophages contribute to the pool of CD14+ cells in ischemic brain lesions. Journal of neuroimmunology. 2002;126(1-2):107-15.
9. Inoue K, Tsuda M. Microglia in neuropathic pain: cellular and molecular mechanisms and therapeutic potential. Nature Reviews Neuroscience. 2018;19(3):138. 10. Xu L, He D, Bai Y. Microglia-mediated inflammation and neurodegenerative disease. Molecular neurobiology. 2016;53(10):6709-15.
11. McGeer PL, Itagaki S, Boyes BE, McGeer E. Reactive microglia are positive for HLA-DR in the substantia nigra of Parkinson's and Alzheimer's disease brains. Neurology. 1988;38(8):1285-.
12. Thameem Dheen S, Kaur C, Ling E-A. Microglial activation and its implications in the brain diseases. Current medicinal chemistry. 2007;14(11):1189-97.
13. Ajmone-Cat MA, Bernardo A, Greco A, Minghetti L. Non-steroidal anti-inflammatory drugs and brain inflammation: effects on microglial functions.
- 46 - Pharmaceuticals. 2010;3(6):1949-65.
14. Jacobs BL, Van Praag H, Gage F. Adult brain neurogenesis and psychiatry: a novel theory of depression. Molecular psychiatry. 2000;5(3):262-9.
15. Feng Y-L, Tang X-L. Effect of glucocorticoid-induced oxidative stress on the expression of Cbfa1. Chemico-biological interactions. 2014;207:26-31.
16. Uccelli A, Moretta L, Pistoia V. Mesenchymal stem cells in health and disease. Nature Reviews Immunology. 2008;8(9):726-36.
17. Oliveira JT, Mostacada K, de Lima S, Martinez AMB. Chapter Three - Bone Marrow Mesenchymal Stem Cell Transplantation for Improving Nerve Regeneration. In: Geuna S, Perroteau I, Tos P, Battiston B, editors. International Review of Neurobiology. 108: Academic Press; 2013. p. 59-77.
18. Lee P, Kim J, Bang O, Ahn Y, Joo I, Huh K. Autologous mesenchymal stem cell therapy delays the progression of neurological deficits in patients with multiple system atrophy. Clinical Pharmacology & Therapeutics. 2008;83(5):723-30.
19. Bang OY, Lee JS, Lee PH, Lee G. Autologous mesenchymal stem cell transplantation in stroke patients. Annals of Neurology: Official Journal of the American Neurological Association and the Child Neurology Society. 2005;57(6):874-82.
20. Venkataramana N, Pal R, Rao SA, Naik AL, Jan M, Nair R, et al. Bilateral transplantation of allogenic adult human bone marrow-derived mesenchymal stem cells into the subventricular zone of Parkinson’s disease: a pilot clinical study. Stem cells international. 2012;2012.
21. Shin TH, Phukan G, Shim JS, Nguyen D-T, Kim Y, Oh-Lee JD, et al. Restoration of polyamine metabolic patterns in in vivo and in vitro model of ischemic stroke following human mesenchymal stem cell treatment. Stem cells international. 2016;2016.
22. Matthay MA, Pati S, Lee JW. Concise review: mesenchymal stem (stromal) cells: biology and preclinical evidence for therapeutic potential for organ dysfunction following trauma or sepsis. Stem Cells. 2017;35(2):316-24.
23. Kim YJ, Park HJ, Lee G, Bang OY, Ahn YH, Joe E, et al. Neuroprotective effects of human mesenchymal stem cells on dopaminergic neurons through anti-inflammatory action. Glia. 2009;57(1):13-23.
24. Cheng Z, Peng H-l, Zhang R, Fu X-m, Zhang G-s. Bone marrow-derived innate macrophages attenuate oxazolone-induced colitis. Cellular immunology. 2017;311:46-53. 25. Yan K, Zhang R, Sun C, Chen L, Li P, Liu Y, et al. Bone marrow-derived
- 47 -
mesenchymal stem cells maintain the resting phenotype of microglia and inhibit microglial activation. PLoS One. 2013;8(12).
26. Jaimes Y, Naaldijk Y, Wenk K, Leovsky C, Emmrich F. Mesenchymal stem cell-derived microvesicles modulate lipopolysaccharides-induced inflammatory responses to microglia cells. Stem Cells. 2017;35(3):812-23.
27. Jose S, Ramasamy R, Vidyadaran S. Reciprocal interactions of mouse bone marrow-derived mesenchymal stem cells and BV2 microglia after lipopolysaccharide stimulation. Stem cell research & therapy. 2013;4(1):12.
28. Park HJ, Lee PH, Bang OY, Lee G, Ahn YH. Mesenchymal stem cells therapy exerts neuroprotection in a progressive animal model of Parkinson’s disease. Journal of neurochemistry. 2008;107(1):141-51.
29. Bachstetter AD, Van Eldik LJ, Schmitt FA, Neltner JH, Ighodaro ET, Webster SJ, et al. Disease-related microglia heterogeneity in the hippocampus of Alzheimer’s disease, dementia with Lewy bodies, and hippocampal sclerosis of aging. Acta neuropathologica communications. 2015;3(1):32.
30. Kreutzberg GW. Microglia: a sensor for pathological events in the CNS. Trends in neurosciences. 1996;19(8):312-8.
31. Shin TH, Da Yeon Lee H-SL, Park HJ, Jin MS, Paik M-J, Manavalan B, et al. Integration of metabolomics and transcriptomics in nanotoxicity studies. BMB reports. 2018;51(1):14.
32. Shin TH, Lee S, Choi KR, Kim Y, Paik MJ, Seo C, et al. Quality and freshness of human bone marrow-derived mesenchymal stem cells decrease over time after trypsinization and storage in phosphate-buffered saline. Scientific reports. 2017;7(1):1-8. 33. de Lucas B, Pérez LM, Gálvez BG. Importance and regulation of adult stem cell migration. Journal of cellular and molecular medicine. 2018;22(2):746-54.
34. Kalladka D, Muir KW. Brain repair: cell therapy in stroke. Stem cells and cloning: advances and applications. 2014;7:31.
35. Paik MJ, Li WY, Ahn YH, Lee PH, Choi S, Kim KR, et al. The free fatty acid metabolome in cerebral ischemia following human mesenchymal stem cell transplantation in rats. Clinica Chimica Acta. 2009;402(1-2):25-30.
36. Chamberlain G, Fox J, Ashton B, Middleton J. Concise review: mesenchymal stem cells: their phenotype, differentiation capacity, immunological features, and potential for homing. Stem cells. 2007;25(11):2739-49.