이학박사학위논문
제주연안에서 흔한가리비, Chlamys
nobilis (Reeve)의 종묘생산과 성장
제주대학교 대학원
해양생명과학과
원 승 환
2007년 8월
Studies on the Seed Production and
Growth of Noble Scallop, Chlamys
nobilis (Reeve) in Jeju Korea
Seung-Hwan Won
(Supervised by Professor Sum Rho)
A THESIS SUBMITTED IN PARTIAL
FULFILLMENT OF THE REQUIREMENTS FOR THE
DEGREE OF DOCTOR OF PHILOSOPHY
DEPARTMENT OF MARINE LIFE SCIENCE
GRADUATE SCHOOL
제주연안에서 흔한가리비, Chlamys
nobilis (Reeve)의 종묘생산과 성장
지도교수 노
섬
원
승
환
이 논문을 이학 박사학위 논문으로 제출함
2007년 8월
원승환의 이학 박사학위 논문을 인준함
심사위원장
이 영 돈
(인)위
원
이 정 의
(인)위
원
최 광 식
(인)위
원
강 정 하
(인)위
원
노
섬
(인)제주대학교 대학원
2007년 8월
목
차
List of figures ··· ⅳ List of tables ··· ⅶ Abstract ··· ⅷ Ⅰ. 서론 ··· 1 Ⅱ. 재료 및 방법 ··· 4 1. 시험생물 ··· 4 2. 생식주기 ··· 6 가. 생식소 외부 형태 ··· 6 나. 생식소 중량지수 ··· 6 다. 조직학적 관찰 및 난경 변화 ··· 6 라. 성비 ··· 7 3. 산란과 유생사육 ··· 8 가. 모패사육 ··· 8 나. 산란유발 및 산란 ··· 8 다. 수정 및 발생 ··· 10 라. 부유유생 사육 ··· 10 1) 먹이생물 배양 ··· 10 2) 부유유생 사육 ··· 12 3) 사육수온별 유생성장 ··· 12 4) 사육밀도별 유생성장 ··· 12 5) 먹이생물 종류별 유생성장 ··· 13 4. 부착률, 부착자패 및 치패성장 ··· 15가. 환경조사 ··· 16 나. 시험구 및 시험장소 ··· 16 다. 성장, 일간성장량 및 생존율 ··· 18 라. 수온과 염분 내성 ··· 18 6. 통계 처리 ··· 18 Ⅲ. 결과 ··· 19 1. 생식소 외부 형태 및 육안적 성비 ··· 19 가. 생식소 외부형태와 구조 ··· 19 나. 생식소 중량지수 월 변화 ··· 20 다. 생식주기 ··· 21 1) 분열증식기 ··· 21 2) 성장기 ··· 21 3) 성숙 및 산란기 ··· 21 4) 휴지 및 회복기 ··· 22 라. 난경의 월 변화 ··· 26 마. 자웅동체 ··· 28 바. 성비 ··· 29 2. 산란과 유생사육 ··· 31 가. 산란유발 방법별 산란반응 ··· 31 나. 수정 및 발생 ··· 33 다. 수온에 따른 부화율, D상변태율 및 생존율 ··· 36 라. 수온별 발생 속도 및 생물학적 영도 ··· 38 마. 난 발생 단계별 적산수온 ··· 41 바. 부유유생 사육 ··· 43 1) 수온별 유생성장 ··· 43 2) 사육밀도별 유생성장 ··· 46 3) 먹이생물별 유생성장 ··· 49 3. 부착자패와 초기치패 성장 ··· 53 가. 부착률 ··· 53
나. 자패 성장 ··· 54 다. 치패 성장 ··· 55 라. 각고와 각장 및 전중과의 관계 ··· 58 4. 중간양성 ··· 60 가. 양성지 환경 ··· 60 1) 수온 ··· 60 2) 염분 ··· 60 3) 용존산소 ··· 62 4) 영양염류 ··· 62 5) Chlorophyll-a ··· 62 나. 중간양성 ··· 65 1) 수심별 성장 ··· 65 2) 밀도별 성장 ··· 72 다. 수온과 염분 내성 ··· 77 1) 고수온 내성 ··· 77 2) 저수온 내성 ··· 77 3) 염분 내성 ··· 80 Ⅳ. 고찰 ··· 84 Ⅴ. 요약 ··· 101 Ⅵ. 참고문헌 ··· 104
List of figures
Fig. 1. Schematic diagram of indoor rearing tank for broodstock and juvenile
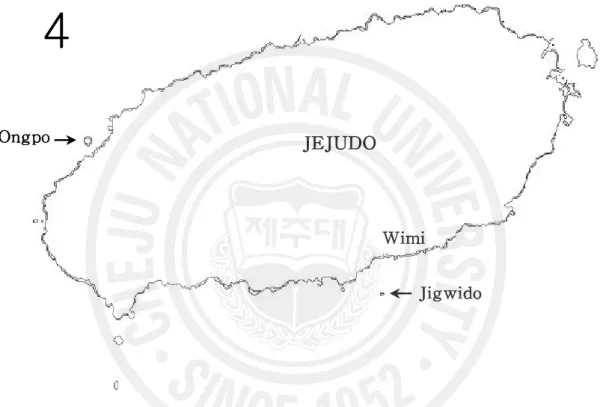
scallop. ··· 4 Fig. 2. Map showing off the coastal water hanging culture sites (arrows). ··· 5 Fig. 3. Kinds of induction trials with physical factors. ··· 9 Fig. 4. Schematic diagrams determining the suitable culture conditions for water temperature (A: 20, 24, 28℃), culture density (B: 1, 2, 4, 8 inds./mL), and live food (C: Chaetoceros calcitrans, I: Isochrysiis galbana, P:
Pavlova lutheri). ··· 14
Fig. 5. Schematic diagrams of the hanging culture facilities for outdoor intermediate culture. ··· 17 Fig. 6. Photo images of matured gonads of C. nobilis. A : male, B : female. ·· 19
Fig. 7. Monthly variation of gonadosomatic index (GSI) of C. nobilis. and
water temperature at Jigwido culture site. ··· 20 Fig. 8. Monthly changes of the frequency of sexual developmental stages. ··· 23
Fig. 9. Microphotographic images of ovarian sexual developmental stages for
histological observation. ··· 24 Fig. 10. Microphotographic images of testicular sexual developmental stages for histological observation. ··· 25 Fig. 11. Monthly variations of oocyte diameter in the tissue preparation of ovary from May 2001 to April 2002. ··· 27 Fig. 12. Histological photo images of the hermaphroditic gonads of C. nobilis. ··· 29 Fig. 13. Monthly variations of the sex ratios of C. nobilis by histological observation from May 2001 to July 2002. ··· 30 Fig. 14. Microscopic photo images of the early developmental stages. ··· 35 Fig. 15. Comparison of the rates of hatching, D-shape larva, and survival rate at various water temperature conditions. ··· 37
Fig. 16. Relationships between water temperature and time in hours to reach distinctive developmental stages after fertilization. ··· 40 Fig. 17. Relationships between integral water temperature and time to reach distinctive developmental stages. ··· 42 Fig. 18. Comparison of the growth in shell length of C. nobilis larvae reared in three water temperature regimes. ··· 44 Fig. 19. Comparison of survival rate of C. nobilis larvae reared in three water temperature regimes. ··· 45 Fig. 20. Comparison of the growth in shell length of C. nobilis larvae reared in four different larval densities under the condition of 22.0±0.5℃. ··· 47 Fig. 21. Comparison of survival rate of C. nobilis larvae reared in four different larval densities under the ondition of 22.0±0.5℃. ··· 48 Fig. 22. Comparison of the growth in shell length of C. nobilis larvae reared in various food organisms under the condition of 22.0±0.5℃. ··· 50 Fig. 23. Comparison of the survival rate of C. nobilis larvae reared in various food organisms under the condition of 22.0±0.5℃. ··· 51 Fig. 24. Comparison of the Daily shell length increment in juvenile scallop, C.
nobilis by three different culture conditions. ··· 52
Fig. 25. Growth curve of C. nobilis larvae at an temperature-controlled indoor tank of 22.0±0.5℃. ··· 54
Fig. 26. Monthly growth of C. nobilis spats reared at the hanging culture
method in Jigwi site. ··· 56 Fig. 27. Daily increment in shell length calculated by the monthly growth of C.
nobilis spats reared at the hanging culture method in Jigwi site. ··· 57
Fig. 28. Relationship between shell height and shell length of C. nobilis. ··· 58 Fig. 29. Relationship between shell height and total weight of C. nobilis. ··· 59
Fig. 32. Monthly changes of daily increment in shell length with different rearing depths off Jigwido (A) and Ongpori (B) coastal sea. ··· 67 Fig. 33. Monthly growths in total weight of C. nobilis cultured under different rearing depths off Jigwido (A) and Ongpori (B) coastal sea. ··· 69 Fig. 34. Monthly changes of daily increment in total weight of C. nobilis cultured under different rearing depths off Jigwido (A) and Ongpori (B) coastal sea. ··· 70 Fig. 35. Monthly growths in shell length of C. nobilis cultured with different rearing densities off Jigwido (A) and Ongpori (B) coastal sea. ··· 73 Fig. 36. Monthly growths in total weight of C. nobilis cultured with different rearing densities off Jigwido (A) and Ongpori (B) coastal sea. ··· 75 Fig. 37. Tolerance against the high water temperature of C. nobilis (mean shell length: 40.2 mm) cultured with ambient sea water of 23.5℃ mean water temperature. ··· 78 Fig. 38. Tolerance against the low water temperature of C. nobilis. (mean shell length: 60.4 mm) cultured with ambient seawater of 14.8℃ mean water temperature. ··· 79 Fig. 39. Tolerance against the low salinity of C. nobilis (mean shell length: 40.2 mm) under the condition of 15℃. ··· 81 Fig. 40. Tolerance against the low salinity of C. nobilis (mean shell length: 40.2 mm) under the condition of 20℃. ··· 82 Fig. 41. Tolerance against the low salinity of C. nobilis (mean shell length: 40.2 mm) under the condition of 25℃. ··· 83
List of tables
Table 1. Composition of Conway medium for mass culture of phytoplankton ··· 11 Table 2. Monthly variations of the sex ratios of C. nobilis form April to Sep-tember in 2002 ··· 26 Table 3. Comparison of the spawning response and fertilization rates by four inducing methods ··· 32 Table 4. Elapsed time and size to reach the distinctive early developmental stages under the condition of 25℃ ··· 34 Table 5. Time in hours to reach the distinctive embryonic developmental stages after fertilization at various water temperature conditions ··· 39 Table 6. Settling rate of C. nobilis larvae on the various collectors installed indoor rectangular tanks of one ton volume ··· 53
Table 7. Seasonal variation of DO, PO4-P, DIN and Chlorophyll-a at Jigwido and Ongpo costal sea ··· 64 Table 8. Comparison of growth and survival of C. nobilis cultured under different depths off Jigwido and Ongpori culture sites ··· 71 Table 9. Comparison of growth and survival of C. nobilis cultured with with different culture densities off Jigwido and Ongpori culture sites ··· 76
Abstract
Noble scallop, Chlamys nobilis, is distributed off the temperate and subtropical coasts including Jeju island, Korea. The scallop is famous for various shell colors in early life stage. Even the scallop has known inhabiting in Jeju coast, the population is very rare.
To investigate its possible aquaculture in Jeju coast, larval and adult C.
nobilis was imported from Oita Prefecture of Japan in 2001, and performed serial
experiments on inducing spawning, larval rearing, and outdoor cultivation in relation to different conditions.
1. Reproductive cycle
The matured scallop gonads were slender and convex like a waxing crescent phase of the moon in common, but differed in color: reddish for female and milky for male. Microscopic observation of the gonad tissue confirmed that most of the scallop were dioecious with 4 distinctive stages: multiplication stage, growing stage, mature and spent stage, recovery stage (resting stage), while some were hermaphrodite. Main spawning season were esteemed between May and July.
2. Spawning induction and larval culture
Four spawning stimulations were applied for spawning induction. Most effective method was exposure method with sunlight as 100% induction rate in 40 minutes, and followed by the U.V. irradiation method as 100% induction rate in 70 minutes. The working water temperatures for spawning were 15~30℃ (P<0.05). The time to the first D-shape larvae were strongly dependent on water temperature. They were 63.5, 31.5, 18.5 and 17.0 hours for 15, 20, 25 and 30℃ experiments, respectively. The biological minimum temperature for reproduction was 10.44℃ on average.
To find the suitable environmental conditions, D-shape larvae were tested for 12 days. The best water temperature for larval culture was 24℃ in which the larval
survival was 58.8% at the size of 192.7 ㎛. Better growth was achieved at larval culture densities less than 2 inds/mL (P<0.05). The growth and survival were 183.4 ㎛ and 36.7% for 1 ind/mL experiment and 175.6 ㎛ and 37.2%2 for inds/mL experiment, respectively. The scallop larvae fed on combined foods (Chaetoceros.
calcitrans, Isochrysis. galbana, and Pavlova lutheri) gained better growth over those
fed single food (Pavlova lutheri) (P<0.05). Larval size fed combined foods was 196.7 ㎛, while the larvae fed single food was 174.6 ㎛ at the end of the experiment.
3. Larval attachment and spat growth
The larval attachment rates were dependent on the substrates with the best result in horizontally-settled polyvinyl plate, followed by light shading screen, onion bag, and polyvinyl plate vertical. The spat growth after the attachment was expressed as the equation of SL = 0.1664e0.0579D(r2 = 0.924), where SL is shell length and D is day after the attachment. The spat grew to 4.1, 13.0, 23.1, 30.3, and 33.6 mm in 1, 2, 3, 4, and 5 months after installation in the nursery ground, respectively.
4. Nursery growth
4-1. Environmental parameters of the nursery ground
The water temperature of two nursery grounds were 13.6~25.9℃ for Jigwido and 12.8~26.7℃ for Ongpo with lowest in February and highest in August. The salinities of the surface water for both locations were 29.6~34.5 psu with lowest in February and highest in August. The variations in dissolved oxygen for surface and bottom water masses were 6.38~10.91 mL/L and 6.24~8.36 mL/L with the highest in February and lowest in November. The levels of chlorophyll a for Jigwido and Ongpo were 1.05~4.61 ㎍-at/L and 0.21~1.34 ㎍-at/L, respectively.
respectively. The daily gains of the shell length for each depth were 165.6, 154.0 140.0, and 137.4 ㎛/day (P<0.05).
2) Spat growth by density
The spats at Jigwido nursery ground gained shell lengths of 77.5±9.8, 71.0±13.0, 63.0±8.1, and 59.8±7.5 mm by densities of 10, 20, 40, 80 inds/cage for 390 days cultivation, respectively. The daily gains of the shell length for each density were 168.3, 145.8, 115.2, and 101.8 ㎛/day (P<0.05). The spats at Ongpo nursery ground gained 63.8±6.5, 62.1±7.0, 60.0±6.0 mm in shell lengths by the same culture densities for 196 days cultivation. These density-dependent spat growth was similar to those at Jigwido nursery ground.
The relative growth of the spats in the nursery ground were:
SL = 0.9982SH - 2.8326, and TW = 0.4 × 10⁻³SH2.8153, where, SL is shell length, SH is shell height, and TW is total weight.
4-3. Spat tolerance to water temperature and salinity
When the spats were exposed to high water temperatures of 28, 30, and 32℃ for 20 days, they had shown 13.3% mortality at 28℃ condition for the period. And the lethal temperature 50s were calculated as 96 hours at 30℃ and 36 hours at 32℃. While the spats were exposed to low water temperature of 7, 10, and 13℃, the lethal temperature 50s were shown 36 hours and 168 hours at 7 and 10℃, respectively. But no mortality was observed at 13℃ condition for 10 days.
When the spats were exposed to various salinities at 15℃ condition for two weeks, the mortality at 28 psu was shown as 30%. The lethal salinity 50s were 261, 222, 126, 45, and 42 hours at 26, 24, 22, 20, and 18 psu conditions. In salinity tolerance test at 20℃ condition, the lethal salinity 50s were 315, 189, 141, 33, and 12 hours at the condition of 26, 24, 22, 20, and 18 psu, respectively. But the spats exposed to 28 psu had shown only 6.7% mortality. In salinity tolerance test at 25℃ condition (highest in this salinity tolerance test), the lethal salinity 50s were 246, 156, 120, 30, and 5 hours at 26, 24, 22, 20, and 18 psu
conditions, respectively. But, the spats exposed to 28 psu at 25℃ had shown only 6.7% mortality for two weeks.
Ⅰ. 서
론
가리비류는 세계적으로 300여종이 서식하고 있고 대부분 한해성으로서 남북위 다같 이 34° 30′보다 고위도 지방에 분포하고 있다. 우리나라에 서식하는 가리비 종류로는 가리비과 Pectinidae에 해가리비 Amusium japonicum japonicum 1종과 큰집가리비과 Propeamussiidae에 비단가리비 Chlamys farreri nipponensis, 흔한가리비 Chlamys
nobilis, 큰가리비 Patinopecten yessoensis 등 24여종이 분포하고 있다(유, 1979; 노
등, 1997; 한국동물분류학회, 1997; Park, 1998; Park et al., 2005).
우리나라에 분포하는 가리비 중 산업적으로 중요한 양식대상 및 양식가능성이 있는 종으로 취급되는 품종은 흔한가리비, 국자가리비 Pecten albicans albicans, 해가리비, 큰가리비, 비단가리비 등 5종이 있다. 우리나라에 서식하는 양식대상 가리비 분포를 보 면 국자가리비는 남해안 및 제주연안, 큰가리비는 강원연안 중심으로 주로 동해안 지 역, 비단가리비는 남해안 중심으로 우리나라 전역, 흔한가리비 및 해가리비는 제주지역 을 중심으로 아열대 수역권에 분포하고 있다(Whang and Kim, 1973; 노 등, 1997; Park, 1998).
흔한가리비는 연체동물문 Mollusca, 이매패강 Bivalvia, 익각목 Pterioida, 큰집가리 비과 Propeamussiidae에 속한다. 이 종은 아열대성 품종으로 제주 남부와 일본 중부 이남에 주로 분포한다. 흔한가리비 서식 지역은 조간대 아래 수심 10~20 m 부근의 바 위지대에 부착하여 서식하며, 서식환경이 나쁠 경우 스스로 족사를 끊어 다른 곳으로 이동하는 습성이 있다. 이동 시는 패각을 위아래로 여닫으면서 물을 분사하여 유영한 다. 서식수온 범위는 13~28℃이며 적정수온은 20~23℃, 적정염분농도는 30~35 psu 내외이다. 방사늑은 20~22개로 크기가 고르고, 방사늑 위에 작은 비늘들이 나란히 배 열한다. 최대성장은 각장 133 mm, 각폭 40 mm이르고, 패각은 빨강, 주황, 노랑, 보라, 자주색 등 다양한 색깔을 나타낸다(Won and Han, 2004).
가리비류는 산업적으로 중요한 해산 이매패류로서, 그 패주는 세계적으로 애식되는 고가의 기호식품이다. 가리비류에 관한 연구는 굴 및 담치와 필적할 정도로 역사가 깊 고, 자연 및 인공산 재료를 통하여 자원, 생리생태 등에 관한 연구가 활발하게 이루어 지고 있다.
가리비 생식주기에 관한 연구로서 비단가리비(Liao et al., 1983; Yakovlev and Aafeichuk, 1995; 임 등, 1995; 노 등, 1997; Park et al., 2005), 해가리비(Ha, 1994; Son,
1997), 해만가리비, Argopecten irradians (Oh, 2000), 큰가리비(Chang et al., 1997; Uddin et ai., 2007) 등에 관한 연구가 있으며, 가리비류의 생식소 발달과 성 성숙에 관 한 연구(Turner and Hanks, 1960; Sastry, 1966, 1968; 丸, 1976; Chang and Lee, 1982; Simpson, 1982; Chang et al, 1997) 등이 있다. 성 특성은 육안적으로 자웅이체이나 일 부 개체에서 자웅동체 현상이 보고되고 있다(森 等, 1977;川眞, 1983; Komaru, 1988; Chang et al., 1997; Park, 1998)
가리비는 양식 산업적으로 매우 중요한 위치를 차지하고 있으나, 최근 연안오염, 적 조, 어장 상실 등으로 산란 가능한 어미와 치패 발생량의 감소로 생산량이 감소하고 있다. 이와 같은 문제점을 해결하고 안정적 양식을 하기위한 연구로서 인공 종묘생산 에 관한 기초연구가 수행되고 있다(Pyen and Rho, 1978; Yoo et al., 1981; Na et al., 1995; Son, 1997; Park, 1998). 가리비 종묘생산에 관한 연구로서 비단가리비, 흔한가리 비, 해만가리비, A. irradians 등을 대상으로 산란 유발과 유생 발생 및 성장에 관한 연 구가 있다(Na et al., 1995; Kuang et al., 1997; Kang and Zhang, 2000; Hur et al., 2001; Won and Han, 2004; Park et al., 2005). 그리고 가리비 유생 사육을 위한 먹이생물과 유생사육 수온과 밀도에 따른 영향에 관한 연구들이 수행되었다(Beaumont and Budd, 1982; Whyte et al., 1990; Na et al., 1995).
가리비 양식은 채묘와 중간육성, 양성 등의 단계로 이루어지며, 초기 치패는 외부 환 경 변화에 민감하게 영향을 받아 초기에 대량 폐사가 발생하기 때문에 생존율 향상과 성장 촉진을 위해서는 중간육성 단계가 반드시 필요하다(Yamamoto, 1964; Park et al., 2000). 가리비 중간육성에 관한 국내 연구로는 큰가리비를 대상으로 수하양식과 성장 에 관한 연구가 있다(이・장, 1977; Yoo et al., 1981; Park, 1998; Park et al., 2001). 그리 고 해만가리비를 대상으로 해역별 동절기 성장(Oh and Jung, 1999), 밀도별 성장(Oh et al., 2000), 양성수심에 따른 성장(Oh et al., 2002a, b) 등에 관한 연구가 있다. 국외에 서 가리비 양성에 관한 연구로는 해만가리비 밀도별 성장(Rhods and Wildman, 1980), giant scallop, Placopecten magellanicus의 밀도별 성장과 생존율 변화(Parsons and Dadswell, 1992; Penney, 1995; Penney and Mills, 2000), iceland scallop C. islandica
적인 방법 중 하나이다(Mori, 1994). 가리비 양식은 바다에서 사육환경조건이 매우 중 요하며, 수온, 용존산소, 염분 등의 변화는 활동 대사와 먹이 이용 및 폐사에도 영향을 미친다(Kinne, 1966; Newell and Kofoed, 1977; Rippingale and Hodgkin, 1977; Choi and Koh, 1990; Widdows and Wang, 1991). 먹이생물의 풍부도와 다양성 그리고 양성 과정 중 사육 밀도와 수심은 성장과 생존율 변화에 영향을 주며(Broom and Mason, 1978; Parsons and Dadswell, 1992; Park, 1998) 먹이 풍부도와 다양성은 지역에 따라 다른 것으로 보고되고 있다(Park et al., 2000).
제주도에서 기르는 어업은 80년대 초반까지는 마을어장을 중심으로 까막전복
Haliotis discus, 소라 Batillus cornutus, 오분자기, Haliotis diversicolor aquatilis
등에 대하여 자원관리적인 어로활동이 주를 이루었고, 80년대 후반부터는 넙치, 까 막전복을 중심으로 한 육상수조식 양식방법이 개발되면서 이 두 품종을 대상으로 발달하여 왔다. 제주도는 우리나라에서 가장 수온이 따뜻하고, 연중 평균 수온이 1 7~18℃가 유지되고 오염되지 않은 천연 지하해수 이용이 가능하기 때문에 해안가 를 중심으로 넙치, 까막전복 등 육상 수조식양식이 크게 발달하였다. 그러나 현재 제주도에서는 환경보전 등을 강화하는 정책으로 인해 육상수조식 양식방법은 신규 허가를 억제하고 있는 입장이다. 따라서 마을어장 및 연안을 입체적으로 활용할 수 있는 흔한가리비, 해가리비, 갈맛조개 Solecurtus divaricatus, 비단가리비 등 이매패 류 양식 가능성을 탐색하는 것은 중요한 의미를 가지고 있다. 이 연구는 제주연안 환경이 수온상승으로 점차 아열대 환경으로 변화할 가능성이 높아짐에 따라 제주연안에서 아열대성 흔한가리비의 양식가능성을 탐색하기 위해 흔한가리비 생식주기, 산란유발 및 산란량 조사, 수정 및 발생 소요시간, 사육 수 온․밀도, 먹이생물 종류별에 따른 유생사육, 치패 양성, 수온과 염분에 따른 생존 율 변화 등을 조사하였다.
Ⅱ. 재료 및 방법
1. 시험생물 이 연구에 이용한 흔한가리비는 2001년 4월에 성패 2,000마리(각고 89.2±2.3 mm), 치 패 4,500마리(각고 42.6±3.7 mm)를 일본 오이다현 가리비 양식장(Marudo co.)에서 구 입 후, 국립수산과학원 북제주수산종묘시험장 실내 생물사육실에서 먹이생물을 배양 공급하면서 순치 사육하였다(Fig. 1). 이후 제주시 한림읍 옹포 연안과 서귀포시 남원 읍 위미리 지귀도 연안에 정사각으로 구멍(20.5×20.5 mm)이 뚫린 사각플라스틱 컨테 이너(43.5×43.5×H8.5 cm)를 수하식으로 수용하여 사육 관리하였다(Fig. 2). A B D C E G FFig. 1. Schematic diagram of indoor rearing tank for broodstock and juvenile scallop. A: aerator, B: water inflow, C: sand filter, D: feed tank, E: rearing tank, F: broodstock, G: water outflow.
JEJUDO
Jigwido Ongpo
Wimi
4
2. 생식주기 가. 생식소 외부 형태 흔한가리비 생식소 외부 형태와 육안적 성비 조사는 2001년 10월부터 2002년 9월 까지 서귀포시 위미리 지귀도 연안에서 양성중인 성패(87.7±2.2 mm)를 대상으로 조 사하였다. 조사방법은 성장도 조사과정에서 외관상 생식소 구분이 가능한 개체를 대상으로 육안으로 암․수를 구분하였다. 나. 생식소 중량지수 흔한가리비 생식소 발달 양상을 조사하기 위해 이용된 시료는 2001년 5월부터 2002년 7월까지 서귀포시 위미리 지귀도 연안에서 양성중인 성패(87.7±2.2 mm)를 매월 10마리씩 채집하였다. 채집된 성패는 육중량(Muscle Weight: MW)과 생식소 중량(Gonad Weight: GW)을 전자저울(Sartorius E5500S)을 이용하여 0.01 g까지 측 정하였고, 생식소 중량지수(Gonadsomatic Index, GSI)는 아래의 식으로 구하였다.
GSI = GW / MW × 100
다. 조직학적 관찰 및 난경 변화
생식소 발달에 따른 조직학적 변화를 관찰하기 위해 성패로부터 생식소를 적출하 여 Bouin's solution에 24시간 고정하였다. 생식소 조직은 파라핀 절편법에 의하여 5~6 ㎛ 두께의 절편을 만든 후, Harris Heamatoxylin과 0.5% Eosin으로 비교 염색 후 광학현미경하에서 생식소의 발달상태 및 난경 변화를 관찰하였다.
생식소 발달단계는 Komaru and Wada (1988)의 방법을 이용하여 분열증식기, 성 장기, 성숙 및 산란기, 회복기로 구분하였다. 난경 변화 조사는 조직학적 관찰에서 알이 성장하고 판별이 가능한 시점에서 광학현미경을 이용하여 각 단계별로 30개체 를 측정하여 평균값으로 나타내었다.
라. 성비
생식소 외부 형태 조사 및 조직학적 관찰을 통해 성비조사를 하였다. 외부형태 관 찰에서 생식소 부분이 주황색을 나타내는 것을 암컷, 유백색을 나타내는 것을 수컷 으로 구분하였다. 색채가 불분명하거나 조직학적 관찰 과정 중 암․수 구분이 불분 명한 것은 성비 구분에서 제외 하였다.
3. 산란과 유생사육 가. 모패 사육 이 연구에 이용한 흔한가리비 모패는 서귀포시 남원읍 위미리 지귀도 인근에서 수하 양성 중인 것을 이용하였다. 모패 크기는 평균 각장 87.7±2.2 mm, 평균 각고 89.2±2.3 mm 및 평균 전중량 123.7±12.1 g이었으며, 채집 후 북제주수산종묘시험장 실내사육동 내 FRP 사각수조(1.5×2.0×0.4 m)에서 50마리/㎡ 밀도로 2001년 4월부터 7월까지 사육 하였다. 실내사육 시 사육수온은 수하양성지(자연수온 18℃ 내외)에서 실내사육수조로 옮긴 후 인위적으로 서서히 사육수온을 20.0±1.0℃ 내외로 상승시켜 사육하였다. 산란 기에 외부자극이나 스트레스로 인한 자연산란을 줄이기 위해 실내 사육공간을 10 lux 이하로 차광 하였다. 실내성숙을 위한 사육시 공급먹이는 식물 플랑크톤(Chaetoceros
calsitrans, Isochrysis galbana, Pavlova lutheri, 3종 혼합)을 실내에서 배양한 후
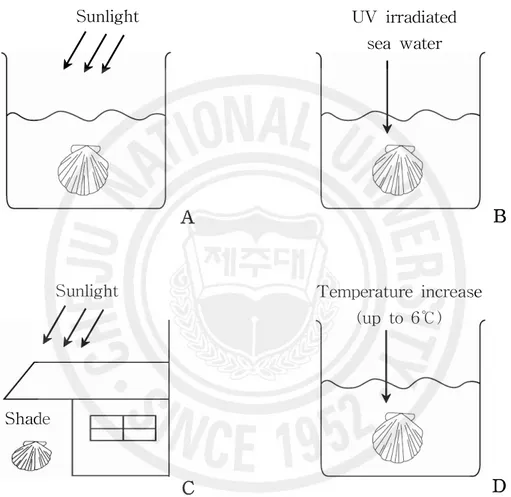
30,000~50,000 cell/mL/day 밀도로 먹이를 공급하였다. 나. 산란유발 및 산란 종묘생산 시 효율적인 산란유발방법을 조사하기 위하여 2001년 4월부터 7월까지 북 제주수산종묘시험장 실내사육동내에 사육한 모패를 대상으로 산란유발 반응시간과 산 란량을 조사하였다. 산란유발자극방법은 햇빛노출수온상승자극, 자외선조사해수자극, 음건자극, 가온자극 등 4가지의 자극방법을 이용하였다. 햇빛노출수온상승자극방법은 직사광선이 비추는 실외에서 2 L 용량의 비이커 10개 에 충분한 양의 해수를 채운 후 흔한가리비 모패를 각각 한 마리씩 수용하여 수분~1 시간여를 노출시켰다. 자외선 조사해수자극방법은 실내에서 같은 용량의 비이커에 3 UV mm/h 양의 자외선 조사해수를 넣어 산란유발을 시도하였다. 음건자극은 그늘에서 30분 정도 음건 후 산란용 해수에 모패를 수용하였다. 가온자극방법은 실내에서 30~ 40분간에 걸쳐 인위적으로 수온을 6.0±0.5℃ 내외로 상승시킨 후 모패의 산란반응 여부 를 조사하였다(Fig. 3).
에 수용하여 1 ㎛의 여과카트리지로 여과한 해수로 3~5회 세란 한 후 측정용기에 수 용하여 3회 무작위 샘플 후 계수한 값을 해수용적으로 환산하여 산란량을 산정하였다. 수정율은 수정 후 4 세포기까지 난할이 진행된 상태의 알을 해부현미경하에서 계수 산 정하였다.
Sunlight
Sunlight Temperature increase
(up to 6℃) UV irradiated sea water Shade
A
B
C
D
Fig. 3. Kinds of induction trials with physical factors. A: water temperature raise by sunlight, B: U.V. irradiation, C: exposure, D: water temperature raise by heater.
다. 수정 및 발생 수온에 따른 알의 발생 조사는 햇빛 노출방법에 의해 산란시킨 알을 인공수정 하여 사용하였다. 수정 시 알과 정자의 수는 1:10,000~100,000의 비율로 하였으며, 수정 5분 후에 세란 하여 각 수온별 시험구에 수용하였다. 수온에 따른 발생 소요시간의 차이를 조사하기 위하여 수정란을 각각 5, 10, 15, 20, 25 및 30℃의 수온으로 조절된 3 L 비이커에 50개/mL 밀도로 수용하여 각 발생단계에 이르기까지 소요시간과 생존율을 30~60분 간격으로 광학현미경하에서 조사하였다. 수온별 초기 난 발생 과정을 조사하기 위한 단계는 수정란, 2세포기, 8세포기, 상 실기, 담륜자기, 초기 D형 유생으로 구분하였다. 발생단계별 소요시간은 50% 이상 이 각 발생단계에 이르는 시간으로 하였고, 담륜자와 D상 유생은 섬모로 유영하는 것을 생존한 것으로 간주하여 조사하였다. 부화율(부화된 난의 수/수정된 난의 수×100), D상 변태율 및 D상까지의 생존율은 각 수온별 시험구에서 발생과정 관찰 후 D상으로 완전히 변태 후 조사하였다. 수온과 발생관계별 소요시간과의 관계식, 각 발생단계까지의 소요시간 및 적산수온 과의 관계식은 Yoo and Kang (1996) 방법으로 구하였다.
라. 부유유생 사육 1) 먹이생물 배양
유생사육 시험을 위한 먹이생물은 이매패류 종묘생산시 먹이 생물로 많이 이용되고 있는 규조류인 C. calcitrans 그리고 황갈편모조류인 I. galbana와 P.lutheri 3종을 먹이 로 이용하였다. 먹이생물 배양을 위해 이용되는 모든 배양수는 1 ㎛의 여과해수를 자외선 조사기로 살균하여 이용하였다. 원종보관을 위한 정치배양은 자외선조사 살균 여과해수를 고압 멸균기에 넣어 121℃, 1.2기압에서 20분간 멸균 후 이용하였다. 500 L의 대량배양에는 여과한 해수를 70~80℃로 가열한 후 열교환기를 이용하여 실온으로 냉각시킨 후 사용 하는 열탕살균법을 이용하였다.
Table 1. Composition of Conway medium* for mass culture of phytoplankton
Solution Constituent Formula weight
Solution A FeCl3․6H2O 1.30 g MnCl2․4H2O 0.36 g H3BO3 33.60 g EDTA 45.00 g NaH2PO4 20.00 g NaNO3 100.00 g Solution B 1.00 mL Distilled water 1.00 L Solution B ZnCl2 2.10 g CoCl2․6H2O 2.10 g (NH4)6Mo7O24․4H2O 2.10 g CuSO4․5H2O 2.00 g Distilled water 100.00 mL Solution C B12 10.00 mg B1(thiamine) 200.00 mg Distilled water 100.00 mL *
2) 부유유생 사육
부유유생 사육은 수정란을 원통형 플라스틱 용기(20 L)에 20만~30만개 정도로 수용 하여 수온이 22.0±0.5℃로 유지되는 FRP 2톤 사각수조의 수면에 띄워 놓고, 6시간에 1회 간격으로 물을 교환해주면서 용기 내의 수정란이 부화할 때까지 정치하였다.
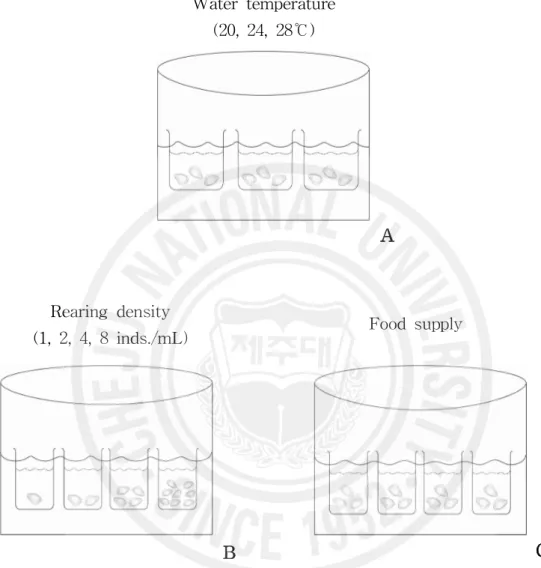
부화된 trochophore 유생은 전자식 온도자동조절기(micom SKC-302, Sae Kyung Electronic)를 이용하여 수온 22.0±0.5℃로 유지된 FRP 2톤 사각수조에 수용하였다. D 상 유생으로 변태한 2일째부터 약하게 통기하면서 배양한 먹이생물을 초기에는 10,000 cells/mL에서 성장함에 따라 50,000 cells/mL까지 단계적으로 늘려 하루에 2차례 공급 하였다. 유생 사육수는 모래여과조를 1차적으로 통과시킨 여과해수를 2차적으로 5 ㎛ 의 cartridge filter로 여과한 후 다시 1 ㎛로 정밀 여과한 여과해수를 이용하여 2일에 한번씩 전량 환수하였다. 3) 사육수온별 유생성장 흔한가리비 유생의 적정 사육 수온을 조사하기 위하여 20 L 사각 플라스틱 투명용기 에 수온을 20, 24 및 28℃의 3개 수온 시험구를 설정하였다. 사육해수로는 1 ㎛ 여과해 수를 채운 후 변태 직후의 D상 유생을 1개체/mL 밀도로 수용하였고, 자동온도조절기 를 이용하여 워터배스방식으로 시험하였다(Fig. 4). 사육방법은 지수식으로 하였고 2일 에 한번씩 사육수를 전량 교환하였으며, 먹이는 C. calcitrans, I. galbana 및 P. lutheri 를 혼합시켜 D상 유생 사육초기에는 10,000 cells/mL로 공급하기 시작하고 3~4일 간 격으로 10,000 cells/mL씩 공급량을 늘려 유생부착기 시점에는 50,000 cells/mL까지 먹 이공급량을 단계적으로 공급하였다.
시험기간 동안 3일 간격으로 시험구별로 성장 및 생존율을 조사하였다. 성장 조사는 현미경(Olympus, MVX10, Japan) 하에서 micrometer로 각장과 각고의 성장을 측정하 였고, 생존율 조사는 유생의 패각 형태, 섬모의 움직임, 먹이 섭취에 의한 유생의 위내 부의 색깔의 유무 등으로 생존 여부를 판단하여 생존율을 구하였다.
유생성장 시험에서와 같은 방법으로 하였다.
5) 먹이생물 종류별 유생성장
흔한가리비 유생의 적정 먹이생물을 파악하기 위하여 수온 22.0±0.5℃로 조절한 5 L 원통형 수조에 유생을 1마리/mL씩 수용하여 먹이 종류별 사육시험을 실시하였 다. 먹이생물 종류는 C. calcitrans, I. galbana 및 P. lutheri를 각각 단독 급이한 시 험구와 3종을 혼합한 4개의 시험구로 하였다. 먹이 종류별 유생사육 시험을 위한 사육수의 교환, 성장량 측정 및 생존율의 조사는 사육수온별 유생성장 시험에서와 같은 방법으로 하였다.
Rearing density
(1, 2, 4, 8 inds./mL) Food supply
Water temperature (20, 24, 28℃)
A
B
C
Fig. 4. Schematic diagrams determining the suitable culture conditions for water temperature (A: 20, 24, 28℃), culture density (B: 1, 2, 4, 8 inds./mL), and live food (C: Chaetoceros calcitrans, Isochrysis galbana, Pavlova lutheri).
4. 부착률, 부착자패 및 치패성장 가. 부착률 및 부착자패 성장 초기 부착자패의 부착기질별 부착률을 조사하기 위하여 2톤 FRP 사각수조에 채묘기 형태와 재질별에 따른 4가지 형태 채묘기를 부착기질로 이용하였다. 부착기질 투여 시 기는 각정기 유생 단계에서 안점이 생겼을 때 투입하였다. 부착기질 종류는 까막전복, Haliotis discus 채묘용 염화비닐판(30×40 cm), 망목 1 mm의 양파망(30×45 cm)에 합 성섬유 그물을 넣은 채묘기, 그리고 차광막(검은색, 차광율 50%, 20×50 cm)을 이용하 였다. 설치방법은 염화비닐판은 파판홀더에 수평과 수직의 방법으로 설치하고 양파망 과 차광막은 FRP수조에 걸이막대를 설치하여 수직으로 설치하였다. 부착 자패 성장은 부화 후 60일간 실내에서 인공으로 배양된 먹이를 공급 사육하여 성장률을 식으로 나타내었다. 나. 초기 치패성장 초기 치패의 성장시험은 서귀포시 남원읍 위미리 지귀도 연안에서 2001년 7월부터 12월까지 수하식 방법을 이용하여 양성줄에 매달아 시험하였다. 사육방법은 실내사육 으로 부착기질에 부착한 치패가 약 1 mm 되는 시점에 수하식 시설로 옮겨 부착기질을 300 ㎛ 그물주머니에 넣어 수심 5 m 지점에 매달아 처음 한달은 일주일, 2개월째에는 보름, 3개월 이후는 한달간격으로 청소하였고, 성장함에 따라 그물주머니의 망목크기 를 점차 큰 것으로 교체하였다. 성장도의 측정은 매월 조사하였다.
5. 중간 양성 가. 환경조사 수온과 염분 농도 변화 조사는 2001년 2월부터 2002년 12월까지 치패 사육시험 기간 동안 옹포리에 위치한 제주시 수산종묘시험장과 위미리에 있는 서귀포시 수산종묘시 험장에서 매일 10시에 측정된 정지해양관측자료를 이용하여 조사하였다. 양성장의 먹이량과 관계있는 영양염류, Chlorophyll-a량 및 용존산소량은 2001년 2 월부터 2002년 12월까지 분기별로 1회씩 8회에 걸쳐 치패사육 시험지 현장에서 직접 채수한 시료를 분석하였다. 용존산소의 분석은 Winkler법의 개량법인 Nakai 변법으로 분석하여 mL/L로 표시하였고, 영양염류 중 인산인은 Strickland and Parsons (1972) 방법으로 분석하여 ㎍-at/L로 표시하였다.
용존성무기질소(DIN)는 NO2-N, NO3-N, NH4-N의 합으로 나타냈으며, 그중 NH4-N
은 indophenol법, NO2-N는 sulfanilamide-NED법, NO3-N는 Cu-Cd 환원법으로 각각
분석하여 DIN 총량으로 표시하였다.
Chlorophyll-a는 pore size 0.45 ㎛ membrane filter (직경 47 mm) 여과지를 이용하여 현 장에서 500 mL의 해수를 여과하고 90% 아세톤으로 추출하여 3,000 rpm에서 10분간 원심 분리 한 후 상등액을 UV-spectrophotometer로 비색정량하여 ㎍/L로 표시하였다(Jeffery and Humphery, 1975). 나. 시험구 및 시험장소 제주시 한림읍 옹포리 연안 및 서귀포시 남원읍 위미리 지귀도 인근에서 사육수심과 사육밀도에 따른 시험을 실시하였다. 시험에 사용한 수하식 양식의 시설구조는 Fig. 5 와 같다. 사육수심은 5, 10, 15 및 20 m의 수심에 채롱 당 20마리씩 수용하였고 사육밀도는 10, 20, 40 및 80마리/cage 밀도로 수용하였다. 시험 종료시까지 매월 1회 각장, 각고를 vernier caliper로 0.01 cm까지 측정하였고, 생존율은 성장도 조사 시 폐사 개체를 직접
200m 12m 17m 20m 3m 2m 7m C A B Surface 100m Anchor Bottom
Fig. 5. Schematic diagram of the hanging culture facilities for outdoor intermediate culture. A: rearing cage of attached juvenile, B: rearing cage of young shell, C: intermediate culture.
다. 성장, 일간성장량 및 생존율
흔한가리비의 시간변화에 따른 성장도 조사는 매월 1회 측정하였고, 월별 일간각장 성장량(Daily growth increment)을 구하였다.
사육수심 및 사육밀도별 생존율은 매월 성장도 조사 시 폐사된 개체수를 파악하여 백분율로 표시하였다. 라. 수온과 염분 내성 치패의 수온 및 염분에 대한 내성시험은 각장 39.9±3.2 mm의 치패를 대상으로 시험 을 실시하였다. 수온내성 및 염분내성 시험 모두의 시험 장치로는 2.0×1.0×0.4 m의 FRP수조에 워터배스 방식으로 25.0×35.0×27.0 cm의 사각플라스틱 통을 수표면에 고정 하여 이용하였고, 그 안에 치패 10마리씩 수용하여 3반복으로 시험하였다. 수온내성 시험을 위한 고수온 수온조절은 여름철에 자연해수에 자동온도조절기 (micom SKC-302H, Sae Kyung Elec.)를 이용하여 수온 28.0~32.0℃까지 1.0℃간격 으로 설정한 후, 각각 시험용기에 치패를 수용하여 시험치패가 반수폐사에 이르는 시간까지 조사하였다. 저수온 수온조절은 겨울에 냉각기(DHI-300)를 이용하여 시험 수온 7.0, 10.0, 13.0℃로 설정하여 유수상태로 시험치패가 반수폐사에 이르는 시간 을 조사하였다. 염분내성 시험은 각각 수온조건 15.0, 20.0, 25.0℃에서 염분농도 18, 20, 22, 24, 26, 28 psu에 대한 반수폐사시간을 구하였다. 시험기간 동안의 염분량 조절은 자연 해수에 일반 담수로 희석하여 조절하였고 염분농도 측정은 염분측정기(YSI-30)를 이용하였다. 시험시 폐사 개체 판정은 시험개체에 물리적인 자극을 주어 반응하지 않는 것을 폐사체로 인정하였다. 6. 통계처리
모든 사육결과의 통계처리는 ANOVA test를 실시하여 최소 유의차 검정(Least significant difference)으로 평균간의 유의성(P〈0.05)을 검정하였다.
Ⅲ. 결
과
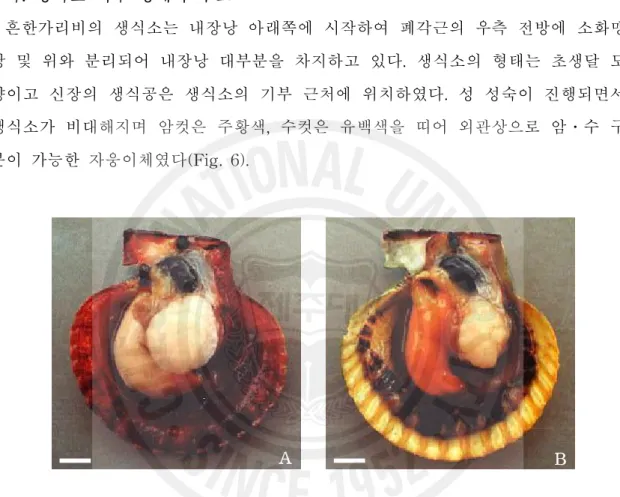
1. 생식소 외부 형태 및 육안적 성비 가. 생식소 외부 형태와 구조 흔한가리비의 생식소는 내장낭 아래쪽에 시작하여 폐각근의 우측 전방에 소화맹 낭 및 위와 분리되어 내장낭 대부분을 차지하고 있다. 생식소의 형태는 초생달 모 양이고 신장의 생식공은 생식소의 기부 근처에 위치하였다. 성 성숙이 진행되면서 생식소가 비대해지며 암컷은 주황색, 수컷은 유백색을 띠어 외관상으로 암․수 구 분이 가능한 자웅이체였다(Fig. 6). A BFig. 6. Photo images of matured gonads of Chlamys nobilis. A: Male, B: female. Scale bar = 10 mm.
0 3 6 9 12 15 18 21 24
May Jun. Jul. Aug. Sep. Oct. Nov. Dec. Jan. Feb. Mar. Apr.
Months G SI 0 5 10 15 20 25 30 W at er T em pe ra tu re (℃ ) Female Male W.T. 2001 2002 나. 생식소 중량지수 월 변화 흔한가리비 월별 생식소 중량지수는 3월에 암컷 9.4±2.1, 수컷 9.7±1.8에서 5월에 암컷 12.9±3.6, 수컷 13.8±3.0로 점차 증가하기 시작하여 6월에 암컷 17.1±4.2, 수컷 16.5±3.3로 최고값을 보였다. 이 후 7월부터 암컷 15.5±4.0, 수컷 14.2±2.8로 감소하 기 시작하여 10월까지 암컷 7.1±3.2, 수컷 7.3±2.5에 최저값을 보였다(Fig. 7). 수온 변화는 2001년 5월에 16.6℃였으며 이후 점차 증가하기 시작하여 8월에 26. 7℃로 최고값을 나타내었으며 이듬해 2002년 2월에 13.4℃로 최저값을 나타내었다 (Fig. 7).
Fig. 7. Monthly variations of gonadosomatic index (GSI) of Chlamys nobilis and water temperature at Jigwido culture site. Vertical bars denote standard deviations of means.
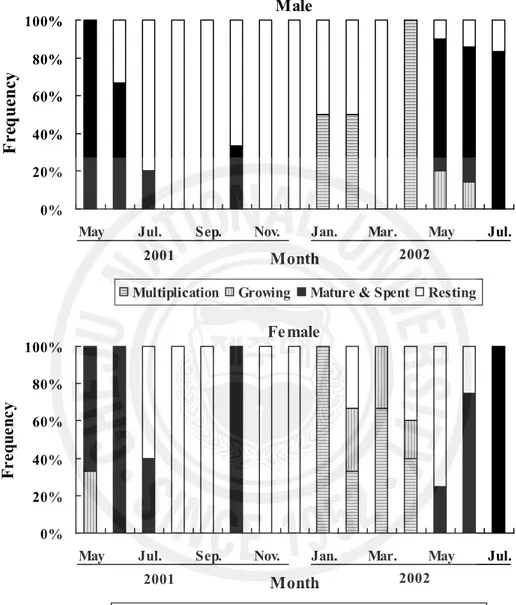
다. 생식주기 흔한가리비의 조직학적 관찰을 통한 생식소 발달 양상은 암․수 각각 분열증식기, 성장기, 성숙 및 산란기, 휴지 및 회복기의 4단계로 구분할 수 있었다(Fig. 8). 1) 분열증식기(multiplication stage) 암컷에서는 간충직 조직사이로 작은 난소소낭이 관찰되고, 소엽형태를 따라 난원 세포(oogonia)들이 분열증식과 더불어 초기 난모세포들이 난소 내강쪽에 분포하고 있었다(Fig. 9A). 수컷에서는 정소소낭 상피세포층의 생식상피들로부터 정원세포들 이 분열증식하고 일부 정모세포로 발달하는 분열증식기의 정소가 관찰되었다(Fig. 10A). 분열증식기 암컷은 1~3월 사이에 주로 관찰되었으며, 수컷은 1~4월 사이에 관찰되었다(Fig. 8). 2) 성장기(growing stage) 암컷은 난자형성 소낭의 벽에서 분열 증식하던 난원세포들이 세포질을 많이 축적 하면서 난모세포들은 점차 성장을 하고 내강으로 배열이 시작되었으나 소낭에는 아 직까지 빈 공간이 존재하였다. 이 시기의 난모세포의 크기는 20~40 ㎛ 전후였다 (Fig. 9B). 수컷은 정소 소낭 내에 정모세포군이 수적증가를 보이고, 정모세포 및 정세포가 소낭의 내강을 향하여 여러 층으로 배열되면서 성장하였다(Fig. 10B). 성장기 암컷은 2~5월 사이에 주로 관찰되었으며, 수컷은 5~6월 사이에 관찰되었 다(Fig. 8).
3) 성숙 및 산란기(mature and spent stage)
성숙 및 산란기의 난소에는 크게 2그룹의 난모세포로 구분할 수 있었으며, 성숙한 난모세포들 그리고 난황을 형성하기 시작하는 난모세포들이 관찰되었다. 완숙상태 의 난소조직으로 난소소낭 내에는 난경 50 ㎛이상의 완숙난들이 가득 차있다. 산란 후 암컷은 난소조직으로 소낭 내에 가득 차있던 성숙란들이 빠져나가서 빈 공간에 일부 잔존 난모세포도 관찰되었다(Fig. 9C). 수컷에서는 정소세관에도 변태를 마친 정자들로 가득 차고, 방정으로 인하여 소낭내 밀집되어 있던 정자들이 빠져나가 방 정 흔적을 보이는 방정기 정소상태를 보였다(Fig. 10C). 성숙 및 산란기 암컷은 3~7월에 주로 관찰되었으며 일부 10월에도 관찰되었다.
수컷은 3~7월 사이에 관찰되었으며, 일부 10월에도 관찰되었다(Fig. 8).
4) 휴지 및 회복기(resting and recovery stage)
암컷의 휴지기 난소는 소낭 내 생식세포들은 거의 다 흡수되어 소낭은 위축되고, 일부 미 방출된 난이 잔존하고 있었다(Fig. 9D). 수컷의 회복기 정소는 소낭도 극히 위축되고 소낭 내 생식세포는 거의 흡수되고 없으며 일부 잔존 정자들이 생식상피 를 따라 분포하고 있었다(Fig. 10D). 휴지 및 회복기 암컷은 주로 7~9월과 11월부터 이듬해 5월 사이에 주로 관찰되 었으며 수컷은 6월부터 이듬해 3월 사이에 주로 관찰되었다(Fig. 8).
0% 20% 40% 60% 80% 100%
May Jul. Sep. Nov. Jan. Mar. May Jul. Month F re qu en cy
Multiplication Growing Mature & Spent Recovery
2001 2002 Female 0% 20% 40% 60% 80% 100%
May Jul. Sep. Nov. Jan. Mar. May Jul. Month
F
re
q
u
en
cy
Multiplication Growing Mature & Spent Resting
2001 2002
Male
A B
C D
Fig. 9. Microphotographic images of ovarian sexual developmental stages for histological observation. A: multiplication stage, B: growing stage, C: mature and spawning stage, D: recovery stage.
A B
C D
Fig. 10. Microphotographic images of testicular sexual developmental stages for histological observation. A: multiplication stage, B: growing stage, C: mature and spawning stage, D: resting stage.
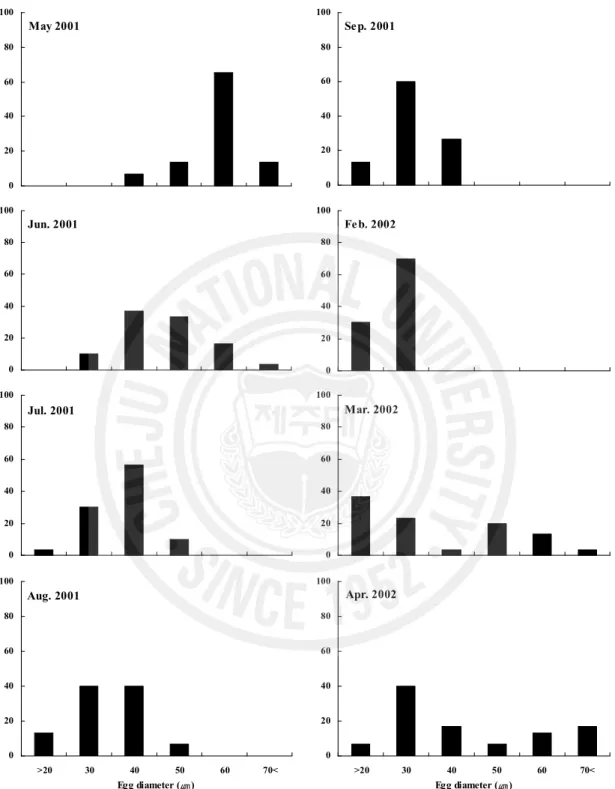
라. 난경의 월 변화 난경의 월 변화는 2001년 5월부터 이듬해 2002년 4월까지 조사하였다. 2001년 5~6월에는 대부분 40.0~70.0 ㎛ 범위 성숙난들로 이루어져 있었으며, 이시기가 주 산란기로 추정된다. 7월부터 9월까지 난경이 점차 감소하였고, 대부분 50.0 ㎛ 이하 어린난모세포들로 이루어져 있었다. 10월부터 이듬해 1월까지는 암수 구분이 불분 명한 개체가 대부분이어서 난경 측정이 불가능 하였다. 2002년 2월 암컷 난경은 대 부분 분열증식기 상태의 30.0 ㎛ 이하 어린 난모세포들이 분포하고 있었다. 3월 이 후부터 성장기 단계 난모세포들이 분포하기 시작하였고, 적은빈도이나 난경크기가 40.0 ㎛ 이상부터 70.0 ㎛ 크기까지 관찰되었다(Fig. 11).
0 20 40 60 80 100 >20 30 40 50 60 70< 0 20 40 60 80 100 >20 30 40 50 60 70< 0 20 40 60 80 100 >20 30 40 50 60 70< 0 20 40 60 80 100 >20 30 40 50 60 70< 0 20 40 60 80 100 >20 30 40 50 60 70< 0 20 40 60 80 100 >20 30 40 50 60 70< 0 20 40 60 80 100 >20 30 40 50 60 70< 0 20 40 60 80 100 >20 30 40 50 60 70< May 2001 Jun. 2001 Jul. 2001 Aug. 2001 Sep. 2001 Feb. 2002 Mar. 2002 Apr. 2002
Egg diameter (㎛) Egg diameter (㎛)
Fig. 11. Monthly variations of oocyte diameter in the tissue preparation of ovary from May 2001 to April 2002.
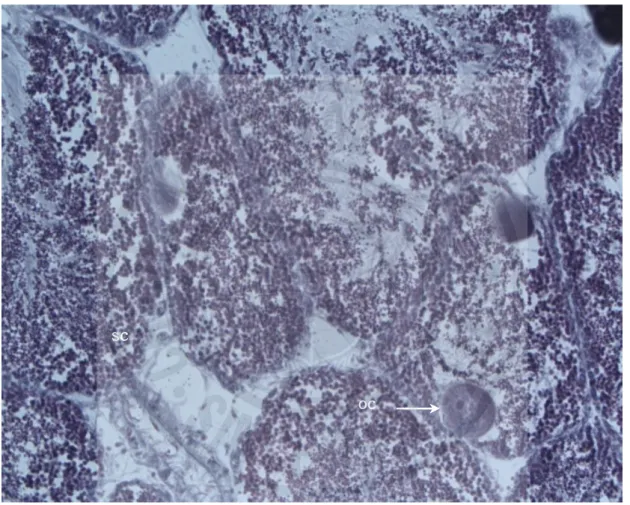
마. 자웅동체 흔한가리비 생식소 발달 과정을 조직학적 관찰조사 중 일부 자웅동체 개체가 나 타났다. 자웅동체 개체는 성숙 및 산란기의 정소조직 내에 난모세포들이 분포하는 양상을 나타내었다(Fig. 12). oc sc
Fig. 12. Histological photo images of the hermaphroditic gonads of Chlamys
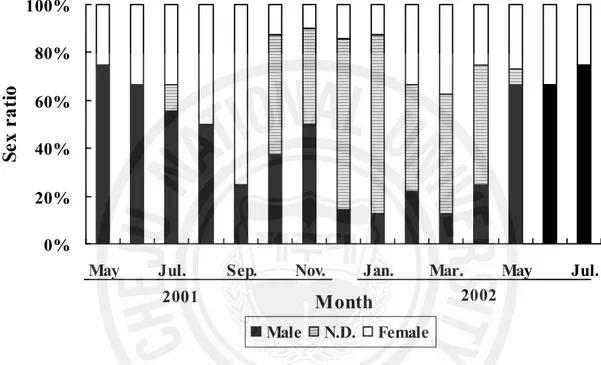
바. 성비 흔한가리비 생식소의 육안적 성비 조사결과 2001년 10월부터 2002년 3월까지는 암․수의 성구별이 불분명하였다. 암․수의 성구별이 가능한 2002년 4월부터 2002 년 9월까지 385마리 개체를 대상으로 암․수의 성비를 조사한 결과 6개월간의 암․ 수 전 개체의 성비는 Chi square, P = 0.16이었고, 4월부터 9월까지 암․수의 성비 가 1:1로 유의한 차를 나타내지 않았다(P〉0.05, Table 2). 조직학적 관찰을 통한 조사결과 월별 암․수 성비가 다소 차이가 있었으며, 2001 년 10월부터 2002년 5월까지 일부 개체에서 암․수 성 구분이 불가능한 개체들이 출연하였다(Fig. 13)
Table 2. Monthly variations of the sex ratios of Chlamys nobilis from April to September in 2002 Month Female (No.) Male (No.) Total (No.) Sex ratio (F/F+M) x2* (P-value) Apr. 31 33 64 0.48 0.16 May 30 31 61 0.49 0.15 June 32 35 67 0.48 0.17 July 32 35 67 0.48 0.17 Aug. 32 34 66 0.48 0.16 Sep. 30 30 68 0.50 0.15 Total/Mean 187 198 385 0.49 0.16 *
The critical value for goodness of fit test of equal numbers of females and males was α = 0.05.
0% 20% 40% 60% 80% 100%
May Jul. Sep. Nov. Jan. Mar. May Jul.
Month
Se
x
ra
ti
o
Male N.D. Female 2001 2002Fig. 13. Monthly variations of the sex ratios of Chlamys nobilis by histological observation from May 2001 to July 2002. N.D.: no distintion.
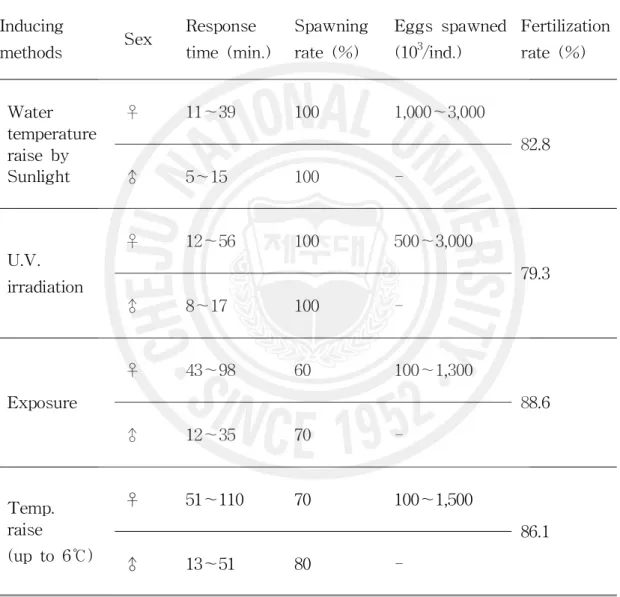
2. 산란과 유생사육 가. 산란유발 방법별 산란반응 산란유발 자극방법에 따른 산란반응 시간은 4가지 자극방법별 모두에서 수컷이 암컷보다 빠르게 반응하였고, 반응시간은 5~51분 범위였다. 암컷의 산란자극반응 시간은 햇빛노출수온상승자극 방법에서 시험개시 후 40분 이내에 암․수 모두 산란 반응을 보여 가장 빠른 결과를 나타냈고, 가온자극 방법에서는 산란자극 후 50여분 만에 처음 반응을 보여 4가지 시험구중 산란반응이 가장 늦었다(Table 3). 산란유발 자극방법에 따른 모패 반응률은 햇빛노출수온상승자극방법 및 자외선 조사해수자극방법에서 암․수 모두 100% 반응을 보였다. 음건자극에서는 암컷 60%, 수컷 70% 반응을 보였고, 가온자극에서는 암컷 70%, 수컷 80% 반응을 보여 다. 성별에 따른 산란유발 반응은 수컷이 암컷에 비해 빨랐다(Table 3). 산란량 조사에 있어서는 햇빛노출수온상승자극 방법에서 암컷 1마리당 산란량이 1,000~3,000×103, 자외선 조사해수자극 방법에서 500~3,000×103 범위로 많았고, 음 건자극방법은 100~1,300×103개로 가장 적은 산란량을 나타내었다(Table 3). 산란자극방법에 따른 수정률은 음건자극방법이 88.6±2.0%로 가장 높은 수정률을 나타내었고, 가온자극방법 86.1±2.4%, 햇빛노출수온상승자극방법 82.8±3.1% 순으로 나타났으나 최고와 최저 간의 차이는 10.0% 이내였다(Table. 3).
Table 3. Comparison of the spawning response and the fertilization rates by four inducing methods Inducing methods Sex Response time (min.) Spawning rate (%) Eggs spawned (103/ind.) Fertilization rate (%) Water temperature raise by Sunlight ♀ 11~39 100 1,000~3,000 82.8 ♂ 5~15 100 -U.V. irradiation ♀ 12~56 100 500~3,000 79.3 ♂ 8~17 100 -Exposure ♀ 43~98 60 100~1,300 88.6 ♂ 12~35 70 -Temp. raise (up to 6℃) ♀ 51~110 70 100~1,500 86.1 ♂ 13~51 80
-나. 수정 및 발생
흔한가리비 알은 구형의 분리 침성란으로 연한 황색을 나타내었고, 평균 난경은 71.0±0.4 ㎛이었다(Table 4, Fig. 14A).
수정 후 35분경에 제1극체가 출현하였으며(Table 4, Fig. 14B) 이어서 제2극체가 출현하였다(Fig. 14C). 수정 후 약 한 시간 30분이 지나면 2세포기(Fig. 14D)로 되 고, 2시간 후 4세포기(Fig. 14E), 수정 2시간 30분 후에 8세포기(Fig. 14F)가 되었다. 수정 후 7시간 후에 상실기(Fig. 14G)에 이르고 16시간 후에는 섬모환으로 회전운 동과 상하운동 등 비교적 자유로운 유영활동을 하는 담륜자 유생으로 부화되었다 (Fig. 14H).
수정 후 17시간 경과 후 유각을 형성하기 시작하였으며, 19.5시간 후에는 평균크 기가 93.0×75.0 ㎛의 D형 유생으로 되었다(Fig. 14I). 수정 후 8.5일 후에는 평균 크 기 180.0×146.0 ㎛인 각정기 유생(Umbo stage larvae)으로 성장하며(Fig. 14J) 각정 형성이 시작되었다. 수정 13일째에는 각정부가 돌출하면서 투명한 주연각이 형성되고 이때 크기는 평 균 210.0×190.0 ㎛가 되며(Fig. 14K), 기질에 부착하는 개체가 보이기 시작한다. 수 정 20일째에는 주연각이 더욱 성장하여 평균 각장 400 ㎛, 평균 각고 368 ㎛에 달 한다. 또한 31일째에는 각장 1 mm 크기 부착치패로서 족사가 형성된 것을 뚜렷이 관찰할 수 있다. 60일째에는 각장 5 mm 치패로 성장하였다.
Table 4. Elapsed time and size to reach the distinctive early developmental stages under the condition of 25℃
Developmental stage Elapsed time after
fertilization Size
Fertilized egg 0 71 ㎛
1st polar body emission 35 minutes
2nd polar body emission 55 minutes
2-cell 1 hour 30 minutes
4-cell 2 hours
8-cell 2 hours 30 minutes
Morula 7 hours
Trochophore 16 hours
D-shaped larva 19.5 hours 93×75 ㎛
Late D-shaped larva 50 hours 105×84 ㎛
Umbo larva 8.5 days 180×146 ㎛
Attached spat 13 days 210×190 ㎛
A B C
D E F
G H I
J K L
Fig. 14. Microscopic photo images of the early developmental stages. A: fertilized egg, B: 1st polor body emission, C: 2nd polor body emission, D: 2-cell stage, E: 4-cell
stage, F: 8-cell stage, G: morula stage, H:
trochophore stage, I: D-shaped larva, J: umbo stage larva, K: attached spat (13 days old), L: attached spat (20 days old). Black scale bar: 10 ㎛, white scale bar: 50㎛.
다. 수온에 따른 부화율, D상변태율 및 생존율 수정란의 수온에 따른 난 발생 시험에서 수온 5.0~30.0℃ 범위의 시험구 중 발생 가능수온은 15.0~30.0℃ 범위였으며, 수온 5.0, 10.0℃ 시험구에서는 전혀 난 발생이 일어나지 않았다. 수온별 부화율은 25℃ 시험구에서 78.7%로 가장 높았고, 20.0℃ 시험구에서는 74.2%였다. 수온 30.0℃ 시험구에서 부화율은 36.4였으며, 15℃ 시험구는 18.8%로 가장 낮았다(P>0.05, Fig. 15). 각 수온별로 처리한 수정란의 D상 변태율은 25.0℃ 시험구에서 73.6%로 가장 높 았고, 20.0℃에서 69.9%, 30.0℃에서 8.2%, 15.0℃에서 4.4% 순이었다(P>0.05, Fig. 15). 생존율 시험결과는 25.0℃ 시험구에서 74.7%로 가장 높았고, 20.0℃에서 71.8%, 30.0℃에서 11.3%, 15.0℃에서 8.8% 순이었다(P>0.05, Fig. 15).
0 20 40 60 80 100 5 10 15 20 25 30 Water temperature (℃) H at ch in g ra te ( % ) 0 20 40 60 80 100 5 10 15 20 25 30 Water temperature (℃) D -S ha pe d ra te ( % ) 0 20 40 60 80 100 5 10 15 20 25 30 Water temperature (℃) Su rv ia l r at e (% ) N.D. N.D. N.D. N.D. N.D. N.D. a a b c a a b b a a b b
Fig. 15. Comparion of the rates of hatching, D-shape larva, and survival rate at various water temperature conditions. Vertical bars denote standard deviations of means. Superscripts on the bars mean significantly different (P<0.05). N.D.: no development occurs.
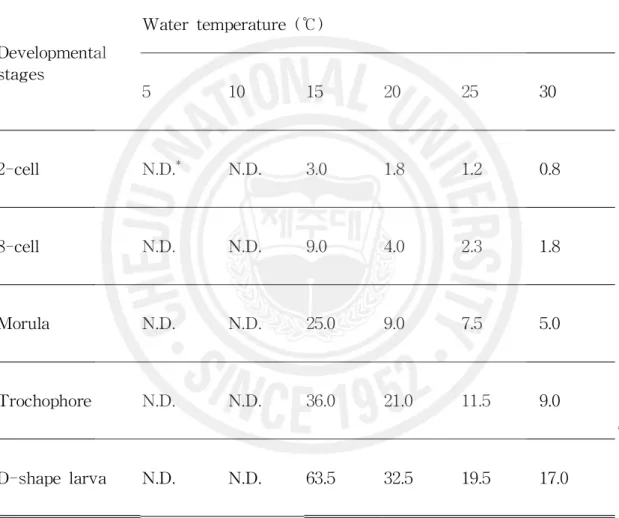
라. 수온별 발생속도 및 생물학적 영도 수정란의 각 수온별(15.0, 20.0, 25.0, 30.0℃) 발생속도는 수정 후 2 세포기까지 소 요시간은 수온별로 각각 3.0, 1.8, 1.2, 0.8시간으로 모두 3시간 이내에 이루어졌고, 상실기까지는 각각 25.0, 9.0, 7.5, 5.0시간이 소요되었다. D상 유생에 도달하는 시간 은 각각 63.5, 32.5, 19.5, 17.0시간이 소요되어, 수온 15.0℃ 시험구에서 상실기 이후 발생속도가 현저히 느려졌다(Table 5). 이상의 결과를 그림으로 나타내면, 수온별 발생속도는 직선적인 관계를 보였다 (Fig. 15). Fig. 16에서 X축은 수온, Y축은 시간의 역수를 나타내고, 여기에서 얻어 진 발생 단계별 소요시간(t: hour)과 수온(T:℃)과의 관계식은 다음과 같이 표시되 었다. 2세포기 : 1/t = 0.0606T - 0.6194 (r2 = 0.9791) 8세포기 : 1/t = 0.0304T - 0.3453 (r2 = 0.9941) 상실기 : 1/t = 0.0100T - 0.1049 (r2 = 0.9663) 담륜자기 : 1/t = 0.0058T - 0.0618 (r2= 0.9848) D상 유생 : 1/t = 0.0030T - 0.0282 (r2 = 0.9731) 위의 관계식을 근거로 Y축이 0일 때 X축에 접하는 수온, 즉 흔한가리비의 초기발 생에 있어서 난 발생이 정지하는 생물학적 영도(biological minimum temperature)는 평균 10.44℃ 였다(Fig. 16).
Table 5. Time in hours to reach the distinctive embryonic developmental stages after fertilization at various water temperature conditions
Developmental stages Water temperature (℃) 5 10 15 20 25 30 2-cell N.D.* N.D. 3.0 1.8 1.2 0.8 8-cell N.D. N.D. 9.0 4.0 2.3 1.8 Morula N.D. N.D. 25.0 9.0 7.5 5.0 Trochophore N.D. N.D. 36.0 21.0 11.5 9.0 D-shape larva N.D. N.D. 63.5 32.5 19.5 17.0 * N.D.: No development occurs.
1/t = 0.0606x - 0.6194 (r2 = 0.9791) 1/t = 0.0304x - 0.3453 (r2 = 0.9941) 1/t = 0.0066x - 0.042 (r2 = 0.8437) 1/t = 0.0027x - 0.0223 (r2 = 0.9279) 1/t = 0.0044x - 0.037 (r2 = 0.9082) 0.0 0.5 1.0 1.5 0 10 20 30 Water temperature (℃) 1/ t 2cell 8cell Morula Trochophore D-shap.
Fig. 16. Relationships between water temperature and time in hours to reach distinctive developmental stages after fertilization.
마. 난 발생 단계별 적산수온 난 발생 단계별 적산수온은 각 발생단계의 수온별 소요시간과 수온에 대한 회귀 직선식과 생물학적 기초수온을 이용하여 도출하였다. 좌측 Y축은 각 발생수온에서 생물학적 기초수온을 뺀 수온의 시간적인 적산치이고, X축은 시간을 나타내었고, 우측 Y축은 각 발생단계 변화를 번호로 표시하였다. 발생단계별에 따라 8세포기, 담륜자기 및 D형 유생까지의 적산수온의 평균은 각 각 37.0, 177.1, 304.2시간으로 나타났다(Fig. 17).
0 100 200 300 400 500 0 10 20 30 40 50 60 70 80 Hour In te gr al w at er t em pe ra tu re ∑ (t -1 0. 44 )℃ ·h ou r D ev el op m en ta l s ta ge Ⅰ Ⅱ Ⅲ Ⅳ Ⅴ
Fig. 17. Relationships between integral water temperature and time to reach distinctive developmental stages.Ⅰ: 2-cell (16 hrs), Ⅱ: 8-cell (37 hrs), Ⅲ: morula stage (102 hrs), Ⅳ: trochophore stage (177 hrs), Ⅴ:
15℃ 25℃ 30℃
바. 부유유생사육 1) 수온별 유생성장 20.0, 24.0, 28.0℃에서 3단계로 유생 사육시험을 실시하였을 때, 수온에 따른 유생 성장은 시험 후 3일째부터 성장차가 나타나기 시작하여 시험 6일째의 20.0℃ 시험 구는 각장 129.1±13.6 ㎛, 24.0℃ 시험구 160.0±12.6 ㎛, 28℃ 시험구 151.8±13.4 ㎛로 성장하여 24.0℃ 시험구가 20.0℃ 시험구에 비해 30.9 ㎛의 성장 차를 보였다. 12일 째에는 20.0℃ 시험구 163.4±19.6 ㎛, 24.0℃ 시험구 192.7±15.5 ㎛, 28.0℃ 시험구는 181.0±21.5 ㎛의 각장성장을 나타냈다(P<0.05, Fig. 18). 사육수온별 일간 각장 성장률은 수온 20.0℃ 시험구에서 4.6 ㎛, 24.0℃ 시험구 7.1 ㎛, 28.0℃ 시험구 6.1 ㎛로 수온 24.0℃ 시험구에서 가장 높은 성장을 보였다(P <0.05, Fig. 24A). 수온별 시험구에서 경과일수에 따른 생존율은 시험 3일째에는 20.0℃ 시험구가 97.8%, 24.0℃ 96.3%, 28℃ 84.8%로 비교적 높은 생존율을 보였으나 시험 9일째의 생존율은 20.0℃ 71.6%, 24.0℃ 74.5%, 28.0℃ 40.2%로 나타나 수온 28℃ 시험구에 서 대량폐사가 나타났다. 최종 생존율은 20.0℃ 54.2%, 24.0℃ 58.8%, 28.0℃ 21.1% 로 수온 20.0℃와 24.0℃에는 비교적 안정적인 생존율을 보였으나 시험구 28.0℃에 서 가장 낮은 생존율을 나타냈다(Fig. 19).
100 130 160 190 220 0 3 6 9 12 Rearing days Sh el l l en gt h (㎛ ) 20℃ 24℃ 28℃
Fig. 18. Comparison of the growth in shell length of Chlamys nobilis larvae reared in three water temperature regimes. Vertical bars denote standard deviations of means.
0 20 40 60 80 100 0 3 6 9 12 Rearing days Su rv iv al r at e (% ) 20℃ 24℃ 28℃
Fig. 19. Comparison of the survival rate of Chlamys nobilis larvae reared in three water temperature regimes. Vertical bars denote standard deviations of means.
2) 사육밀도별 유생성장 각 시험구의 각장 성장은 유생사육 6일후 1개체/mL 시험구 136.7±13.8 ㎛, 2개체 /mL 시험구 128.0±10.3 ㎛, 4개체/mL 시험구 123.3±13.4 ㎛, 8개체/mL 시험구 121.4±14.5 ㎛로 성장차이를 나타나기 시작하였고, 최종 각장성장은 단위 용적 당 1 개체/mL 시험구와 2개체/mL 시험구에서 각각 183.4±20.5 ㎛와 175.6±18.8 ㎛로 각 장 성장이 나타났으나 8개체/mL 시험구에서는 각장 성장 148.7±19.6 ㎛로 성장이 가장 저조하였다(P<0.05, Fig. 20). 일간 각장 성장률은 1개체/mL 시험구 6.3 ㎛, 2개체/mL 시험구 5.6 ㎛, 4개체/mL 시험구 4.5 ㎛, 8개체/mL 시험구에서 3.4 ㎛로 1개체/mL 시험구가 8개체/mL 시험 구에 비해 2배 가까운 일간각장성장량을 나타내었다(P<0.05, Fig. 24B). 사육밀도별 생존율은 시험 3일째 전시험구에서 90.5%~97.2%로 비슷한 생존율을 보였다. 시험 6일째에는 1개체/mL시험구와 2개체/mL 시험구에서 각각 82.8%, 87.0%였으며, 4개체/mL 시험구와 8개체/mL 시험구에서는 각각 65.2%와 59.0%이었 다. 최종 생존율은 시험구 1개체/mL 시험구, 2개체/mL 시험구, 4개체/mL 시험구에 서는 각각 36.7%, 37.2%, 30.4%의 생존율을 나타내었고, 8개체/mL 시험구에서는 10.0%로 가장 저조한 생존율을 나타냈다(P<0.05, Fig. 21).
100 120 140 160 180 200 0 3 6 9 12 Rearing days Sh el l l en gt h (㎛ ) 1 ind./ml 2 ind./ml 4 ind./ml 8 ind./ml
Fig. 20. Comparison of the growth in shell length of Chlamys nobilis larvae reared in four different larval densities under the condition of 22.0±0. 5℃. Vertical bars denote standard deviations of means.
0 20 40 60 80 100 0 3 6 9 12 Rearing days Su rv iv al r at e (% ) 1 ind./ml 2 ind./ml 4 ind./ml 8 ind./ml
Fig. 21. Comparison of the survival rate of Chlamys nobilis larvae reared in four different larval densities under the condition of 22.0±0.5℃. Vertical bars denote standard deviations of means.
3) 먹이생물별 유생성장
먹이생물 종류별로 단독 공급구와 3종을 혼합하여 4개 시험구를 설정하고 부유유 생을 사육한 성장 결과는 각 먹이 시험구별로 사육한 부유유생의 각장 성장은 3일 째는 C. calcitrans+I. galbana+P. lutheri 공급구가 128.3±5.6 ㎛로 가장 양호하였다. 그리고 C. calcitrans 공급구 123.0±9.0 ㎛, P. lutheri 공급구 119.0±6.1 ㎛, I. galbana 공급구 117.3±17.7 ㎛ 순으로 나타났다. 시험 9일째에는 C. calcitrans+I. galbana+P.
lutheri 공급구 173.6±18.7 ㎛, C. calcitrans 공급구 168.7±23.7 ㎛, I. galbana 공급구
160.3±14.0 ㎛, P. lutheri 공급구 158.7±20.1 ㎛ 순으로 나타났다. 최종 성장은 C.
calcitrans+I. galbana+P. lutheri 공급구가 196.7±22.9 ㎛로 가장 성장이 좋았고, P. lutheri 공급구가 174.6±21.2 ㎛로 가장 저조하였다(P<0.05, Fig. 22).
일간 각장 성장은 C. calcitrans+I. galbana+P. lutheri 공급구 7.4 ㎛, C.
calcitrans 공급구 6.5 ㎛, I. galbana 공급구 5.9 ㎛, P. lutheri 공급구 5.6 ㎛로 나
타났다(Fig. 24C).
먹이생물 종류별로 공급된 부유유생의 생존율은 사육경과 일수 3일째 C.
calcitrans+I. galbana+P. lutheri 공급구 91.8%, C. calcitrans 공급구 82.6%, I. galbana 공급구 88.9%, P. lutheri 공급구 81.7%로 전체 시험구에서 비교적 안정적
인 생존율을 나타내었다. 시험 종료 시인 12일째에서는 C. calcitrans+I. galbana+P.
lutheri 공급구 43.3%, C. calcitrans 공급구 45.6%, I. galbana 공급구 33.3%, P. lutheri 공급구 41.0%로 C. calcitrans 공급구가 가장 높은 생존율을 보인 반면 I. galbana 공급구가 가장 저조하였다(P<0.05, Fig. 23).
100 130 160 190 220 0 3 6 9 12 Rearing days Sh el l l en gt h (㎛ ) C+I+P Cha. Iso. Pav.
Fig. 22. Comparison of the growth in shell length of Chlamys nobilis larvae reared in various food organisms under the condition of 22.0±0.5℃. C:
Chaetoceros calcitrans, I: Isochrysis galbana, P: Pavlova lutheri.
0 20 40 60 80 100 0 3 6 9 12 Rearing days Su rv iv al r at e (% ) C+I+P Cha. Iso. Pav.
Fig. 23. Comparison of the survival rate of Chlamys nobilis larvae reared in
various food organisms under the condition of 22.0±0.5℃. C:
Chaetoceros calcitrans, I: Isochrysis galbana, P: Pavlova lutheri.
0 2 4 6 8 20℃ 24℃ 28℃ D ai ly in cr em en t (㎛ ) 0 2 4 6 8
1 ind./ml 2 ind./ml 4 ind./ml 8 ind./ml
D ai ly in cr em en t (㎛ ) 0 2 4 6 8 C+I+P C I P Experiment conditions D ai ly in cr em en t (㎛ ) A B C
3. 부착자패와 초기치패 성장 가. 부착률 부화 후 12일 후에 부착기질로 염화비닐판, 양파망 및 차광망을 이용하여 부착기 투입 후, 7일 후 부착 시험한 결과, 염화비닐판을 수평으로 놓은 것이 2.93%로 부착 률이 가장 높았으며, 다음으로는 차광망이 2.01%, 양파망이 1.86%였고 염화비닐판 을 수직으로 설치한 것이 1.48%로 가장 낮았다(Table 6).
Table 6. Settling rate of Chlamys nobilis larvae on the various collectors installed indoor rectangular tanks of one ton volume
Collectors Methods Floating larval stage Settling larval stage
No. larvae (A) No. collectors (B) No. larvae (C) Rate C/B (%) Rate (C/A) (%) Polyvinyl plate Horizontal 100,000 100 2,934 29.34 2.93 Vertical 100,000 100 1,483 14.83 1.48
Onion bag Vertical 100,000 28 1,868 66.71 1.86
Light shading screen (50%)