저작자표시 2.0 대한민국 이용자는 아래의 조건을 따르는 경우에 한하여 자유롭게 l 이 저작물을 복제, 배포, 전송, 전시, 공연 및 방송할 수 있습니다. l 이차적 저작물을 작성할 수 있습니다. l 이 저작물을 영리 목적으로 이용할 수 있습니다. 다음과 같은 조건을 따라야 합니다: l 귀하는, 이 저작물의 재이용이나 배포의 경우, 이 저작물에 적용된 이용허락조건 을 명확하게 나타내어야 합니다. l 저작권자로부터 별도의 허가를 받으면 이러한 조건들은 적용되지 않습니다. 저작권법에 따른 이용자의 권리는 위의 내용에 의하여 영향을 받지 않습니다. 이것은 이용허락규약(Legal Code)을 이해하기 쉽게 요약한 것입니다. Disclaimer 저작자표시. 귀하는 원저작자를 표시하여야 합니다.
Can we predict when to start renal replacement
therapy in chronic kidney disease patient by
using 6 months clinical data?
by
Joo-Han Park
Major in Medicine
Department of Medical Sciences
The Graduate School, Ajou University
Can we predict when to start renal replacement
therapy in chronic kidney disease patient by
using 6 months clinical data?
by
Joo-Han Park
A Dissertation Submitted to The Graduate School of
Ajou University in Partial Fulfillment of the Requirements
for the Degree of
Master of Medicine
Supervised by
Heungsoo Kim, M.D., Ph.D.
Major in Medicine
Department of Medical Sciences
The Graduate School, Ajou University
This certifies that the dissertation
of Joo-Han Park is approved.
SUPERVISORY COMMITTEE
Heungsoo Kim
Gyu-Tae Shin
Rae-Woong Park
The Graduate School, Ajou University
December, 13rd, 2013
i - ABSTRACT –
Can we predict when to start renal replacement therapy in
chronic kidney disease patient by using 6 months clinical data?
Background/ Aims: The purpose of this study was to develop a model of Chronic Kidney Disease (CKD) progression for predicting the probability and time to progression from various CKD stage to renal replacement therapy (RRT), using 6 months clinical data variables routinely measured in healthcare centers.
Methods: The data were derived from the electronic medical records (EMR) at Ajou University Hospital, Suwon, South Korea from October 1997 to September 2012. We included patients who were diagnosed with CKD (eGFR <60 mL·min–1·1.73 m–2 for ≥3 months) and followed up for at least 6 months. Study population was divided into a training set and a test set in random.
Results: There were 4,509 patients with reasonable diagnostic criteria. We divided patients into two groups at random, and after excluding the patients with missing values, the training and test set included 1,625 and 1,618 patients, respectively. The integral mean showed most powerful explanatory (R2 = 0.404) among the 8 modified values. Eleven variables (age, sex,
Diabetes mellitus (DM), Polycystic kidney disease (PKD), serum albumin, serum hemoglobin, serum calcium, serum phosphorus, serum potassium, eGFR (MDRD), and urine protein) were included final risk prediction model (R2 = 0.403). The calculated risk index(RI) was –0.011 ´
age – 0.468 ´ albumin - 0.069 ´ hemoglobin – 0.226 ´ calcium + 0.223 ´ phosphorus + 0.266 ´ potassium – 0.045 ´ eGFR (MDRD) + 4.203 – 0.405 (if female) + 0.402 (if DM) + 1.096 (if PKD) + 0.908 (if urine protein 1+) + 1.195 (if urine protein 2+) + 1.360 (if urine protein 3+) + 1.658 (if urine protein 4+). The Equation for the probability of not starting RRT at some point (t, years) is as follows. ( ) = ( ) ( )
Conclusions: we made prediction model with 11 variables by using integral means. From the result of brier score (BS) and area under the curve (AUC), we consider that our model have significant explanatory power to predict the probability and interval time to start RRT.
Keyword: Chronic kidney disease, renal replacement therapy, progression, equation
ii
TABLE OF CONTENTS
ABSTRACT ··· ⅰ TABLE OF CONTENS ··· ⅱ LIST OF FIGURES ··· ⅲ LIST OF TABLES ··· ⅳ . Ⅰ INTRODUCTION ··· 1 . Ⅱ METHODS ··· 2 A. Data source ··· 2 B. Study population ··· 2C. Observation period and study period ··· 3
D. Variables ··· 3 E. Statistical Analysis ··· 4 . Ⅲ RESULTS ··· 8 A. Patients selection ··· 8 B. Set description ··· 9
C. Prediction model outcome··· 9
D. Test set ··· 17
E. Example cases applying to the prediction model ··· 19
. Ⅳ DISCUSSION ··· 20
REFERENCES ··· 23
iii
LIST OF FIGURES
Fig.1. Flow diagram for patient selection ··· 3
Fig.2. Brier score according to the observation period (days) ··· 17
Fig.3. Area under the receiver operating characteristic curve according to the observation period (days) ··· 18
iv
LIST OF TABLES
Table 1. Baseline characteristics of the patients ··· 8
Table 2. Outcomes of model development using different modified values of variables 10
Table 3. Variable selection process by multivariate Cox proportional hazard regression model using backward elimination ··· 12
Table 4. Regression coefficients and hazard ratios for variables in the risk prediction model ··· 15
1
I.
INTRODUCTION
The incidences of CKD and end-stage renal disease (ESRD) have been increasing rapidly[1]. The overall prevalence of CKD was 13.7% in the South Korea[2] and most CKD patient worried about the start of dialysis or transplantation. However, accurate prediction of progression and the timing of RRT are still problematic because there is not a good and precise accepted predictive tool for CKD progression. Therefore, physicians have difficulty in deciding which patients will ultimately progress to kidney failure and when they need RRT.
In the present study, we aimed to develop a model of CKD progression for predicting the probability and time to progression from CKD to RRT, using 6 months clinical data variables, routinely measured in healthcare centers.
2
II.
METHODS
A. Data source
The data were derived from the EMR at Ajou University Hospital, Suwon, South Korea, from October 1997 to September 2012. This database contains information on patients and medical records, and includes data from all the hospital medical departments. We extracted the data without personal identification to ensure the confidentiality of patients. Our study was approved by institutional review board of Ajou University Hospital.
B. Study population 1. Study set
We included patients who were diagnosed with CKD and followed up for at least 6 months. The diagnostic criteria for CKD are eGFR < 60 mL·min–1·1.73 m–2 for ≥3 months[3]. The Modification of Diet in Renal Diseases (MDRD) study equation or the Chronic Kidney Disease Epidemiology Collaboration (CKD-EPI) equation were used to calculate eGFR; patients were included if they had eGFR of <60 mL·min–1·1.73 m–2 according to either
equation. We excluded patients who were <19 years old and those who had undergone RRT within 6 months of the study.
MDRD equation
186 ´ (serum creatinine)–1.154 ´ (age)–0.203 (´ 0.742 (if female))
CKD-EPI equation
141 × min(Scr/ , 1) × max(Scr/ , 1) . × 0.993 × 1.018 (if female) × 1.159 (if African)
( = 0.7 if female, = 0.9 if male, α = –0.329 if female, α = –0.411 if male, min = minimum Scr/ or 1, max = maximum Scr/ or 1)
3
2. Training set and test set
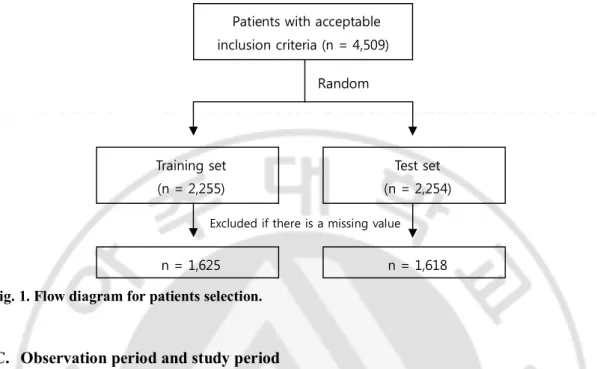
We divided the final study population into a training set and a test set in random order for the verification process (Fig. 1).
Fig. 1. Flow diagram for patients selection.
C. Observation period and study period
The observation period was defined as being from the initial day of observation to the day of starting RRT or the day of being censored. The initial day is the first day where the eGFR decreased to <60 mL·min–1·1.73 m–2. If we could not identify the renal replacement event, we
regarded the last follow-up date as the last observation day. The study period refers to the 180 days from the initial day of observation.
D. Variables 1. Training set
The variables were as follows: demographic variables, including age and sex; comorbid conditions, including diabetes mellitus (DM), hypertension (HTN), glomerular nephritis (GN), systemic lupus erythematosus (SLE), and polycystic kidney disease (PKD); laboratory variables, including blood urea nitrogen (BUN), hemoglobin, serum creatinine, serum calcium, serum phosphate, serum albumin, serum bicarbonate, urine creatinine, urine protein,
Patients with acceptable inclusion criteria (n = 4,509) Random Training set (n = 2,255) Test set (n = 2,254) n = 1,625 n = 1,618
4
urine blood, eGFR by the MRDR, and eGFR by the CKD-EPI. We excluded urine albumin, urine hemoglobin, and urine creatinine as variables because they were not measured in more than 50% of the patients.
Laboratory examination variables and comorbidities were collected for the study period. For missing values, we included data during 30 days before the initial day of observation and 30 days after completion of the study period. Urine protein was coded as 5 dummy variables on the basis of negative values (Trace, 1+, 2+, 3+, 4+). Criteria for the 5 comorbidities are described as follows.
1. DM: ICD-10 (E10–E14) code, serum HbA1c > 6.5%, or use of hypoglycemic medication
2. HTN: ICD-10 (I10–I15) code or use of antihypertensive medication 3. GN: ICD-10 (N01–N08) code
4. SLE: ICD-10 (M32) code 5. PKD: ICD-10 (Q61) code
2. Test set
RRT included hemodialysis, peritoneal dialysis, and renal transplantation. The initial RRT point was defined as the first day of hemodialysis, day of catheter insertion for peritoneal dialysis, or the day of surgery for renal transplantation.
E. Statistical analysis
1. Development of representative value
We developed eight “modified values” that were potentially associated with CKD for 6 months and chose the “representative value” that showed most efficiency in a multivariate Cox proportional hazards regression model. The modified values were: value at baseline, value at the end of the study period, the minimum value, the maximum value, the ratio of the minimum to maximum values, the slope of the minimum to maximum vales, the integral means, and the slope of initial to integral means (details as follows).
5
1. The value at baseline: the value obtained closes to the initial day of observation (± 30 days)
2. The value at the end of the study period: the value obtained closes to the end of the study period (± 30 days)
3. The minimum value: the minimum value during the study period 4. The maximum value: the minimum value during the study period
5. The ratio of the minimum to maximum values: the maximum value/minimum value 6. The slope of the minimum to maximum values
Maximum value − Minimum value Day (maximum value) − Day (minimum value) 7. The integral means
( + )( − )
2( − )
(n = number of values, i = order, a = day of value recording, b = value at that day)
8. The slope of initial to integral means
The integral means − The value at baseline
Day (maximum value) − Day (minimum value) + 90 days
Values were excluded if 50% of the cases had missing data. Urine protein (categorical variable) was only available at the baseline.
2. Model development
Multivariate Cox proportional hazard regression was used for model development. The probability that the patient does not undergo RRT at the time t (years) is as follows[4].
( ) = ( ) (∑ ∑ )
: Follow-up time : Regression coefficient
: Level of risk factor i of a patient
: Corresponding average value of population ( ): Underlying probability of surviving
6
“∑ − ∑ ” is defined as the risk index (RI): an increased value indicates a greater probability of RRT. We selected variables using clinical guidance and backward elimination (Wald) methods. The variables that did not contribute to the explanatory power of the RRT predictive model were removed until the remaining variables were significantly related to RRT (p < 0.05).
3. Evaluation of model performance
To evaluate the expected prediction error of the training model, we calculated the BS[5] and the AUC according to time. BS is the square of deviation of the real value and the expected value. The higher the BS, the higher is the expected error. If BS is >33%, the expected data show random levels, and if BS is close to 0%, the expected data show perfect prediction.
BS at the predicted point (t, year)
The AUC was also used to evaluate the prediction accuracy of the model. A greater value of the AUC indicated that the predicting power was higher. Time dependent AUC is a concept which the former concept of Receiver operating characteristic (ROC) was applied extensively to survival times in order to evaluate the accuracy of the biomarkers that classify the subjects based on the time until the event[6]. The closer the time-dependent AUC is to 1, the more accurate the Cox predictive model is considered to be. In the present study, time-dependent AUC was calculated by using the method of Song and Zhou (2008)[7]. If the AUC is >0.8, we consider that the curve has excellent prediction ability; if the AUC is >0.7, it is considered to have acceptable prediction ability.
( ) = { ( ) − ( | )}
7
Time-dependent AUC
4. Software
We collected electronic medical record data from Microsoft SQL Server 2012, and used PASW statistics (18.0.0) for selecting representative values. The multivariate Cox proportional hazards regression model, Brier score and time-dependent AUC were analyzed by R package (3.0.1).
8
III. RESULTS
A. Patient selection
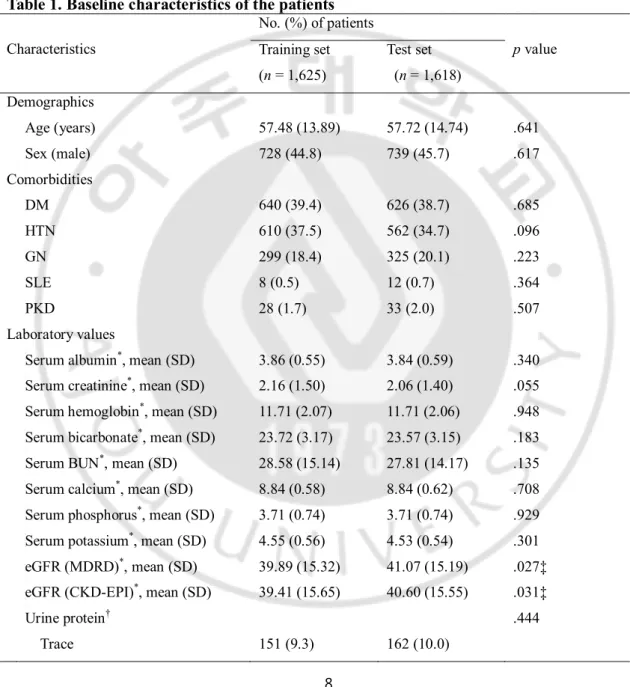
There were 4,509 patients with reasonable diagnostic criteria. We divided patients into 2 groups at random, and after excluding the patients with missing values, the training and test set included 1,625 and 1,618 patients, respectively (Table 1).
Table 1. Baseline characteristics of the patients
Characteristics No. (%) of patients p value Training set (n = 1,625) Test set (n = 1,618) Demographics Age (years) 57.48 (13.89) 57.72 (14.74) .641 Sex (male) 728 (44.8) 739 (45.7) .617 Comorbidities DM 640 (39.4) 626 (38.7) .685 HTN 610 (37.5) 562 (34.7) .096 GN 299 (18.4) 325 (20.1) .223 SLE 8 (0.5) 12 (0.7) .364 PKD 28 (1.7) 33 (2.0) .507 Laboratory values
Serum albumin*, mean (SD) 3.86 (0.55) 3.84 (0.59) .340 Serum creatinine*, mean (SD) 2.16 (1.50) 2.06 (1.40) .055 Serum hemoglobin*, mean (SD) 11.71 (2.07) 11.71 (2.06) .948 Serum bicarbonate*, mean (SD) 23.72 (3.17) 23.57 (3.15) .183 Serum BUN*, mean (SD) 28.58 (15.14) 27.81 (14.17) .135 Serum calcium*, mean (SD) 8.84 (0.58) 8.84 (0.62) .708 Serum phosphorus*, mean (SD) 3.71 (0.74) 3.71 (0.74) .929 Serum potassium*, mean (SD) 4.55 (0.56) 4.53 (0.54) .301 eGFR (MDRD)*, mean (SD) 39.89 (15.32) 41.07 (15.19) .027‡ eGFR (CKD-EPI)*, mean (SD) 39.41 (15.65) 40.60 (15.55) .031‡
Urine protein† .444
9 1 positive 243 (15.0) 236 (14.6) 2 positive 438 (27.0) 402 (24.8) 3 positive 336 (20.7) 317 (19.6) 4 positive 57 (3.5) 58 (3.6) Outcome
Observation time, days, mean (SD) 1,330 (1032) 1306 (1003) .500 Renal replacement therapy events 530 (32.6) 473 (29.2) .037‡
Note. χ2-test or independent t-test was used.
*Integral means, †initial value. M = mean; SD = standard deviation. ‡p < 0.05.
B. Set description
Patients in the training and test sets were similar with regard to demographics, comorbidities, laboratory values, and outcomes, with the exception of eGFR (MDRD), eGFR (CKD-EPI), and RRT events. eGFR (MDRD) and eGFR (CKD-EPI) were lower (39.89 vs. 41.07 and 39.41 vs. 40.60, p < 0.05) and RRT events were higher (530 vs. 473, p < 0.05) in the training set than in the test set.
C. Prediction model outcome 1. Representative values
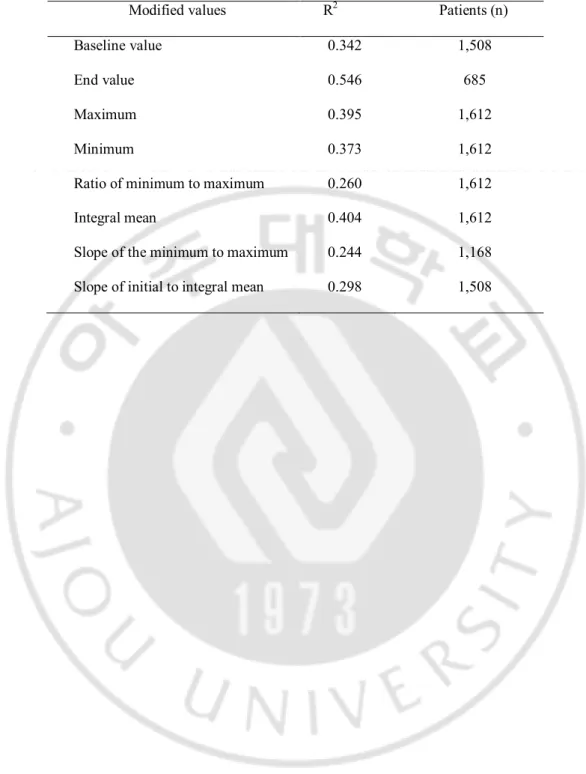
We developed a multivariate Cox proportional hazard regression model with 8 modified values. We included 2,225 patients in the training set, and considered all variables that we collected. Eight modified values were all significantly effective, but the integral mean exhibited the most powerful explanatory value (R2 = 0.404), except for the end value (R2 =
0.546) (Table 2). We excluded the end value model, because it included 685 patients (<50% of all patients). Thus, we used the integral mean as a representative value for each variable.
10
Table 2. Outcomes of model development using different modified values of variables
Modified values R2 Patients (n)
Baseline value 0.342 1,508
End value 0.546 685
Maximum 0.395 1,612
Minimum 0.373 1,612
Ratio of minimum to maximum 0.260 1,612
Integral mean 0.404 1,612
Slope of the minimum to maximum 0.244 1,168 Slope of initial to integral mean 0.298 1,508
11
2. Selection of prediction variables
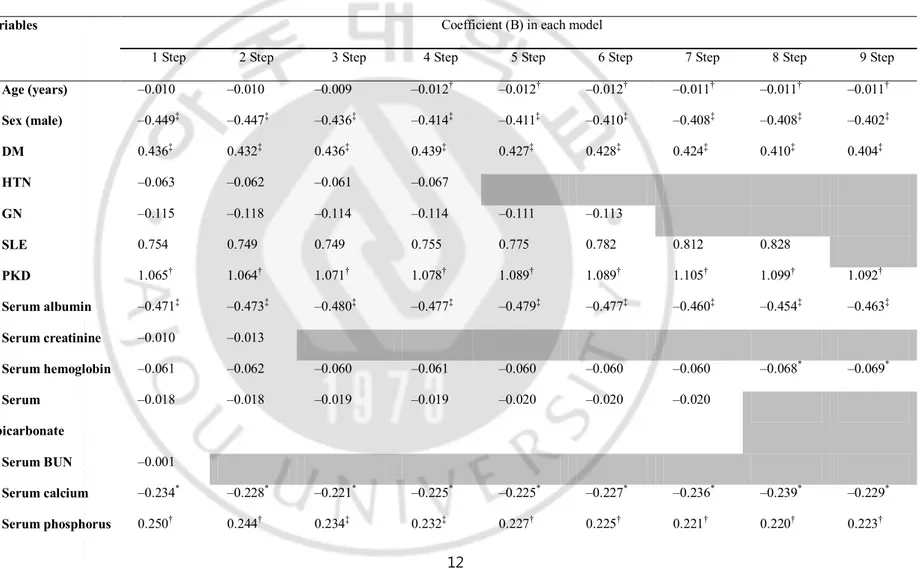
Table 3 shows the variable selection process through the multivariate Cox proportional hazard regression model using the backward elimination method. If we included all 22 variables, the model showed 40.4% explanatory power, and 11 variables were significantly associated with a RRT event (p < 0.05). BUN, serum creatinine, eGFR (CKD-EPI), HTN, urine protein (trace), GN, serum bicarbonate, and SLE were excluded from the model in that order. Eleven variables (age, sex, DM, PKD, serum albumin, serum hemoglobin, serum calcium, serum phosphorus, serum potassium, eGFR [MDRD], and urine protein) were included in the final risk prediction model (R2 = 0.403).
12
Table 3. Variable selection process by multivariate Cox proportional hazard regression model using backward elimination
Variables Coefficient (B) in each model
1 Step 2 Step 3 Step 4 Step 5 Step 6 Step 7 Step 8 Step 9 Step
Age (years) –0.010 –0.010 –0.009 –0.012† –0.012† –0.012† –0.011† –0.011† –0.011† Sex (male) –0.449‡ –0.447‡ –0.436‡ –0.414‡ –0.411‡ –0.410‡ –0.408‡ –0.408‡ –0.402‡ DM 0.436‡ 0.432‡ 0.436‡ 0.439‡ 0.427‡ 0.428‡ 0.424‡ 0.410‡ 0.404‡ HTN –0.063 –0.062 –0.061 –0.067 GN –0.115 –0.118 –0.114 –0.114 –0.111 –0.113 SLE 0.754 0.749 0.749 0.755 0.775 0.782 0.812 0.828 PKD 1.065† 1.064† 1.071† 1.078† 1.089† 1.089† 1.105† 1.099† 1.092† Serum albumin –0.471‡ –0.473‡ –0.480‡ –0.477‡ –0.479‡ –0.477‡ –0.460‡ –0.454‡ –0.463‡ Serum creatinine –0.010 –0.013 Serum hemoglobin –0.061 –0.062 –0.060 –0.061 –0.060 –0.060 –0.060 –0.068* –0.069* Serum bicarbonate –0.018 –0.018 –0.019 –0.019 –0.020 –0.020 –0.020 Serum BUN –0.001 Serum calcium –0.234* –0.228* –0.221* –0.225* –0.225* –0.227* –0.236* –0.239* –0.229* Serum phosphorus 0.250† 0.244† 0.234‡ 0.232‡ 0.227† 0.225† 0.221† 0.220† 0.223†
13 Serum potassium 0.230* 0.227* 0.227* 0.235* 0.239* 0.240* 0.245† 0.266† 0.264† eGFR (MDRD) –0.075 –0.074 –0.074 –0.043‡ –0.044‡ –0.044‡ –0.044‡ –0.045‡ –0.045‡ eGFR (CKD-EPI) 0.028 0.029 0.029 Urine protein, trace 0.240 0.244 0.248 0.253 0.246 Urine protein, 1+ 0.972‡ 0.974‡ 0.975‡ 0.976‡ 0.979‡ 0.892‡ 0.894‡ 0.895‡ 0.906‡ Urine protein, 2+ 1.278‡ 1.283‡ 1.284‡ 1.292‡ 1.290‡ 1.203‡ 1.198‡ 1.186‡ 1.191‡ Urine protein, 3+ 1.451‡ 1.457‡ 1.460‡ 1.471‡ 1.466‡ 1.380‡ 1.365‡ 1.357‡ 1.357‡ Urine protein, 4+ 1.782‡ 1.789‡ 1.789‡ 1.801‡ 1.788‡ 1.703‡ 1.664‡ 1.653‡ 1.651‡ R2 0.404 0.404 0.404 0.404 0.404 0.404 0.403 0.404 0.403 *p < 0.05, †p < 0.01, ‡p < 0.001.
14
3. Outcome of the model
The final model that included 11 selected variables had approximately 40% risk prediction power in the Cox proportional hazard regression model (Table 4). The risk is greater in patients who are female or old, and have DM or PKD. The greater the levels of serum albumin, serum hemoglobin, serum calcium, and eGFR (MDRD), the lower is the risk; the greater the levels of serum phosphorus, serum potassium, and urine protein, the higher is the risk.
15
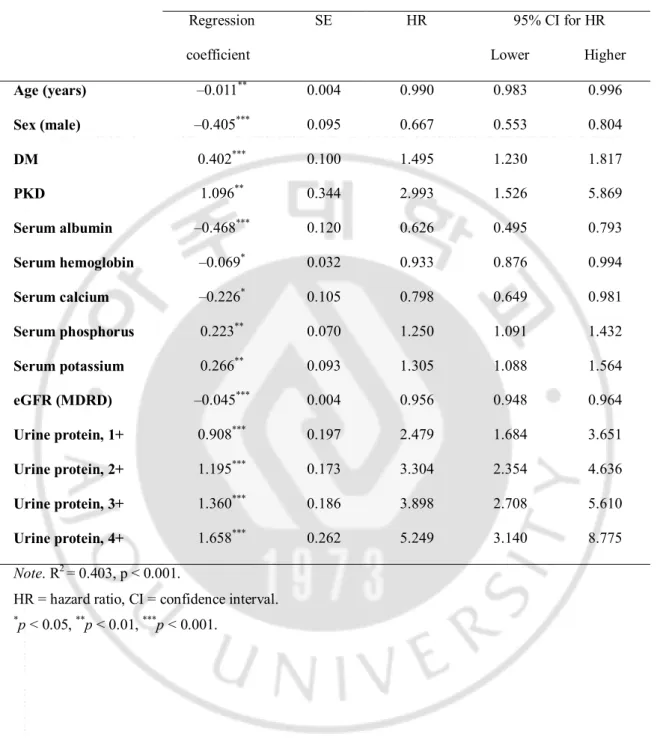
Table 4. Regression coefficients and hazard ratios for variables in the risk prediction model
Training set (n = 1,625) Regression coefficient SE HR 95% CI for HR Lower Higher Age (years) –0.011** 0.004 0.990 0.983 0.996 Sex (male) –0.405*** 0.095 0.667 0.553 0.804 DM 0.402*** 0.100 1.495 1.230 1.817 PKD 1.096** 0.344 2.993 1.526 5.869 Serum albumin –0.468*** 0.120 0.626 0.495 0.793 Serum hemoglobin –0.069* 0.032 0.933 0.876 0.994 Serum calcium –0.226* 0.105 0.798 0.649 0.981 Serum phosphorus 0.223** 0.070 1.250 1.091 1.432 Serum potassium 0.266** 0.093 1.305 1.088 1.564 eGFR (MDRD) –0.045*** 0.004 0.956 0.948 0.964 Urine protein, 1+ 0.908*** 0.197 2.479 1.684 3.651 Urine protein, 2+ 1.195*** 0.173 3.304 2.354 4.636 Urine protein, 3+ 1.360*** 0.186 3.898 2.708 5.610 Urine protein, 4+ 1.658*** 0.262 5.249 3.140 8.775 Note. R2 = 0.403, p < 0.001.
HR = hazard ratio, CI = confidence interval. *p < 0.05, **p < 0.01, ***p < 0.001.
16
4. Risk prediction model
The risk index (RI) of this study can be defined as follows.
By using RI, the formula of probability that some patient did not have RRT at some point (t, years) is as follows.
( ) = ( ) ( )
( (1) = 0.973, (3) = 0.876, (5) = 0.756, (7) = 0.756, (10) = 0.423)
( ): probability of not undergoing renal replacement therapy ( ): underlying probability
RI = –0.011 ´ age – 0.468 ´ albumin – 0.069 ´ hemoglobin – 0.226 ´ calcium + 0.223 ´ phosphorus + 0.266 ´ potassium – 0.045 ´ eGFR (MDRD) + 4.203 – 0.405 (if female) + 0.402 (if DM is present) + 1.096 (if PKD is present) + 0.908 (if urine protein = 1+) + 1.195 (if urine protein = 2+) + 1.360 (if urine protein = 3+) + 1.658 (if urine protein = 4+)
17
D. Test set 1. Brier score
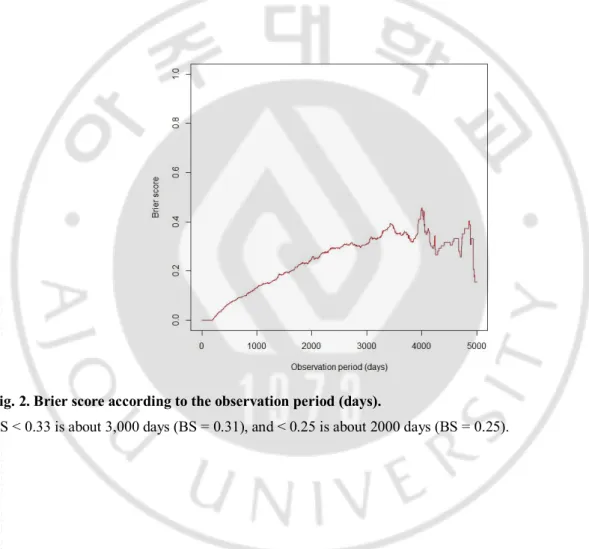
To evaluate the expected prediction error of the training set model, we calculated the weighted BS that gave the weighted value to censored data (Fig. 2). The period that the BS is <0.33 is approximately 3,000 days (BS = 0.31), and the period that the BS is <0.25 is approximately 2000 days (BS = 0.25). Thus, the prediction model gives a marginal predictive result for approximately until 3,000 days; however, until approximately 2,000 days, the model predicts a little bit better with <25% prediction error.
Fig. 2. Brier score according to the observation period (days).
18
2. Area under the curve
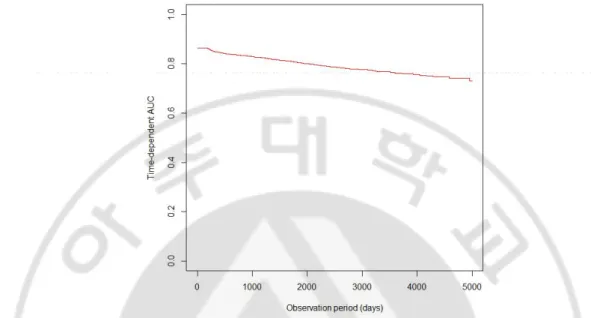
To evaluate the accuracy of the prediction model, we calculated time-dependent AUC (Fig. 3). The AUC was 0.80 for 2,000 days and 0.78 for 3,000 days.
Fig. 3. Area under the receiver operating characteristic curve according to the observation period (days).
19
E. Example cases applying to the prediction model
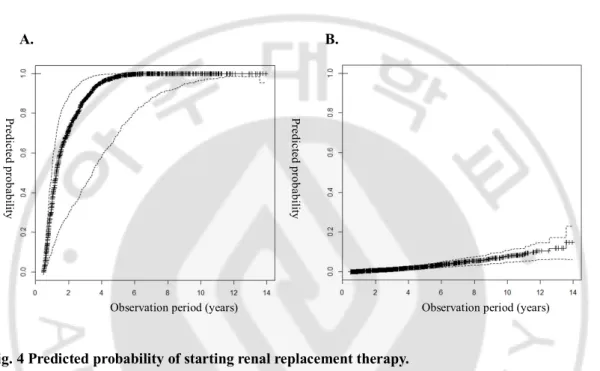
We analyzed 2 cases in which the observation period was approximately 5 years using the risk prediction model in the test set. Figure 4A shows the probability of the event graph of a 56-year-old female patient who progressed to RRT after 5 years. The probability of the event was >80% at 3 years and >95% at 5 years. Figure 4B shows the probability of the event in a 58-year-old male patient who did not progress to RRT after 5 years. The probability of an event was <20% at 10 years.
A. B.
Fig. 4 Predicted probability of starting renal replacement therapy.
A) Patient with RRT after 5 years of follow-up (age = 56 years, sex = female, DM = no, PKD = yes, albumin = 4.06 g/dla, hemoglobin = 8.01 g/dla, calcium = 8.31 mg/dla, phosphorus = 3.16 mg/dla, potassium = 4.95 mmol/La, eGFR = 18.36, protein = 2+). B) Patient without RRT censored after 5 years of follow-up (age = 58 years, sex = male, DM = yes, PKD = no, albumin = 4.65 g/dla, hemoglobin = 12.11 g/dla, calcium = 9.70 mg/dla, phosphorus = 3.10 mg/dla, potassium = 4.02 mmol/La, eGFR = 54.81, protein = negative).
(aintegral mean value)
Pr ed ic te d p ro ba bil ity Pr ed ic te d p ro ba bil ity
20
IV. DISCUSSION
CKD is asymptomatic in the early stages, but symptoms appear in the later stages, accompanied by complications such as cardiovascular disease, anemia, infection, cognitive impairment, and impaired physical function[8-11]. Kidney Disease: Improving Global
Outcomes (KDIGO) suggested prognosis of CKD divided by 6 categories of GFR, 3 categories
of albuminuria stage, and cause of disease. Based on these findings, they devised 3 broad risk categories based upon the likelihood of developing future kidney and cardiovascular complications[12]. However, eGFR assessment and ascertainment of albuminuria may not be enough to use for risk prediction in the clinic.
We considered many variables from previous articles that could affect renal function, including age, sex, laboratory findings, and comorbidities to develop a risk prediction model. These included variables such as young age, male sex, African-American ethnicity, diabetes, hypertension, obesity, urine protein, serum albumin, anemia, lipidemia, smoking, and cardiovascular disease[13]. In the RENAAL study, albuminuria, hypoalbuminemia, increased serum creatinine, and decreased hemoglobin were the risk factors associated with ESRD in patients with type 2 diabetes and nephropathy[14]. We collected data on the above variables, and identified data that were not measured in >50% of the patients. Our study was performed retrospectively in order to identify missing variables that could significantly affect RRT.
We identified variables that were associated with RRT through the clinical guidance and backward elimination (Wald) methods: age, sex, diabetes, PKD, serum albumin, serum hemoglobin, serum calcium, serum phosphate, serum potassium, eGFR, and urine protein. The results were similar to previous study. First, one study has reported that the risk of progression to ESRD was decreased among older patients with CKD stage 3 (hazard ratio [HR], 0.75; 95% confidence interval, 0.63–0.89 for each 10-year increase in age)[15] . Second, another study showed that male patients with CKD stage 4 and 5 had a shorter time to RRT as compared to female patients[16]. Third, it is thought that DM is rapidly becoming the most common cause of ESRD and is also associated with increasing the risk of ESRD[17]. In the AASK study, the change in urine protein from baseline to 6 months predicted the progression of RRT[18]. In the RENAAL study, baseline hemoglobin was a important independent variable for ESRD among diabetic patients[19]. Moreover, hypertension has been predictive of ESRD risk in several large
21
population-based studies[17, 20]. However, blood pressure was not an independent predictor of kidney failure event in the present study. The findings were similar in the RENAAL study, and this was likely due to the fact that blood pressure was well controlled in study patients[14]. It is possible that patients who were followed up in our clinic had well controlled hypertension as well.
To identify representative values that show renal function change over 6 months, we considered 8 modified values and developed a multivariate Cox proportional regression model. The integral mean contains the time and the value in order to obtain sufficient power to explain the change in data over 6 months. The end value had the highest R2, but there were insufficient
patients to evaluate the model. We will compare the integral mean and end value in a larger dataset in a further study.
Finally, we developed the renal prediction model with 11 variables by using integral means from continuous variables. To evaluate prediction error, we calculated the BS and the AUC according to time. The period that the BS is <0.25 is approximately 2,000 days and the AUC is <0.8 until 2,000 days. From the result of BS and AUC, we consider that our model has sufficient explanatory power to predict renal progression. If the observation duration is >3,000 days, however, it show random prediction.
The strength of our analysis is that we divided patients into 2 groups: the training set and the test set. Thus, we calculated BS and time-dependent AUC in order to confirm the accuracy of the model. Second, the equation needs to include variables that are very routinely available in the nephrology clinic for convenience of use. Local healthcare facilities can collect laboratory data easily and integrate the risk prediction tool into decision-making for patients that need further evaluation or in preparation for RRT.
The limitations of our analysis are that the study was performed retrospectively, and therefore, the data obtained are insufficient. We considered many variables while developing the risk prediction tool from the previous study, but there were insufficient data to evaluate from the electronic medical records. Second, there is no standard procedure for determining the initiation of RRT; therefore, initiation of therapy may reflect a personal opinion, and patients’ economic, social, and environmental factors may also affect the timing. However, selection of the test set from the same hospital meant that the prediction error was reduced because the characteristics of patients in the training set and test set were similar.
22
Many studies have identified a wide range of risk factors for the progression of CKD. Although many studies have identified similar risk factors, there has not been sufficient research performed on the risk prediction models for RRT. To develop accurate and easy-to-use models, further large prospective studies are required. Our predictive model for CKD may have sufficient power to predict RRT, as shown in 2 cases in our study. However, there are also cases that did not fit the model. If we collected data from a greater number of patients with greater accuracy, a more precise model could be developed. This could be achieved by cooperation among nephrologists and statisticians.
23
V.
REFERENCES
1. Tangri N, Stevens LA, Griffith J, Tighiouart H, Djurdjev O, Naimark D, Levin A, Levey AS. A predictive model for progression of chronic kidney disease to kidney failure. JAMA 305: 1553–1559, 2011.
2. Kim S, Lim CS, Han DC, Kim GS, Chin HJ, Kim SJ, Cho WY, Kim YH, Kim YS. The prevealence of chronic kidney disease (CKD) and the associated factors to CKD in urban Korea: a population-based cross-sectional epidemiologic study. J
Korean Med Sci 24: S11-21, 2009
3. Levey AS, de Jong PE, Coresh J, El Nahas M, Astor BC, Matsushita K, Gansevoort RT, Kasiske BL, Eckardt KU. The definition, classification, and prognosis of chronic kidney disease: a KDIGO Controversies Conference report. Kidney Int 80: 17–28, 2011.
4. Soveri I, Holme I, Holdaas H, Budde K, Jardine AG, Fellstrom B, A Cardiovascular Risk Calculator for Renal Transplant Recipients. Transplantation 94: 57-62,2012. 5. Gerds TA, Schumacher M. Consistent Estimation of the Expected Brier Score in
General Survival Models with Right-Censored Event Times. Biom J 48: 1029–1040, 2006.
6. Heagerty PJ, Zheng Y. Survival model predictive accuracy and ROC curves.
Biometrics 61: 92–95, 2005.
7. Song X, Zhou XH, A semiparametric approach for the Covariate specific ROC curve with Survival outcome, Statistica Sinica 18: 947-965,2008.
8. Fink JC, Brown J, Hsu VD, Seliger SL, Walker L, Zhan M. CKD as an underrecognized threat to patient safety. Am J Kidney Dis 53: 681–688, 2009. 9. James MT, Quan H, Tonelli M, Manns BJ, Faris P, Laupland KB, Hemmelgarn
BR; Alberta Kidney Disease Network. CKD and risk of hospitalization and death with pneumonia. Am J Kidney Dis 54: 24–32, 2009.
10. Hailpern SM, Melamed ML, Cohen HW, Hostetter TH. Moderate chronic kidney disease and cognitive function in adults 20 to 59 years of age: Third National Health and Nutrition Examination Survey (NHANES III). J Am Soc Nephrol 18: 2205–2213, 2007.
24
11. Wilhelm-Leen ER, Hall YN, K Tamura M, Chertow GM. Frailty and chronic kidney disease: the Third National Health and Nutrition Evaluation Survey. Am J
Med 122: 664–671 e2, 2009.
12. Levey AS, Coresh J, Chronic kidney disease, Lancet 379: 165-180, 2012
13. Taal MW, Brenner BM. Renal risk scores: progress and prospects. Kidney Int 73: 1216–1219, 2008.
14. Keane WF, Zhang Z, Lyle PA, Cooper ME, de Zeeuw D, Grunfeld JP, Lash JP, McGill JB, Mitch WE, Remuzzi G, Shahinfar S, Snapinn SM, Toto R, Brenner BM;RENAAL Study Investigators. Risk scores for predicting outcomes in patients with type 2 diabetes and nephropathy: the RENAAL study. Clin J Am Soc Nephrol 1: 761–767, 2006.
15. Eriksen BO, Ingebretsen OC. The progression of chronic kidney disease: a 10-year population-based study of the effects of gender and age. Kidney Int 69: 375–382, 2006.
16. Evans M, Fryzek JP, Elinder CG, Cohen SS, McLaughlin JK, Nyrén O, Fored CM. The natural history of chronic renal failure: results from an unselected, population-based, inception cohort in Sweden. Am J Kidney Dis 46: 863–870, 2005.
17. Haroun MK. Risk Factors for Chronic Kidney Disease: A Prospective Study of 23,534 Men and Women in Washington County, Maryland. J Am Soc Nephrol 14: 2934–2941, 2003.
18. Lea J, Greene T, Hebert L, Lipkowitz M, Massry S, Middleton J, Rostand SG, Miller E, Smith W, Bakris GL, The relationship between magnitude of proteinuria reduction and risk of end stage renal disease, Arch Intern Med 165: 947-953,2005 19. Mohanram A, Zhang Z, Shahinfar S, Keane WF, Brenner BM, Toto RD, Anemia
and end stage renal disease in patients with type 2 diabetes and nephropathy,
Kidney Int. 66: 1131-1138,2004
20. Iseki K, Iseki C, Ikemiya Y, Fukiyama K. Risk of developing end-stage renal disease in a cohort of mass screening. Kidney Int 49: 800–805, 1996.
25 - 국문요약 –
만성 신질환자에서 6개월간의 임상자료를 이용하여 신대체요법
시작 시점을 추정 할 수 있는가?
아주대학교 대학원의학과 박주한 (지도교수: 김흥수) 목적: 이 연구의 목적은 만성신질환 3단계 이상의 환자에서 신대체요법이 필요한 말기신부전증으로 진행하기까지의 시간이나 확률을 6개월간의 병원에서 흔히 사 용되는 검사결과 등을 이용하여 예측하는 모델을 개발하는 것이다. 방법: 아주대학교병원에서 1997년 10월부터 2012년 9월까지 기록되어 있는 전자의 무기록에서 데이터를 수집하였다. 만성신질환자(정의: eGFR <60 mL·min–1·1.73 m–2 가 3개월 이상 유지) 로 진단되고 6개월 이상 경과관찰 한 사람을 선택하였으며, 이를 무작위로 training set과 test set으로 나누어 training set을 통하여 추정 공식을 만든 후 test set에서 잘 들어 맞는지를 확인하였다.결과: 4,509명의 환자가 기준에 부합하였으며, 결측 값이 있는 환자를 제외하고 training set에 1,625명과 test set에 1,618명의 환자가 포함되었다. 6개월간의 데이터 를 반영할 수 있는 대표값으로 적분평균값이 가장 설명력이 높게 나타났다(R2 =
0.404). 또한 적분평균값을 적용하여 신대체요법과 관련있는 변수를 추출하였을 때, 11개의 변수 (age, sex, DM, PKD, serum albumin, serum hemoglobin, serum calcium, serum phosphorus, serum potassium, eGFR (MDRD), and urine protein)가 최종적으로 예 측 모델에 포함되었다(R2 = 0.403). 어떤 시점에서(t, years) 환자가 신대체요법을 받
26
이용하여 위 예측모델의 정확도를 확인하였고, 대략 2,000일까지는 예측오류 25% 미만, 3000일에는 50%정도의 예측오류가 발생할 수 있는 정확도를 가지고 있었다.
결론: 6개월간의 환자 데이터를 가장 잘 반영한 것은 적분평균값이었으며, 11개의 변수 (age, sex, DM, PKD, serum albumin, serum hemoglobin, serum calcium, serum phosphorus, serum potassium, eGFR (MDRD), and urine protein)가 신대체요법과 관련된 변수로 포함되었다. 만든 예측모델은 대략 3000일까지는 환자의 신대체요법을 예 측하는데 사용해 볼 수 있을 것으로 보이며, 더 정확한 모델을 만들기 위해서는 추후 더 많은 데이터를 이용한 연구가 필요할 것으로 보인다.
핵심어: 만성신질환, 신대체요법, 진행, 방정식