Background - The frequency of kidney transplantation (KT) is increasing. Blood transfusion plays an important role in the success of KT. Therapeutic plasma exchange (TPE) is also used for desensitisation in ABO-incompatible KT and treatment of antibody-mediated rejection.
Materials and methods - We analysed red blood cell (RBC), platelet, and fresh frozen plasma (FFP) usage and the number of TPE procedures performed during the hospitalisation of KT patients from 2002 to 2017 using the Korean National Health Insurance Service-National Health Information Database.
Results - A total of 18,331 KT patients were included in this study. The number of transfused RBCs continued to increase from 4,806 units in 2002-2005 to 12,390 units in 2014-2017. However, the average number of RBCs transfused per patient decreased from 2.17 to 1.79 units. Estimated platelet usage increased from 4,259 units in 2002-2005 to 11,519 units in 2014-2017, and the proportion of filtered platelets increased from 72.6% to 83.4% during the same period. There was a huge increase in the total number of FFP units used, from 2,255 units in 2002-2005 to 51,531 units in 2014-2017. The number of TPE procedures performed also increased from 296 to 6,479 during the same period. Patients with acute rejection accounted for 8.8% of all KT patients, and more RBC and FFP were used for these patients and a greater number of TPE procedures were performed compared to those who did not experience rejection. Discussion - Blood usage and TPE have increased steadily with the increasing numbers of KTs. Therefore, continuous efforts are needed to ensure appropriate perioperative blood preparation and usage for KT patients.
Keywords: kidney transplantation, therapeutic plasma exchange, blood transfusion,
fresh frozen plasma.
and therapeutic plasma exchange
in kidney transplantation during
a 16-year period in South Korea
Banseok Kim1, Minjin Kang2, Jae Kwang Lee2, Hyung Soon Lee3, Yongjung Park1,4
Original article
TRANSFUSION COMPLICATIONS
Arrived: 21 February 2020 Revision accepted: 24 April 2020
Correspondence: Yongjung Park
e-mail: [email protected]
1Department of Laboratory Medicine, National Health Insurance Service Ilsan Hospital, Goyang, Republic of Korea; 2Research Institute, National Health Insurance Service Ilsan Hospital, Goyang, Republic of Korea; 3Department of Surgery, National Health Insurance Service Ilsan Hospital, Goyang, Republic of Korea; 4Department of Laboratory Medicine, Gangnam Severance Hospital, Yonsei University College of Medicine, Seoul, Republic of Korea
INTRODUCTION
As the incidence of chronic kidney diseases increases, kidney transplantation (KT) is also showing an increasing trend1. Currently, more than 20,000 KTs are performed per year in
the United States2. In South Korea, the number of KTs also continues to increase, and there
are currently over 2,000 KTs performed per year3. Blood transfusion plays an important
role in the success of solid organ transplantation. Approximately 50% of patients with
have undergone haematopoietic stem cell or solid organ transplantations14.
Meanwhile, ABO incompatibility (ABOi) between recipients and donors is an important immunological barrier to KT15
since it is often associated with early graft loss due to antibody-mediated allograft rejection. However, ABOi KT has been made possible in different countries around the world due to the development of ABOi KT protocols16,17. In
these protocols, therapeutic plasma exchange (TPE) plays a role in reducing the titre of isoagglutinins to a donor’s ABO antigens and in maintaining a low isoagglutinin titre for a certain period of time after surgery18,19. During TPE
procedures, the recipient’s plasma is replaced by albumin solution and/or fresh frozen plasma (FFP). In addition, TPE is used as a tool for treating antibody-mediated rejection in transplant recipients. Consequently, the role of blood banks in hospitals that implement organ transplants is becoming more important through perioperative blood management and TPE in KT.
In this study, we analysed the number of RBC, platelet, and FFP units used during the hospitalisation of patients who underwent KT using the Korean National Health Insurance Service-National Health Information Database (NHIS-NHID) from 2002 to 2017. We also investigated the number of perioperative TPE procedures performed for the KT patients. We aimed to examine the status of blood usage and TPE in KTs and to provide available data on the amount of RBC, platelet, and FFP products used in the preparation for KT based on the representative nationwide data.
MATERIALS AND METHODS Data source
All individuals in South Korea have been obliged to join the Korean NHIS since the service started in 1989. The NHIS controls all medical costs among individuals, healthcare providers, and the government. Therefore, medical data including personal information, diagnosis, medical treatment, and demographics of patients have been centralised in the NHID. All claims are managed through the use of Electronic Data Interchange (EDI) codes. In addition, the NHIS-NHID includes the diagnosis of patients using the Korean Classification of Diseases (KCD) codes, which is the Korean version of the International Classification of Diseases (ICD).
end-stage renal disease (ESRD) are anaemic4. Red blood
cell (RBC) transfusions correct anaemia for patients awaiting KT and supplement blood loss during surgery. However, blood transfusions are associated with serious complications such as transfusion-related acute lung injury, transfusion-associated circulatory overload, and transmission of viral pathogens5,6. Therefore, when blood
is transfused into a KT patient, we should consider the benefits of transfusion vs the risks involved.
Meanwhile, alloimmunisation to the human leukocyte antigen (HLA) is well recognised as causing the common side effects of blood transfusions7. HLA antigens are
expressed on both platelets and leukocytes. Although RBCs do not present HLA antigens, RBC preparations usually contain a large number of leukocytes, which could lead to HLA alloimmunisation8. Consequently, RBC and
platelet preparations usually involve white blood cell (WBC) removal before transfusion into transplantation recipients. When lymphocytes are transfused to patients, especially to those with poor immune function such as those undergoing solid organ or bone marrow transplantations and those receiving radiation or chemotherapy, transfusion-associated graft-vs-host disease (TA-GvHD) may be induced. This occurs when the lymphocytes of blood donors proliferate in the recipient and attack tissues such as epithelial cells. TA-GvHD causes symptoms such as skin rash, fever, decreased liver function, jaundice, diarrhoea, and pancytopenia. Moreover, TA-GvHD is known to be associated with high mortality (approx. 90-100%9) and thus must be prevented. However, it is still
not clear whether a blood product needs to be irradiated in the case of transplantation recipients. Solid organ transplantation is not considered to be a high risk factor for TA-GvHD in the British guideline on transfusion10,
while another guideline identifies immunocompromised recipients of organ transplantation as candidates for blood irradiation11. TA-GvHDs had been reported in a
few cases after solid organ transplantation12,13, and using
a WBC removal filter to produce leukoreduced blood products is not sufficient to prevent TA-GvHD. Thus, blood products could, in addition, be irradiated in the case of transplantation recipients before being transfused. In the South Korean guideline on blood transfusion practices, it is intended that irradiation of blood products be adopted for immunocompromised patients, including those who
Study subjects
In the NHIS-NHID (2002-2017), data related to health insurance claims for a total of 20,750 patients during hospitalisations for KTs were analysed. The data from 21,191 reimbursed KT claims for the 20,750 patients were reviewed, and only the time prior to repeated surgery (if the same patient had undergone two or more KTs) was included in the analysis. Among them, 2,219 subjects who were considered as having received repeated KTs (with a history of previous KT and/or with continuous immunosuppressive medication prescribed prior to KT) and 200 with unclear medical histories were also excluded from the data analysis. This means that the study was conducted on a total of 18,331 patients who underwent KT for the first time during this 16-year period.
Variable definitions
We investigated the sex, age, hospital type, and occurrence of acute allograft rejection (AR) in a total of 18,331 KT patients. In addition, we analysed the number of TPE procedures performed, as well as the number of RBC, platelet, FFP, and albumin units utilised in the same subjects. One unit of packed RBC contains approximately 200 or 250 mL of blood products separated respectively from 320 or 400 mL of a donor’s whole blood. In the same manner, one unit of random donor platelets (RDP) containing approximately 0.5-0.7x10¹¹ platelets consists
of approximately 40-50 mL volume separated from 320 or 400 mL of whole blood. In addition, one unit of single donor platelets (SDP) is usually processed in 250 mL volume, which contains 3.0-4.0x10¹¹ platelets. One FFP
unit is usually manufactured in 160-180 mL volume. Meanwhile, bottles of 5% albumin solution in 250 mL or 20% albumin solution in 100 mL volume were used in the KT patients. Patients were classified into 4 age groups: <20, 20-39, 40-59, and ≥60 years old). Hospital types were classified into two separate groups: general hospitals (defined as having at least 100 beds) and tertiary hospitals (designated by the Korean Ministry of Health and Welfare as certain general hospitals that specialise in more complex medical treatments for severe diseases). Currently, there are 42 tertiary hospitals in South Korea. In order to analyse blood usage and the number of TPE procedures performed according to time period, a total of 16 years (2002-2017; the time period covered by the study) were divided into four groups of four years each. Since it
is difficult to specify the exact time of kidney allograft rejection due to the characteristics of the National Health Insurance claim data, AR was defined as any case where the diagnosis of kidney allograft rejection by ICD-10 codes T86 and/or T86.1 was recorded during the KT surgery-related hospitalisation period.
Statistical analysis
The Mann-Whitney U and Wilcoxon signed-rank tests were used to compare continuous variables between subject groups, and the χ2 test was used to compare categorical
variables. All statistical analyses were performed by SAS 7.15 (SAS Institute Inc., Cary, NC, USA) and RStudio v1.1.463 (RStudio Inc., Boston, MA, USA). p-values<0.05 were considered statistically significant.
Study approval
This study protocol was reviewed and approved by the Institutional Review Board of the National Health Insurance Service Ilsan Hospital (Institutional Review Board approval no. NHIMC 2019-01-001). This study used the NHIS-NHID (2002-2017), which was approved by the NHIS. The administration no. of the National Health Insurance Sharing Service was REQ0000029922.
RESULTS Study subjects
Of a total of 18,331 KT recipients in our study, 10,934 (59.6%) were male and 7,397 (40.4%) were female. The number of KTs continued to increase from 509 in 2002 to 1,865 in 2017 (Figure 1). In particular, the number of patients increased to figures over those of the previous year in 2006, 2011, and 2016. At the time of KT, the most common age group was those aged 50-59 years (5,738; 31.3%), followed by those aged 40-49 (4,917; 26.8%) and 30-39 years (3,298; 18.0%). Among the 18,331 cases, 15,662 (85.4%) KTs were performed in tertiary hospitals and 2,669 (14.6%) were performed in general hospitals.
RBC preparation usage
Regardless of the type of RBC preparation, the number of transfused RBC units continued to increase from 4,806 units in 2002-2005 to 12,390 units in 2014-2017 (Table I). However, the average number of units transfused per KT patient decreased from 2.17 to 1.79, respectively, in the same two study periods.
In filtered RBC units, the total number of units transfused, number of transfused patients, and the proportion of
filtered RBC units among all RBC preparations continued to increase during the study period. The percentage of filtered RBC units increased steadily from 62.8% in 2002-2005 to 81.8% in 2014-2017. However, the average number of filtered RBC units per transfused patient was maintained at around 4 units, except in the period 2002-2005.
In the case of packed RBCs, excluding filtered RBC and washed RBC, the total number of RBC units transfused, number of transfused patients, and the proportion of RBC units continued to decrease during the study period. In addition, the number of patients who were transfused with any type of RBCs increased from 1,097 in 2002-2005 to 3,179 in 2014-2017, but the percentage of
patients transfused with any type of RBCs among all KT patients remained constant at approximately 50% during the period 2002-2013, to then decrease to 45.9% during the period 2014-2017.
Platelet preparation usage
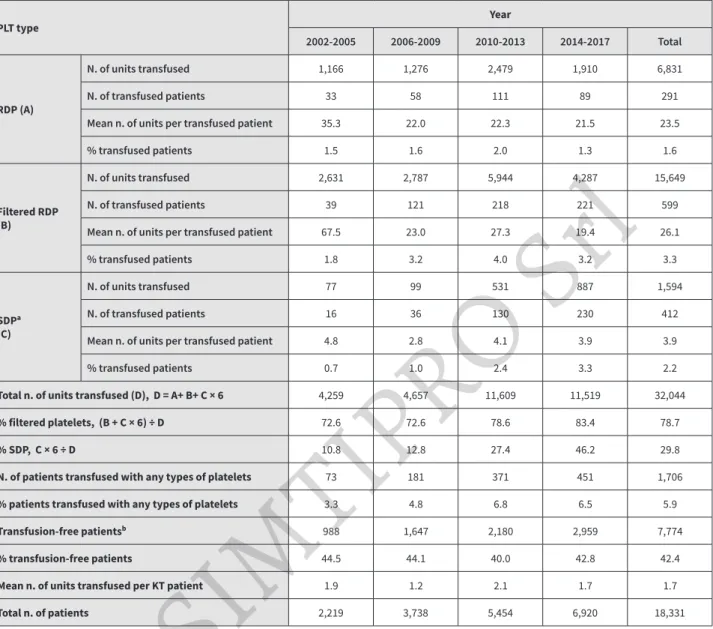
Perioperative platelet usage is summarised in Table II. A single unit of RDP contains approximately 0.5-0.7x10¹¹
platelets, and one SDP unit contains approximately 3.0-4.0x10¹¹ platelets. In this study, we counted 6 RDP
units as one SDP. In the case of RDP, an average of 35.3 units were transfused to 1.5% of all KT patients in 2002-2005, while an average of 21.5 units to 1.3% of patients in 2014-2017 and an average of 23.5 units to 1.6% of KT patients over the entire study period were used.
Table I - Perioperative red blood cell (RBC) unit usage in kidney transplantation by period
RBC type Year 2002-2005 2006-2009 2010-2013 2014-2017 Total Packed RBC (excluding filtered and washed RBC) N. of units transfused 1,717 1,740 2,048 1,248 6,753 N. of transfused patients 543 528 622 465 2,158
Mean n. of units per transfused
patient 3.2 3.3 3.3 2.7 3.1
% transfused patients 24.5 14.1 11.4 6.7 11.8
Filtered RBC
N. of units transfused 3,018 5,859 8,918 10,132 27,927
N. of transfused patients 647 1,449 2,203 2,616 6,915
Mean n. of units per transfused
patient 4.7 4.0 4.0 3.9 4.0
% transfused patients 29.2 38.8 40.4 37.8 37.7
Washed RBC
N. of units transfused 71 246 1,309 1,010 2,636
N. of transfused patients 30 59 241 296 626
Mean n. of units per transfused
patient 2.4 4.2 5.4 3.4 4.2
% transfused patients 1.4 1.6 4.4 4.3 3.4
Total n. of units transfused 4,806 7,845 12,275 12,390 37,316
% filtered RBC 62.8 74.7 72.7 81.8 74.8
N. of patients transfused with any type of RBCs 1,097 1,939 2,893 3,179 9,108
% patients transfused with any type of RBCs 49.4 51.9 53.0 45.9 49.7
Transfusion-free patientsa 988 1,647 2,180 2,959 7,774
% transfusion-free patients 44.5 44.1 40.0 42.8 42.4
Mean n. of units transfused per KT patient 2.2 2.1 2.3 1.8 2.0
Total n. of KT patients 2,219 3,738 5,454 6,920 18,331
aPatients without any transfusion including RBC, platelets, and fresh frozen plasma. KT: kidney transplantation.
In the case of filtered RDP, an average of 67.5 units were used for 1.8% of all KT patients in 2002-2005; however, during 2014-2017, an average of 19.4 units were used for 3.2% of KT patients. The proportion of patients who received filtered RDP slightly increased, but the average units transfused per patient decreased over time. During the study period, the average filtered RDP used per KT patient was 26.1 units, with 15,649 units transfused to 3.3% of all KT patients.
Regarding SDP, an average of 4.8 units were used for 0.7% of all KT patients in 2002-2005, but an average of 3.9 units
were used for 3.3% of KT patients in 2014-2017. Overall, an average of 3.9 SDP units were transfused to 2.2% of KT patients over the entire period with an increasing trend in the proportion of patients with SDP transfusions.
An estimated 32,044 platelet units were used in all KT patients over the 16-year period, with an average use per KT patient of 1.7 units, when SDP was estimated to be equivalent to 6 RDPs. The estimated percentage of filtered platelets increased from 72.6% in 2002-2005 to 83.4% in 2014-2017.
Table II - Perioperative platelet unit usage in kidney transplantation by period
PLT type Year
2002-2005 2006-2009 2010-2013 2014-2017 Total
RDP (A)
N. of units transfused 1,166 1,276 2,479 1,910 6,831
N. of transfused patients 33 58 111 89 291
Mean n. of units per transfused patient 35.3 22.0 22.3 21.5 23.5
% transfused patients 1.5 1.6 2.0 1.3 1.6
Filtered RDP (B)
N. of units transfused 2,631 2,787 5,944 4,287 15,649
N. of transfused patients 39 121 218 221 599
Mean n. of units per transfused patient 67.5 23.0 27.3 19.4 26.1
% transfused patients 1.8 3.2 4.0 3.2 3.3
SDPᵃ (C)
N. of units transfused 77 99 531 887 1,594
N. of transfused patients 16 36 130 230 412
Mean n. of units per transfused patient 4.8 2.8 4.1 3.9 3.9
% transfused patients 0.7 1.0 2.4 3.3 2.2
Total n. of units transfused (D), D = A+ B+ C × 6 4,259 4,657 11,609 11,519 32,044
% filtered platelets, (B + C × 6) ÷ D 72.6 72.6 78.6 83.4 78.7
% SDP, C × 6 ÷ D 10.8 12.8 27.4 46.2 29.8
N. of patients transfused with any types of platelets 73 181 371 451 1,706
% patients transfused with any types of platelets 3.3 4.8 6.8 6.5 5.9
Transfusion-free patientsᵇ 988 1,647 2,180 2,959 7,774
% transfusion-free patients 44.5 44.1 40.0 42.8 42.4
Mean n. of units transfused per KT patient 1.9 1.2 2.1 1.7 1.7
Total n. of patients 2,219 3,738 5,454 6,920 18,331
aPlatelet equivalents: 1 SDP = 6 RDP. bPatients without any transfusion including RBC, platelets, and fresh frozen plasma.
KT: kidney transplantation; PLT: platelets; RDP: random donor platelets; SDP: single donor platelets.
FFP and albumin usage and TPE procedures
The perioperative use of FFP and albumin and of TPE procedures for KTs in each period is summarised in Table III and Figure 1. In the case of FFP, an average of 8.9 units were transfused to 11.4% of all KT patients in 2002-2005, while an average of 32.8 units were transfused to 22.7% of patients during 2014-2017, resulting in a continuous increase in usage and in the percentage of patients with FFP transfusion. In addition, the percentage of FFP usage in the patients who underwent TPE among the FFP usage in all KT patients also continuously increased from 29.6% in 2002-2005 to 93.6% in 2014-2017. Overall, 87.7% of all FFP units used during the entire study period were transfused into the patients who underwent TPE.
The percentage of patients who were infused with albumin varied between 42.9% and 57.4% each year, but the total
annual usage increased from 1,063 in 2002 to 10,697 in 2017 due to the increase in the number of KTs. In addition, 64.9% of all albumin solution used throughout the entire study period was infused into the patients who underwent TPE. Regarding perioperative TPE, the percentage of patients who underwent plasma exchange increased from 6.3% in 2002-2005 to 20.1% in 2014-2017. The number of patients who underwent TPE and the total number of annual plasma exchange procedures also saw a continuous increase during the period studied.
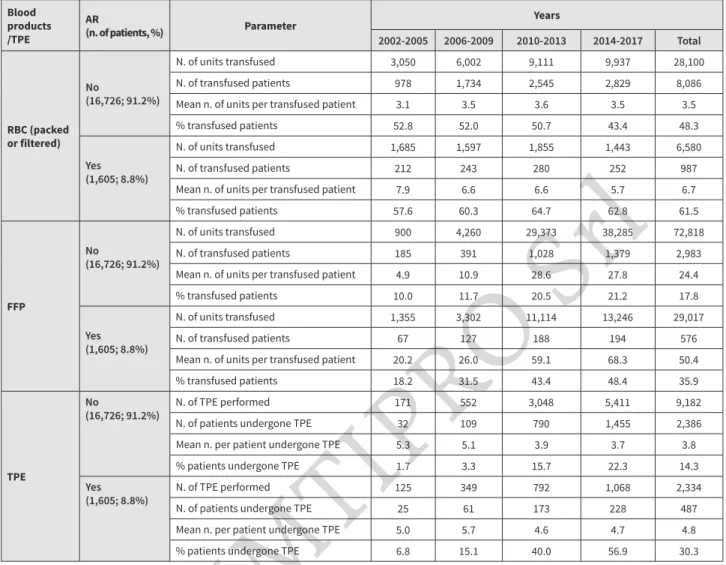
Blood use and TPE according to AR
Table IV summarises the number of blood preparations, albumin usage, and the number of TPE procedures performed according to the occurrence of AR during the study periods. The average number of RBC and FFP units used per transfused patient, percent of RBC- and
Table III - Perioperative fresh frozen plasma and albumin usage and therapeutic plasma exchange in kidney transplantation by period
Blood products/TPE Parameter Years
2002-2005 2006-2009 2010-2013 2014-2017 Total
FFP
All KT patients
N. of units transfused 2,255 7,562 40,487 51,531 101,835
N. of transfused patients 252 518 1,216 1,573 3,559
Mean n. of units per transfused patient 8.9 14.6 33.3 32.8 28.6
% transfused patients 11.4 13.9 22.3 22.7 19.4
Patients undergone TPE
N. of units transfused 668 4,030 36,388 48,241 89,323
Mean n. of units per transfused patient 4.8 11.8 36.4 34.6 31.1
% use in TPE patients among all KT
patients 29.6 53.3 89.9 93.6 87.7
Albumin
All KT patients
Total usage (bottle) 3,026 7,509 14,651 29,307 54,493
N. of patients infused 1,094 1,866 2,628 3,338 8,926
Mean usage per patient (bottle) 2.8 4.0 5.6 8.8 6.1
% patients infused 49.3 49.9 48.2 48.2 48.7
Patients undergone TPE
Total usage (bottle) 594 3,654 9,175 21,964 35,387
Mean usage per patient (bottle) 4.3 10.7 9.2 15.8 12.3
% use in TPE patients among all KT
patients 19.6 48.7 62.6 74.9 64.9
TPE
N. of TPE performed 296 901 3,840 6,479 11,516
N. of patients undergone TPE 139 341 1,000 1,393 2,873
Mean n. per patient undergone TPE 2.1 2.6 3.8 4.7 4.0
% patients undergone TPE 6.3 9.1 18.3 20.1 15.7
FFP: fresh frozen plasma; KT: kidney transplantation; TPE: therapeutic plasma exchange.
FFP-transfused patients, average number of TPE procedures performed, and the proportion of patients who underwent TPE were higher in patients with AR than without AR. In the case of RBC preparations, an average of 3.5 units per patient were transfused in 48.3% of KT patients without AR, compared with an average of 6.7 units per patient that were transfused in 61.5% of KT patients with AR. In addition, an average of 24.4 FFP units per patient were transfused in 17.8% of KT patients without AR, while an average of 50.4 FFP units per patient were used in 35.9% of KT patients with AR. Finally, an average 4.8 TPE procedures were performed in 30.3% of all KT patients with AR, compared with an average 3.8 in 14.3% of KT patients without AR. Demographics of KT patients with or without AR Table V compares the groups of patients with or without AR. A total of 1,605 (8.8%) patients experienced AR. The proportion of male patients was significantly higher in the group without AR. There was no difference in mean
age between the two groups, but the proportions of each age group in the two groups differed. The AR group had a higher proportion of KT patients aged 20-59 years old. Meanwhile, the incidence of AR was 16.6% among 2,219 KT recipients in 2002-2005, whereas the incidence in 2014-2017 was 5.8% among 6,920 KT patients, showing a decreasing trend of AR incidence throughout the study period. The length of hospital stay and medical costs were higher in the AR group. Furthermore, the use of albumin, FFP, and RBC preparations, and the number of TPE procedures performed were also significantly higher in the AR group.
DISCUSSION
Kidney transplantation is the ideal treatment for patients with ESRD20. In the case of deceased donor transplantation,
in which the ABO blood group and HLA antigen types of the donor and recipient are all identical, the organs will be preferentially transplanted. As of 2016, KTs from deceased Figure 1 - Changes in the total number of patients (*), and the numbers of patients who underwent perioperative therapeutic plasma exchanges (TPE) (■), perioperative TPE performed (●), fresh frozen plasma (FFP) units transfused into TPE patients (▲), and albumin solution infused into TPE patients (◆) from 2002 to 2017 in kidney transplantations
donors has continued to increase, accounting for 47.4% of all KT cases in South Korea21, but an even higher number
of KT recipients have received kidney allografts from living donors. KTs from living donors may be contraindicated owing to the increased possibility of AR if the ABO blood group is incompatible between the donor and recipient or if the patient has antibodies against the donor HLAs. However, a variety of desensitisation methods have recently been used to remove antibodies against ABO antigens or HLAs22,23. These methods include antibody
removal using TPE or immunoadsorption, and/or immune system regulation using agents such as intravenous immunoglobulins, rituximab (monoclonal anti-CD20 antibody), or bortezomib (proteasome inhibitor).
Since ABOi KT was first used in South Korea in 2007, the
proportion of ABOi KTs has increased and accounted for 26.3% of KTs from living donors in 20183. In this study,
we analysed the trends in the number of TPE procedures performed and the use of albumin and FFP related to KT. The number of KTs performed each year had increased steadily from 509 cases in 2002 to 1,865 cases in 2017 (Figure 1). Meanwhile, the number of TPE procedures performed had increased slightly from 85 cases in 2002 to 272 cases in 2009, but increased sharply from 587 cases in 2010 to 1,877 cases in 2017. Parameters regarding the use of FFP, including the number of transfused patients and proportion of transfused patients among KT recipients, had increased during the study periods (Table III). On the other hand, the total number of transfused FFP units had increased rapidly from 2010, as did TPE, but no further
Table IV - Perioperative blood use and therapeutic plasma exchange according to acute kidney allograft rejection by period
Blood products /TPE AR (n. of patients, %) Parameter Years 2002-2005 2006-2009 2010-2013 2014-2017 Total RBC (packed or filtered) No (16,726; 91.2%) N. of units transfused 3,050 6,002 9,111 9,937 28,100 N. of transfused patients 978 1,734 2,545 2,829 8,086
Mean n. of units per transfused patient 3.1 3.5 3.6 3.5 3.5
% transfused patients 52.8 52.0 50.7 43.4 48.3
Yes (1,605; 8.8%)
N. of units transfused 1,685 1,597 1,855 1,443 6,580
N. of transfused patients 212 243 280 252 987
Mean n. of units per transfused patient 7.9 6.6 6.6 5.7 6.7
% transfused patients 57.6 60.3 64.7 62.8 61.5 FFP No (16,726; 91.2%) N. of units transfused 900 4,260 29,373 38,285 72,818 N. of transfused patients 185 391 1,028 1,379 2,983
Mean n. of units per transfused patient 4.9 10.9 28.6 27.8 24.4
% transfused patients 10.0 11.7 20.5 21.2 17.8
Yes (1,605; 8.8%)
N. of units transfused 1,355 3,302 11,114 13,246 29,017
N. of transfused patients 67 127 188 194 576
Mean n. of units per transfused patient 20.2 26.0 59.1 68.3 50.4
% transfused patients 18.2 31.5 43.4 48.4 35.9
TPE
No
(16,726; 91.2%) N. of TPE performedN. of patients undergone TPE 17132 552109 3,048790 5,4111,455 9,1822,386
Mean n. per patient undergone TPE 5.3 5.1 3.9 3.7 3.8
% patients undergone TPE 1.7 3.3 15.7 22.3 14.3
Yes
(1,605; 8.8%) N. of TPE performedN. of patients undergone TPE 12525 34961 792173 1,068228 2,334487
Mean n. per patient undergone TPE 5.0 5.7 4.6 4.7 4.8
% patients undergone TPE 6.8 15.1 40.0 56.9 30.3
AR: acute kidney allograft rejection; FFP: fresh frozen plasma; RBC: red blood cells; TPE: therapeutic plasma exchange.
increases were seen after 2012. Regarding albumin, the total usage showed a gradual increase, but this rose rapidly after 2015 (Figure 1). This could have been caused by a recent increase in the use of albumin instead of FFP as the replacement fluid for TPE.
Compared to the increase in FFP use, the overall use of RBC preparations showed a constant increase from 4,806 units in 2002-2005 to 12,390 units in 2014-2017, but the mean number of RBC units transfused per KT patient decreased from 2.17 to 1.79 units for the same period of time, with 2.04 units per KT patient being used throughout the entire study period (Table I). In addition, the estimated usage of total platelet preparations regardless of platelet type continued to increase from 4,336 units in 2002-2005 to 12,406 units in 2014-2017, but the average number of units transfused per KT patient decreased from 1.92 to
1.66 units during the same period of time. When RBC and platelet preparations are transfused before and after organ transplantation, leukocyte filtration and irradiation of blood products may be required to prevent HLA alloimmunisation and platelet refractoriness caused by WBC in those preparations, and to prevent TA-GvHD and transmission of viruses such as cytomegalovirus and human T-cell leukemia virus24. In this study, the
number of filtered RBC units used and number of patients transfused with filtered RBCs continuously increased over the study period, but the average number of units per transfused patient has remained constant at around 4 units since 2006 (Table I). The percentage of filtered RBCs among total RBC preparations had been on a steady rise from 62.8% in 2002-2005 to 81.8% in 2014-2017. These results would imply that clinical practices regarding blood
Table V - Demographics of kidney transplantation patients with or without acute kidney
Characteristics No AR (n=16,726) AR (n=1,605) p-value N. of male (%) 10,080 (60.3) 854 (53.2) <0.0001 Age (years)ᵃ 46.8 ± 12.4 46.3 ± 12.0 0.0934 Age group, n. (%) 0.0293 <20 413 (2.5) 30 (1.9) 20-39 4,129 (24.7) 419 (26.1) 40-59 9,701 (58.0) 954 (59.4) ≥60 2,483 (14.8) 202 (12.6) Hospital type, n. (%) 0.0513 Tertiary 14,317 (85.6) 1,345 (83.8) General 2,409 (14.4) 260 (16.2) Periods <0.0001 2002-2005 1,851 (11.1) 368 (22.9) 2006-2009 3,335 (19.9) 403 (25.1) 2010-2013 5,021 (30.0) 433 (27.0) 2014-2017 6,519 (39.0) 401 (25.0)
Length of hospital stay (days)ᵇ 25 (19-33) 30 (22-43) <0.0001
Medical costs (1,000 KRW)b,c 16,683 (13,365-20,803) 18,954 (13,086-29,070) <0.0001
TPE
N. of patients (%) 2,386 (14.3) 487 (30.3) <0.0001
N. of TPE performedb,d 3 (2-5) 4 (2-6) <0.0001
Albumin infused (bottle)ᵇ 3 (1-3) 3 (1-9) <0.0001
FFP transfused (unit)ᵇ 11 (3-30) 20 (5-68) <0.0001
Filtered RBC used (unit)ᵇ 2 (2-4) 4 (2-7) <0.0001
Packed RBC used (unit)ᵇ 2 (1-3) 3 (2-6) <0.0001
ᵃShown as ‘mean ± standard deviation’. ᵇShown as ‘median (1st to 3rd quartiles)’. ᶜ1 US Dollar = 1167.1 KRW (South Korean Won), 03/01/2020. dN. of TPE
procedures performed per patient who underwent TPE.
AR: acute allograft rejection; FFP: fresh frozen plasma; RBC: red blood cells; TPE: therapeutic plasma exchange.
transfusions for KT recipients had been heterogenous across South Korea. Similarly, the percentage of filtered platelets had also steadily increased from 72.6% in 2002-2005 to 83.4% in 2014-2017 (Table II). This is thought to have resulted not only from the increased use of filtered platelets, but also the increased use of SDPs (from 10.8% in 2002-2005 to 46.2% in 2014-2017).
Meanwhile, the differences between the characteristics of patients with or without AR are summarised in Table V. The proportion of males was significantly lower in the AR group. Alloimmunisation and rejection are usually more frequent in females, but the reported effects of sex in developing kidney allograft rejection were inconsistent in several previous studies25-27. In our results, the incidence
of AR showed a decreasing trend over time. Induction of immune suppression by agents including antithymocyte globulin has been known to be effective in the prevention of AR28,29. Use of new immunosuppressive drugs such
as sirolimus and mycophenolate mofetil have also been shown to reduce the incidence of AR in KT patients30,31. The
growing clinical experience, along with improvements in surgical techniques and patient management, seem to have contributed to the decrease in AR.
In the AR group of our data, hospital stay was longer and medical costs higher compared to those among patients without AR. The number of TPE procedures performed, as well as the use of albumin, FFP, and RBC were also higher in the AR group. Greater use of blood products and TPE in our data would be considered to be one of the reasons for the increase in medical costs for hospitalisation in the AR group. One previous study reported that development of AR led to increased medical costs, accounting for 2.3-3.8% of total incurred costs over one year after KT32.
In this study, differences were seen in the consumption of medical resources including blood products according to the occurrence of AR; therefore, the clinical condition of KT recipients should be considered when preparing blood products in the blood banks of institutions performing KT. This study analysed a 16-year period using the Korean NHIS-NHID and investigated the use of blood preparations for a total number of 18,331 patients who underwent KT for the first time in South Korea. Due to the limitations of the data related to health insurance claims, we were not able to distinguish between pre- and post-operative blood transfusions, and we were also unable to obtain detailed clinical information about KT patients, such as the exact
timing of the AR occurrence, whether the KT recipient and donor were ABOi, or whether the donor type was "living" or "deceased". Despite these shortcomings, our data have identified trends in blood use in KTs, since it covered most of the blood preparations used and plasma exchanges performed for KT patients during a 16-year period in South Korea.
CONCLUSIONS
In this study, we confirmed a continued increase in blood usage as the number of KTs increased. FFP and albumin usage, as well as the number of TPE procedures performed, also increased significantly over time. Although there was no increase in the average number of units transfused per KT patient in the case of RBC and platelet preparations, total blood usage increased steadily as the number of KTs increased. There is a growing need for appropriate use of blood resources due to ageing populations worldwide. Therefore, blood banks are assuming an ever more important role in successful KTs. In conclusion, continuous efforts are needed to ensure proper perioperative preparation and usage of blood for KT patients.
ACKNOWLEDGEMENTS
This work was supported by the National Health Insurance Ilsan Hospital grant (2019-20-002). This study used NHIS-NHID data (REQ0000029922), made by National Health Insurance Service. This study was approved by the Institutional Review Board of National Health Insurance Service Ilsan Hospital (Institutional review board No: NHIMC 2019-01-001).
FUNDING AND RESOURCES
This work was supported by the National Health Insurance Ilsan Hospital grant (2019-20-002). This study used NHIS-NHID data (REQ0000029922), made by National Health Insurance Service. The authors alone are responsible for the content and writing of the paper.
AUTHORSHIP CONTRIBUTIONS
YP designed the study. MK and YP performed the mathematical and statistical analysis of the data. JKL performed additional statistical analysis for the revision of the manuscript and produced the data for the Tables. BK, HSL, and YP interpreted the results. BK and YP wrote the manuscript, and elaborated the graphics. HSL and YP revised the manuscript.
The Authors declare no conflicts of interest.
REFERENCES
1. Chapman JR. What are the key challenges we face in kidney transplantation today? Transplant Res 2013; 2: S1.
2. Department of Health & Human Services. Organ Procurement and Transplantation Network National Data Reoprt. Available at: https:// optn.transplant.hrsa.gov/data/view-data-reports/national-data/. Accessed on 07/01/2020.
3. Korean Network for Organ Sharing. Statistics of Organ Transplantation. Available at: https://www.konos.go.kr/konosis/index.jsp. Accessed on 07/01/2020.
4. Stauffer ME, Fan T. Prevalence of anemia in chronic kidney disease in the United States. PloS one 2014; 9: e84943.
5. Scornik JC, Bromberg JS, Norman DJ, et al. An update on the impact of pre-transplant transfusions and allosensitization on time to renal transplant and on allograft survival. BMC Nephrol 2013; 14: 217.
6. Mazzeffi M, Tanaka K, Galvagno S. Red Blood Cell Transfusion and surgical site infection after colon resection surgery: a cohort study. Anesth Analg 2017; 125: 1316-21.
7. Brown CJ, Navarrete CV. Clinical relevance of the HLA system in blood transfusion. Vox Sang 2011; 101: 93-105.
8. Snyder EL. Prevention of HLA alloimmunization: role of leukocyte depletion and UV-B irradiation. Yale J Biol Med 1990; 63: 419-27.
9. Brubaker DB. Human posttransfusion graft-versus-host disease. Vox Sang 1983; 45: 401-20.
10. Treleaven J, Gennery A, Marsh J, et al. Guidelines on the use of irradiated blood components prepared by the British Committee for Standards in Haematology blood transfusion task force. Br J Haematol 2011;
152: 35-51.
11. Asai T, Inaba S, Ohto H, et al. Guidelines for irradiation of blood and blood components to prevent post-transfusion graft-vs.-host disease in Japan. Transfus Med 2000; 10: 315-20.
12. Andersen CB, Ladefoged SD, Taaning E. Transfusion-associated graft-versus-graft and potential graft-versus-host disease in a renal allotransplanted patient. Hum Pathol 1992; 23: 831-4.
13. Sola MA, Espana A, Redondo P, et al. Transfusion-associated acute graft-versus-host disease in a heart transplant recipient. Br J Dermatol 1995;
132: 626-30.
14. Korea Centers for Disease Control and Prevention. National Transfusion Guideline. Available at: http://www.cdc.kr/board.es? mid=a40305010000&bid =0019&act=view&list_no=138134&tag=&nPage=22. Accessed on 22/03/2020. 15. Cook DJ, Graver B, Terasaki PI. ABO incompatibility in cadaver donor
kidney allografts. Transplant Proc 1987; 19: 4549-52.
16. Morath C, Zeier M, Dohler B, et al. ABO-incompatible kidney transplantation. Front Immunol 2017; 8: 234.
17. Koo TY, Yang J. Current progress in ABO-incompatible kidney transplantation. Kidney Res Clin Pract 2015; 34: 170-9.
18. Gloor JM, Lager DJ, Moore SB, et al. ABO-incompatible kidney transplantation using both A2 and non-A2 living donors. Transplantation 2003; 75: 971-7.
19. Tanabe K, Takahashi K, Sonda K, et al. Long-term results of ABO-incompatible living kidney transplantation: a single-center experience. Transplantation 1998; 65: 224-8.
20. Knoll G. Trends in kidney transplantation over the past decade. Drugs 2008; 68 (Suppl 1): 3-10.
21. Korean Network for Organ Sharing. Statistics Report on Organ Transplantation and Tissue Donation 2017. (Update on 2018.8.31.) Available at: https://www.konos.go.kr/konosis/index.jsp. Accessed on 07/01/2020.
22. Kim Y, Chung B, Yang C. Current issues in ABO-incompatible kidney transplantation. J Korean Soc Transplant 2014; 28: 5.
23. Marfo K, Lu A, Ling M, Akalin E. Desensitization protocols and their outcome. Clin J Am Soc Nephrol 2011; 6: 922-36.
24. Badami KG. The immunocompromised patient and transfusion. Postgrad Med J 2001; 77: 230-4.
25. Dunn TB, Noreen H, Gillingham K, et al. Revisiting traditional risk factors for rejection and graft loss after kidney transplantation. Am J Transplant 2011; 11: 2132-43.
26. Cole EH, Johnston O, Rose CL, Gill JS. Impact of acute rejection and new-onset diabetes on long-term transplant graft and patient survival. Clin J Am Soc Nephrol 2008; 3: 814-21.
27. Gore JL, Pham PT, Danovitch GM, et al. Obesity and outcome following renal transplantation. Am J Transplant 2006; 6: 357-63.
28. Hwang SD, Lee JH, Lee SW, et al. Efficacy and safety of induction therapy in kidney transplantation: a network meta-analysis. Transplant Proc 2018; 50: 987-92.
29. Sheashaa HA, Hamdy AF, Bakr MA, et al. Long-term evaluation of single bolus high dose ATG induction therapy for prophylaxis of rejection in live donor kidney transplantation. Int Urol Nephrol 2008; 40: 515-20.
30. Tedesco Silva H Jr., Rosso Felipe C, Medina Pestana JO. Reviewing 15 years of experience with sirolimus. Transplant Res 2015; 4: 6.
31. Wagner M, Earley AK, Webster AC, et al. Mycophenolic acid versus azathioprine as primary immunosuppression for kidney transplant recipients. Cochrane Database Syst Rev 2015: CD007746.
32. Gheorghian A, Schnitzler MA, Axelrod DA, et al. The implications of acute rejection and reduced allograft function on health care expenditures in contemporary US kidney transplantation. Transplantation 2012; 94: 241-9.