저작자표시-비영리-변경금지 2.0 대한민국 이용자는 아래의 조건을 따르는 경우에 한하여 자유롭게 l 이 저작물을 복제, 배포, 전송, 전시, 공연 및 방송할 수 있습니다. 다음과 같은 조건을 따라야 합니다: l 귀하는, 이 저작물의 재이용이나 배포의 경우, 이 저작물에 적용된 이용허락조건 을 명확하게 나타내어야 합니다. l 저작권자로부터 별도의 허가를 받으면 이러한 조건들은 적용되지 않습니다. 저작권법에 따른 이용자의 권리는 위의 내용에 의하여 영향을 받지 않습니다. 이것은 이용허락규약(Legal Code)을 이해하기 쉽게 요약한 것입니다. Disclaimer 저작자표시. 귀하는 원저작자를 표시하여야 합니다. 비영리. 귀하는 이 저작물을 영리 목적으로 이용할 수 없습니다. 변경금지. 귀하는 이 저작물을 개작, 변형 또는 가공할 수 없습니다.
Therapeutic Effects of Human Mesenchymal Stem
Cells on Traumatic Brain Injury in Rats: Secretion
of Neurotrophic Factors and Inhibition of
Apoptosis
by
Hwa Jung Kim
Major in Molecular Medicine
Department of Medical Sciences
The Graduate School, Ajou University
Therapeutic Effects of Human Mesenchymal Stem
Cells on Traumatic Brain Injury in Rats: Secretion
of Neurotrophic Factors and Inhibition of
Apoptosis
by
Hwa Jung Kim
A Dissertation Submitted to The Graduate School of Ajou University
in Partial Fulfillment of the Requirements for the Degree of Ph.D. in
Biomedical Sciences
Supervised by
Se Hyuk Kim, M.D.,Ph.D
Major in Molecular Medicine
Department of Medical Sciences
The Graduate School, Ajou University
February, 2009
This certifies that the dissertation
of Hwa Jung Kim is approved.
SUPERVISORY COMMITTEE
Jae-Ho Lee
Se-Hyuk Kim
Soo-Han Yoon
Eun-Hye Joe
Yong-Sam Shin
The Graduate School, Ajou University
December, 22th, 2008
-ABSTRACT-
Therapeutic Effects of Human Mesenchymal Stem Cells on
Traumatic Brain Injury in Rats: Secretion of Neurotrophic
Factors and Inhibition of Apoptosis.
Traumatic brain injury (TBI) leads to secondary brain insults, which often result in permanent functional loss of damaged cells. Many researchers have looked for methods that will reduce secondary brain damage since there is no effective therapeutics to recover functional loss of damaged tissues. The severity of the secondary mechanism of TBI depends upon two factors: injury severity (mild, moderate or severe) and location of the primary injury. Secondary brain damage has been known to involve neuroinflammatory, apoptotic and oxidative stress mechanisms which are mainly dependent on intracerebral production of cytokines. The development of an experimental model that resembles pathological and functional changes in human brain is critical in providing an effective therapeutics for human TBI. The controlled cortical impact (CCI) model is frequently used for TBI models in animals because it enables the physical adjustment of injury levels and has close pathological resemblance to actual human TBI. However, little is known about the severity of brain injury according to injury-induction parameters. In this study, morphological changes and behavioral scores after TBI in rats were measured according to the different impact velocity and depth of deformation; these parameters were further investigated to provide a guideline for establishing a TBI animal model. In recent years, there has been increasing interest in the use of mesenchymal stem cells (MSCs) as cell therapy for TBI. To investigate the therapeutic effects and their possible mechanisms of human bone marrow-derived mesenchymal stem cells (hMSCs) in the rat model of TBI, we analyzed the neurological functions and in vivo growth factor production. Male Sprague-Dawley rats were injured with a CCI device and divided into two experimental groups: those which received hMSCs intravenously 24 hours after TBI and those injected with saline only as placebo. For the analysis of in vivo production of growth factors, the animals were sacrificed 2, 8, 15, and 29 days (n=6 for each group at each day) after TBI, and the injured hemispheres were extracted.
We measured the level of nerve growth factor (NGF), brain-derived neurotrophic factor (BDNF), neurotrophin-3 (NT-3), vascular endothelial growth factor (VEGF) and basic fibroblast growth factor (bFGF) in the brain, using enzyme-linked immunosorbent assay (ELISA). The neurological function assessed by rotarod motor test and modified neurological severity scores (mNSS) recovered significantly in the animals treated with hMSCs 15 days after TBI. Quantitative ELISA studies showed that the in vivo expressions of NT-3 and NGF 2 and 8 days after TBI and the in vivo expression of BDNF 2 days after TBI were significantly increased (p < 0.05) in the treated group compared to the placebo group. Additionally, NGF and BDNF mRNA expression were up-regulated 2 and 8 days after TBI in the animals treated with hMSCs. Immunohistochemical studies showed that the expression of NGF, BDNF, and NT-3 were stronger in the injured hemispheres of the treated group compared to those of the placebo group 2 days after TBI. Western blotting showed that pAkt expression was up-regulated 2 days after TBI and caspase-3 cleavage was significantly decreased 8 days after TBI in hMSCs group. Our results suggest that treatment of TBI with hMSCs during the acute phase can enhance the functional outcome and the augmentation of neurotrophic factors in the injured hemisphere can be one of possible mechanisms for functional recovery by reducing neuronal apoptosis.
Key words: traumatic brain injury, human mesenchymal stem cells, neurotrophic factors, apoptosis, functional recovery
TABLE OF CONTENTS
ABSTRACT ... i
TABLE OF CONTENTS ... iii
LIST OF FIGURES ... vi
LIST OF TABLES ………...……....…... ix
ABBREVIATION ... x
I. INTRODUCTION ... 1
II. MATERIALS AND METHODS 1. Animal model of TBI ... 4
2. Impact velocity calibration ………..………. 4
3. Assessment of neurological function ... 5
4. Optical microscopic observation of preliminary laboratory animals ………..………… 7
5. Impact velocity and depth of deformation ………... 7
6. Measurement of injured area ….………..………. 7
7. Isolation and preparation of hMSCs for transplantation ………..………... 8
8. Experimental groups ... 9
9. Enzyme-Linked Immunosorbent Assay (ELISA) ... 13
10. Immunohistochemical evaluation ... 13
11. Western blot analysis and immunoprecipitation ... 14
11-1. Western blot analysis ……….. 14
11-2. Immunoprecipitation ……….. 14 iii
11-3. pAkt expression in neurotrophins-treated PC12 cells …….……..……… 15
12. Determination of NGF, NT-3 and BDNF mRNA levels ………..……… 16
12-1. RNA extraction ………... 16
12-2. Reverse transcription (RT) ………. 16
12-3. PCR ……… 17
13. Statistical Analysis ... 19
III. RESULT ... 20
Part A. Animal Model of Traumatic Brain Injury Induced by Controlled Cortical Impact Device 1. Impact velocity with differential compressed air pressure ... 20
2. Changes of behavioral score after injury ... 20
3. Optical microscopic observation ... 20
4. Changes in the neurobehavioural scores according to the different impact velocity and the different depth of deformation ... 21
4-1. Rotarod motor test ……… 21
4-2. Modified neurological severity score ………... 21
5. Morphological changes (TTC stain result) ... 22
Part B. Therapeutic effects of human mesenchymal stem cells on traumatic brain injury in rats 1. Neurological function improved significantly in rats with TBI that received hMSCs treatment ... 29
2. Transplanted hMSCs migrated to perilesional area ………..… 29 iv
3. Minor portion of transplanted hMSCs differentiated into neuronal or
glial cells ………....… 31
4. Tissue levels of NGF, NT-3 and BDNF were significantly increased in the hMSCs-treated group …………... 35
5. A little increased concentration of NGF in hMSCs cultures medium ... 37
6. Transplanted hMSCs migrated to the perilesional area and secreted growth factors ………... 39
7. Relative expression of neurotrophin mRNA in traumatized rat brain ……….. 41
8. Detection of growth factors in protein level (western blot and Immunoprecipitation) .……….………..… 41
9. Detection of receptor on growth factors ………... 44
10. Up-regulation of pAkt and reduced caspase-3 cleavage in the hMSCs-treated group ... 47
IV. DISCUSSION ... 52
Part A. Animal Model of Traumatic Brain Injury Induced by Controlled Cortical Impact Device ……….………... 52
Part B. Therapeutic effects of human mesenchymal stem cells on traumatic brain injury in rats ……….………..… 55
V. CONCLUSION ... 59
REFERENCES ... 61
국문요약 ... 70
LIST OF FIGURES
Fig. 1. Overall experimental scheme ……….………...…. 11
Fig. 2. Experimental group design ………..………….. 12
Fig. 3. Neurological changes after controlled cortical impact injury in the rat TBI model .. 24
Fig. 4. Pathological findings (Cresyl violet stain) showing the different magnitude of brain injuries according to the different cortical impact pressure (velocity) …………..….. 25
Fig. 5. Results of neurobehavioral functional tests ………...……… 26
Fig. 6. 2,3,5-triphenyltetrazolium chloride monohydrate (TTC) staining findings …..…… 27
Fig. 7. The ratio of injured volume of ipsilateral cortex and hippocampus compared to contralateral structures at various injury parameters ……….…….….… 28
Fig. 8. Graphs demonstrating rotarod motor scores and mNSS at different time points ….. 30
Fig. 9. Migration of transplanted hMSCs at different time points ………....… 32 vi
Fig. 10. Neuronal cell differentiation of transplanted hMSCs at 15 days after TBI …….… 33
Fig. 11. Astrocyte differentiation of transplanted hMSCs at 15 days after TBI ….………... 34
Fig. 12. In-vivo levels of cytokines measured in the injured cerebral hemisphere
extracts using ELISA ………..………. 36
Fig. 13. Enzyme-linked immunosorbent assay (ELISA) of nerve growth factor (NGF) protein in media from human mesenchymal stem cells cultures ………... 38
Fig. 14. Immunohistochemical staining of cytokines at day 2 and 15 after TBI …...……... 40
Fig. 15. Neurotrophin mRNA expression in traumatic rat brain ………...…….... 42
Fig. 16. Detection of NGF, BDNF and NT-3 using western blot analysis and
immunoprecipitation ……….... 43
Fig. 17. TrkA signaling pathway ……….………...…………... 45
Fig. 18. Western blot analysis of pAkt and pTrkA in the presence of PC12 cells and rat brain ……….…… 46
Fig. 19. Effects of hMSC transplantation on MAPK and pAkt expression after TBI .…..… 49
Fig. 20. Inhibition of apoptosis pathway ………...….……...… 50
Fig. 21. Effects of hMSCs transplantion on caspase-3 and Bcl-2 expression after TBI …... 51
LIST OF TABLE
Table 1. Modified neurological severity scores (mNSS) ……… 6
Table 2. PCR primers ... 18
ABBREVIATION
TBI; traumatic brain injury
hMSC; human mesenchymal stem cell CNS; central nervous system
NGF; nerve growth factor
BDNF; brain-derived neurotrophic factor NT-3; neurotrophin-3
VEGF; vascular endothelial growth factor bFGF; basic fibroblast growth factor FP; Fluid Percussion
CCI; Controlled Cortical Impact
ELISA; enzyme linked immunosorbent assay mNSS; modified neurological severity scores Trk; tyrosine kinase
I. INTRODUCTION
Traumatic brain injury (TBI) leads to secondary brain insults, which often result in permanent functional loss of the injured brain. However, there is no effective therapeutics to recover the functional loss of damaged brain tissues. To develop an effective therapeutics for human TBI, the development of an experimental model that resembles pathological and functional changes of human brain is critical. Compared to the fluid percussion (FP) model, the controlled cortical impact (CCI) model enables the physical adjustment of injury levels and has close pathological resemblance to actual human brain injury; thus, the CCI model has been frequently used for TBI models in animals. However, little is known about the severity of brain injury according to injury-induction parameters (Dixon et al., 1987; Dixon et al., 1991; Chen et al., 2003; Lacza et al., 2003., Lu et al., 2003; Mahmood et al., 2004).
Recently, there has been a rising interest in mesenchymal stem cells (MSCs) since they may have multiple therapeutic effects for several diseases. In addition to their ability to support hematopoiesis, MSCs have been shown to have the capacity to differentiate into osteocytes, chondrocytes, tenocytes, adipocytes, smooth muscle cells, and neuronal cells (Choong et al., 2007; Heino and Hentunen, 2008). MSCs can also secrete an array of growth factors and may have potential for central nervous system (CNS) repair (Chen et al., 2002; Li et al., 2002). Several studies have shown that transplantation of MSCs improves functional outcome in the rat TBI model. Many studies suggest that tissue regeneration by MSCs may not be the main source of functional recovery, since only a small proportion of transplanted MSCs appear to differentiate into neurons and astrocytes (Mahmood et al., 2001; Mahmood
et al., 2004).
In addition to cellular replacement, it has been proposed that an increased production of neurotrophic growth factors following administration of MSCs may be among the possible mechanisms of MSC-induced functional recovery. MSCs have been demonstrated to have the capacity to produce many kinds of trophic factors both in vitro and in vivo (Mahmood et al., 2001; Chen et al., 2005). Mahomood et al. demonstrated a significant improvement in the neurological function of rats with TBI following intravenous MSC transplantation compared to those without transplantation. This neurological improvement was preceded by increased production of nerve growth factor (NGF) and brain-derived neurotrophic factor (BDNF).
Neurotrophins, including NGF, BDNF and NT-3, are considered to play important roles in cell proliferation and survival during brain development (Bibel M et al., 2000), by activating related tyrosine kinase (Trk) receptors, TrkA, TrkB and TrkC receptor, respectively. Trk receptors stimulate Ras/ MAPK, and the phospatidylinositol 3-kinase (PI 3-K) /Akt and other related pathways (Bibel M et al., 2000). Indeed, BDNF induces phosphorylation of MAPK and Akt in neuroblastoma cells and hippocampal slices (Davis MI et al., 1999; Encinas M et al., 1999). Akt activation was modulated by growth factors, and treatment with nerve growth factor (NGF) reduced apoptotic cell death after ischemic injury (Pierchala BA et al., 2004; Saito A et al., 2004). Akt functions as a major downstream target of phosphatidylinositol 3-kinase (PI3-K), and after phosphorylation, it phosphorylates some substrates on the serine or threonine residues, including glycogen synthase kinase-3, Caenorhabditis elegans DAF-16 transcription factor, Bad, phosphodiesterase 3B, a Rab GTPaseactivating protein, ATP-citrate lyase, and the tuberous sclerosis complex 2 tumor suppressor gene product tuberin (Lizcano
JM et al., 2000; Berwick DC et al., 2002; Cantley LC et al., 2002; Kane S et al., 2002; Manning BD et al., 2002). Akt phosphorylation of the apoptosis-inducing protein Bad creates a binding site for 14-3-3 proteins and prevents Bad from binding to Bcl-2 family members Bcl-2 and Bcl-XL, thus releasing them for a cell survival response (Brunet A et al., 2001). The PI3-K pathway is involved in nerve growth factor (NGF)-dependent neuronal survival (Crowder RJ et al., 1998).
In this study, morphological changes and behavioral scores were measured after TBI in rats according to different impact velocities and depths of deformation; these parameters were further investigated to provide a guideline for establishing a TBI animal model. Using an established moderate TBI model (50 psi, 2.0 mm deformation), we studied the therapeutic effects of human mesenchymal stem cells in the TBI rat model. To understand the mechanisms responsible for therapeutic effects, we demonstrated that expression of neurotrophic growth factors was induced by MSC treatment. The fate of transplanted MSCs and expression of growth factors were examined through immunohistochemistry. In addition, the level of growth factors was measured quantitatively using enzyme-linked immunosorbent assay (ELISA). Furthermore, we observed an increase in phosphorylation of the cell survival-signaling molecule, Akt, followed by decreased caspase-3 activation. These results strongly suggest that therapeutic effects of hMSC transplantation may involve promotion of anti-apoptotic activity as a result of secreted growth factors.
II. MATERIALS AND METHODS
1. Animal model of TBI
Sprague-Dawley male rats (250–300 g) were anesthetized with isoflurane. Rectal temperature was maintained at 37°C throughout the surgical procedure, using a feedback-regulated water heating system. Rats were placed in a stereotaxic frame, and a craniotomy of 8 mm in diameter was performed adjacent to the central suture, midway between the lambda and bregma, and the dura was kept intact. TBI was induced by impacting the right cortex with a pneumatic piston using a 6-mm diameter tip at varying velocities and depths of compression. Velocity was measured with a linear velocity displacement transducer as described previously (Kim et al., 2007).
2. Impact velocity calibration
Analog signals of impact velocity with differing compressed air pressure (50 psi and 80 psi) were converted through linear variable differential transformer to digital signals and computed through the labscribe data acquisition software (CB Science, USA).
The displacement of piston was fixed at 5 cm. Impact velocity was calculated with changes in time ( t), depending on the impact rod position waveform by using the △ following formula:
* Average speed = (full displacement × 0.8)/Δt (sec) 4
Δt: 10% to 90% of the full amplitude Full displacement = 5 cm
3. Assessment of neurological function
We assessed neurological function of each animal using the rotarod motor test and the modified neurological severity score (mNSS) (Li et al., 2002; Lu et al., 2002; Riess et al., 2002; Fujimoto et al., 2004). For the rotarod motor test, rats were tested 3 days prior to TBI to obtain baseline values. After the rotarod training, the animals that ran perfectly for 5 min at 30 rpm were selected for the TBI model. The tests were performed on days 1, 2, 8, 15, 22 and 29 after TBI. The rotarod motor score after TBI was calculated as a percentage value of the pre-TBI value. In addition to the rotarod motor test, rats were evaluated using mNSS, which is a composite of motor, sensory and reflex tests (Li et al., 2002; Lu et al., 2002; Fujimoto et al., 2004). One point was given for failure to perform a task, or for the lack of a tested reflex with a maximum of 18 points (Table 1). mNSS was performed before TBI and then on days 1, 2, 8, 15, 22 and 29 after TBI.
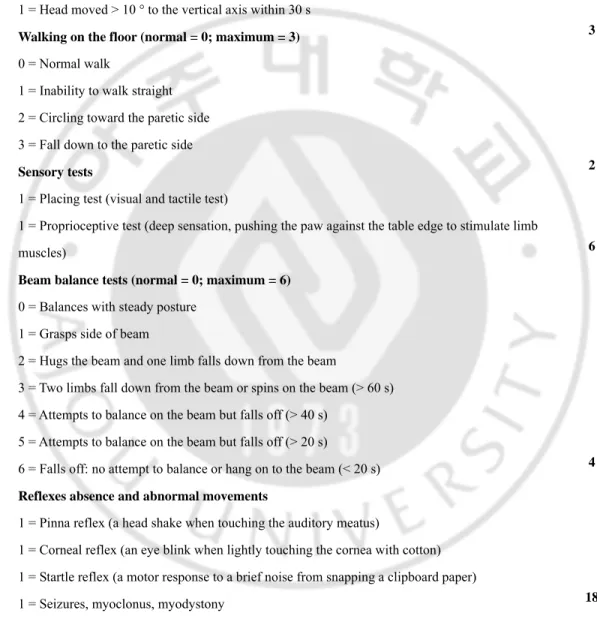
Table 1. Modified neurological severity scores (mNSS)
Motor tests Points
Raising the rat by the tail 1 = Flexion of forelimb 1 = Flexion of hindlimb
1 = Head moved > 10 ° to the vertical axis within 30 s Walking on the floor (normal = 0; maximum = 3) 0 = Normal walk
1 = Inability to walk straight 2 = Circling toward the paretic side 3 = Fall down to the paretic side Sensory tests
1 = Placing test (visual and tactile test)
1 = Proprioceptive test (deep sensation, pushing the paw against the table edge to stimulate limb muscles)
Beam balance tests (normal = 0; maximum = 6) 0 = Balances with steady posture
1 = Grasps side of beam
2 = Hugs the beam and one limb falls down from the beam
3 = Two limbs fall down from the beam or spins on the beam (> 60 s) 4 = Attempts to balance on the beam but falls off (> 40 s)
5 = Attempts to balance on the beam but falls off (> 20 s)
6 = Falls off: no attempt to balance or hang on to the beam (< 20 s) Reflexes absence and abnormal movements
1 = Pinna reflex (a head shake when touching the auditory meatus)
1 = Corneal reflex (an eye blink when lightly touching the cornea with cotton) 1 = Startle reflex (a motor response to a brief noise from snapping a clipboard paper) 1 = Seizures, myoclonus, myodystony
Maximum points 3 3 2 6 4 18
One point is awarded for the inability to perform the tasks or for the lack of a tested reflex. 13–18 = severe injury; 7–12 = moderate injury; 1–6 = mild injury.
4. Optical microscopic observation of preliminary laboratory animals
Three randomly selected rats were anesthetized with isoflurane and sacrificed one day after cortical injury (50 psi with 2 mm depth of deformation and 80 psi with 2 mm depth of deformation); afterwards, their pathological findings after cortical injury were observed. Blood was removed by perfusing PBS intracardially via aorta, and tissue proteins were fixed with 4% paraformaldehyde. The tissues were frozen, sectioned and stained with crystal violet.
5. Impact velocity and depth of deformation
Cortical injury was induced on six groups of rats (seven per group) with two sets of impact velocity (3.2 ± 0.1 m/s with 50 psi and 3.9 ± 0.1 m/s with 80 psi) and differing depths of deformation (1.5 mm, 2.0 mm and 2.5 mm). After 24 hours, behavioral scores were evaluated by performing rotorod motor test and measuring mNSS level, and forebrain was extracted.
Extracted forebrain was washed out with PBS for two minutes and sliced 2-mm thick by rat brain matrix. Each slice was then placed on a 6-well dish and stained with 1% 2,3,5-triphenyltetrazolium chloride monohydrate (Sigma Chemicals, USA) solution for 30 minutes (Shimamura et al., 2006). Morphological observation was performed after fixing with 4% paraformaldehyde.
6. Measurement of injured area
The injured areas of the hemispheric cortex and hippocampus were measured with different subsets of impact velocity and depth of deformation through quantification with Image J (freeware from the National Institutes of Health (http://rsb.info.nih.gov/ij/) (Kirton et al., 2007). Measurement, expressed in percentage, was performed by subtracting the preserved hippocampal or cortical area after injury in the ipsilateral hemisphere from the non-injured hippocampal or cortical area in the contralateral hemisphere.
Injured area in percentage = 100 – (preserved hippocampal or cortical area after injury
in the ipsilateral hemisphere / hippocampal or cortical area in the non-injured contralateral hemisphere x 100)
7. Isolation and preparation of hMSCs for transplantation
The hMSCs used in this study were supplied by FCB pharmicell (Seongnam, South Korea). hMSCs were prepared according to previously reported methods (Bang et al., 2005; Lee et al., 2008). Briefly, 5ml of bone marrow was aspirated from the posterior iliac crest of healthy human donor under local anesthesia. Bone marrow mononuclear cells were isolated by Ficoll density centrifugation. Mononuclear cells (1 10ⅹ 6/ml) were placed in a 175cm2 flask
(Falcon, Franklin Lakes, NJ) and were cultivated in low-glucose Dulbecco’s modified eagles’ medium (DMEM; Gibco-BRL, Grand Island, NY) containing 10% fetal bovine serum (Hyclone, Irvine, CA) and 1% penicillin/streptomycin (Sigma, St. Louis, MO) in a humidified
incubator at 37°C under 5% CO2. After 5 days, non-adherent cells were removed by replacing
the medium. Attached cells developed into colonies within 5 to 7 days. When these primary cultures of MSCs reached 80% confluence, the cells were harvested using 0.25% trypsin and subcultured.
Each harvest of MSCs had a homogenous population of cells with high expression levels of SH antigens (>93% of cells) and no expression of CD34, CD45, human leukocyte antigen-D related (HLA-antigen-DH), or class I human leukocyte antigen (data not shown).
The study protocol was approved by the Institutional Review Board for Human Investigation of Ajou University Hospital, Suwon, South Korea.
8. Experimental groups
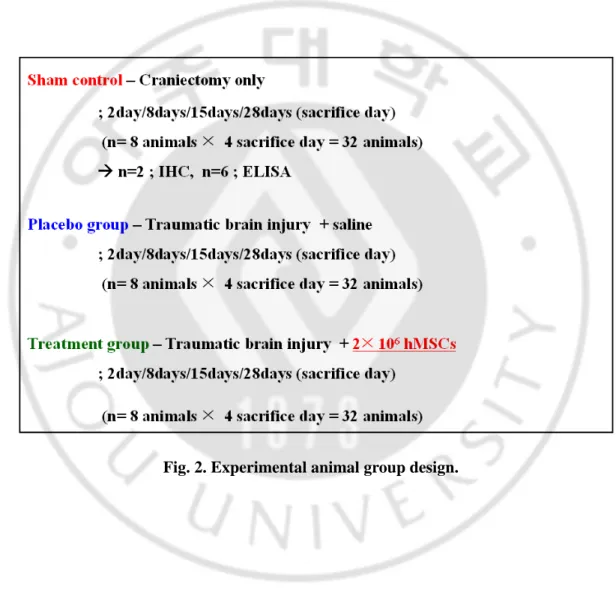
We prepared two sets of animals; the first set was used for neurological assessments, ELISA assays, and immunohistochemical staining, and the second set was used for western blot analysis. Animals were divided into 3 groups; sham control group (only craniotomy without TBI), placebo group (TBI followed by saline injection 24 hours later) and hMSC group (TBI followed by transplantation of hMSCs 24 hours later via tail vein injection). TBI was induced using CCI device with a pneumatic piston using a 6-mm diameter tip at a velocity of 3.2 m/sec and 2.0 mm of compression. The first set was further divided into 4 subsets according to the day of sacrifice (2, 8, 15 and 29 days after TBI) and the second set were divided into 2 subsets (2 and 8 days after TBI). Animals of each subset and each group were sacrificed after neurological assessment on the appropriate day after TBI. For the first
set of experiments, each experimental group with 8 animals per subset underwent TBI (total 96 animals). Among the subset of 8 animals, 6 animals were randomly selected for ELISA assays, and the remaining 2 were used for immunohistochemical studies. For the second set, 4 animals per subset were prepared as a control group (total 8 animals) and 6 animals per subset were prepared for either the placebo or hMSC groups (total 24 animals).
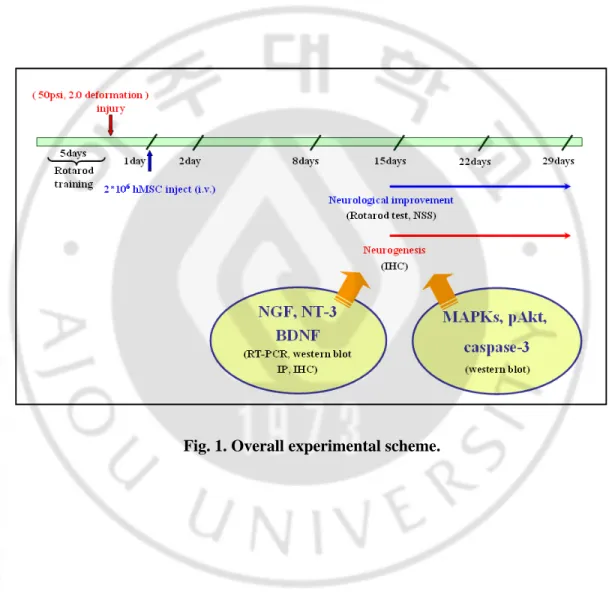
Animals were anesthetized with isoflurane 24 hours following TBI. Transplantation of hMSCs was performed by tail vein injection of 2×10⁶ hMSCs suspended in 500ul of saline.
For the placebo group, the same amount of saline was injected 24 hours after TBI (Fig. 1 and 2).
Fig. 1. Overall experimental scheme.
Fig. 2. Experimental animal group design.
9. Enzyme-Linked Immunosorbent Assay (ELISA)
Rats were anesthetized with isoflurane and were sacrificed at days 2, 8, 15 and 29 after TBI. The traumatized hemisphere was extracted and processed for ELISA assay as described by Chen et al. (Chen et al., 2002; Chen et al., 2005). Briefly, brain tissue was homogenized in DMEM and centrifuged at 1,000 rpm at 4°C. Supernatants were harvested for quantitative analysis of NGF, BDNF, neurotrophin-3 (NT-3), vascular endothelial growth factor (VEGF) and basic fibroblast growth factor (bFGF) levels using ELISA kits (R&D, USA, Minnesota). The ELISA was performed using a Titertek Multiskan MCC/340 plate reader (Labsystems, Helsinki, Finland).
10. Immunohistochemical evaluation
Animals for histological evaluation were sacrificed at 2 and 15 days following TBI. Brains were fixed in 4% paraformaldehyde. Immunostaining to identify hMSCs in the TBI rat brain was performed using mouse anti-human nuclei monoclonal antibody (1:1,000; Chemicon, MAB1281), and then washed with 0.1 M PBS and incubated in Alexa Fluor 488 goat anti-mouse lgG (H+L) secondary antibody (1:1,000; Molecular Probes, USA). Double staining to identify hMSCs that secrete growth factors was performed using human nuclei, NGF, BDNF and NT-3 antibodies (1:1,000; Santa Cruz, USA, California). Brain sections were incubated at 4°C overnight in a mixture containing the human nuclei primary antibody, MAB1281, and one of each of the growth factors as a counterpart. Alexa Fluor 488 or
conjugated secondary antibodies were used to visualize immunoreactivity. Sections were mounted using the Prolong kit (Molecular Probes) as an anti-fading mounting solution. Fluorescent immunoreactivity was investigated by confocal laser scanning microscopy (Zeiss LSM 510, Carl Zeiss).
11. Western blot analysis and Immunoprecipitation
11-1. Western blot analysis
Extracted brain tissue from traumatized hemispheres were homogenized in RIPA lysis buffer containing 1 ug/ml aprotinin, 10 ug/ml leupeptin, 1 mM sodium vanadate, and 1 mM phenylmethylsulfonyl fluoride. Protein expression of pAkt, cleaved caspase-3, pErk, p38 and Bcl-2 was detected using rabbit phospho-Akt (1:1,000, Cell Signaling), rabbit caspase-3 (1:1,000, Cell Signaling), mouse pErk (1:1,000, Cell Signaling), rabbit anti-p38 (1:1,000, Cell Signaling), and mouse anti-Bcl-2 (1:1,000, Stress Gen), respectively.
11-2. Immunoprecipitation
To enable the purification of neurotrophic factors, we used a method of immnuoprecipitation. The supernatant of brain extraction (500 ㎍, 800 ㎍ and 1 mg) was collected by centrifugation at 16,000 g for five minutes and incubated with or without an anti-NGF, BDNF and NT-3 antiserum or anti-rabbit IgG (3 ㎍/sample), respectively, for one hour at 4°C; this was followed by incubation with 30 μl of protein A-agarose (50% slurry) for another one hour. The immunoprecipitates were washed twice with ice-cold lysis buffer and resuspended in 80 μl lysis buffer. Each sample was resolved by 12% SDS polyacrylamide gel electrophoresis and then transferred to nitrocellulose membranes. The presence of NGF, BDNF and NT-3 were detected by anti-NGF, BDNF and NT-3, respectively.
11-3. pAkt expression in neurotrophins-treated PC12 cells
PC12 cells were cultured in Dulbecco's modified Eagle's medium (DMEM) supplemented with 10% fetal bovine serum (FBS; v/v), 50 U/ml penicillin and 50 μg/ml streptomycin at 37°C in humidified air with 7.5% CO2. PC12 cells were seeded in 6-well
plates at a density of 1×10⁵ cells/well in 3 ml of growth medium. Twenty-four hours later, the
cultures were stimulated with 100 ng/ml NGF for 2, 5 and 10 minutes and their cell lysates were analyzed for pTrkA (Tyr-490, Cell Signaling; Tyr 680/Tyr 681, Santa Cruz Biotechnology) and pAkt (Ser473, Cell signaling).
12. Determination of NGF, NT-3 and BDNF mRNA levels
12-1. RNA extraction
We used a RT–PCR procedure to evaluate the NGF, NT-3 and BDNF mRNA levels. Total RNA was extracted from brain tissue by use of RNeasy Mini kit (Qiagen). Briefly, according to the manufacturer’s instructions, the samples were lysed and homogenized in the presence of a highly denaturing guanidine isothiocynate-containing buffer which immediately inactivated RNases to ensure isolation of intact RNA ethanol was added to provide appropriate binding conditions, and the sample was then applied to an RNeasy minispin column where total RNA bound to the membrane and contaminants were efficiently washed away (Dupont et al., 2004). Finally, total RNA was eluted in 50㎕ diethylpyrocarbonate-treated water (DEPC). Total RNA concentration (㎍/㎕) was assessed spectrophotometrically.
12-2. Reverse transcription (RT)
2㎕ of total RNA stock was reverse transcribed in a 20㎕ total volume reaction using the following assay mixture: RT buffer (50 mM Tris–HCl, pH 8.5, 8 mM MgCl2 and 30 mM KCl), 20 units avian myoblastosis virus RT, 40 units RNase inhibitor (Roche), 2.5 μM primer p(dT)15 (Roche) and each 0.625 mM deoxynucleoside triphosphate (dNTP, Pharmacia). The
RT reaction was performed at 37 °C for 2 hr followed by denaturation for 5 min at 75 °C. The synthesized cDNAs were diluted in DEPC–water (Dupont et al., 2004).
12-3. PCR
2㎕ of the RT assay were amplified separately for the different sequences [glyceraldehydephosphate dehydrogenase (GAPDH), NGF, NT-3 and BDNF] in 20㎕ of the following PCR mixture: PCR buffer (50 mM Tris–HCl and 15 mM (NH4)2SO4), dNTPs (0.25 mM), 2.5 mM MgCl2, specific antisense and sense primers (0.2 AM) (Interactiva) and
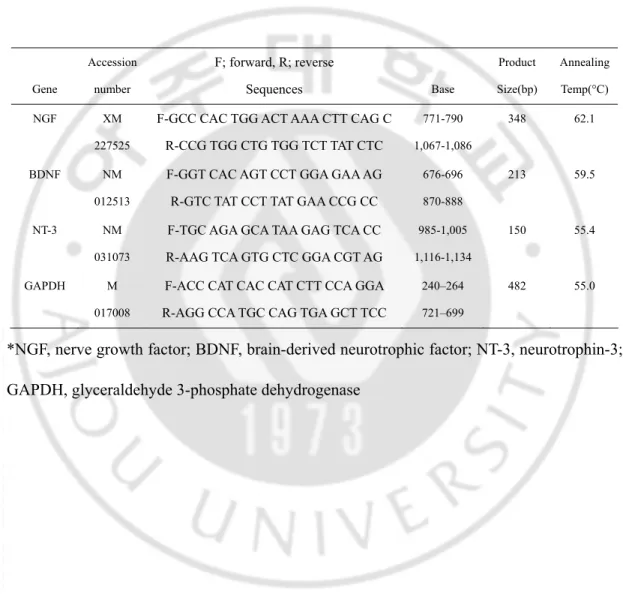
0.63 U of expand high-fidelity polymerase (Roche). The PCR product expected sizes are given in Table 2. The 5’-ends of sense primers were labeled with digoxigenin to allow chemiluminescence detection of the amplified products. The amplification steps involved denaturation at 94 °C for 30 s, annealing for 30 s at 55 °C with specific primers (Table 2.) and synthesis for 90 s at 72 °C. The number of cycles used to amplify each cDNA was chosen in the exponential phase of the PCR. Then GAPDH was amplified by PCR after 23 cycles. NGF, BDNF and NT-3 were co-amplified after 23 cycles in the same tube.
Table 2. PCR primers Gene Accession number F; forward, R; reverse Sequences Base Product Size(bp) Annealing Temp(°C) NGF XM 227525
F-GCC CAC TGG ACT AAA CTT CAG C R-CCG TGG CTG TGG TCT TAT CTC 771-790 1,067-1,086 348 62.1 BDNF NM 012513
F-GGT CAC AGT CCT GGA GAA AG R-GTC TAT CCT TAT GAA CCG CC
676-696 870-888
213 59.5
NT-3 NM 031073
F-TGC AGA GCA TAA GAG TCA CC R-AAG TCA GTG CTC GGA CGT AG
985-1,005 1,116-1,134
150 55.4
GAPDH M 017008
F-ACC CAT CAC CAT CTT CCA GGA R-AGG CCA TGC CAG TGA GCT TCC
240–264 721–699
482 55.0
*NGF, nerve growth factor; BDNF, brain-derived neurotrophic factor; NT-3, neurotrophin-3; GAPDH, glyceraldehyde 3-phosphate dehydrogenase
13. Statistical Analysis
For neurological function assessment, the score for all animals on corresponding days following TBI were collected and compared between experimental groups. The total number of animals was highest on day 1 or day 2 following TBI (n=32 per experimental group, total 96) since no animal was sacrificed on these days, whereas the number of animals on day 29 following TBI was the lowest (n=8 per each experimental group, total 32). We compared the neurological assessment scores of all animals at each day between placebo and hMSC group using a non-paired student’s t-test, and the expression levels of neurotrophic factors between all 3 experimental groups were compared using a one way ANOVA followed by a Duncan test. P values less than 0.05 were accepted as significant.
III. RESULT – PART A
1. Impact Velocity with Differential Compressed Air Pressure
The impact velocity was obtained through labscribe data acquisition software, with average values of 3.2 ± 0.1 m/s and 3.9 ± 0.1 m/s on 50 psi and 80 psi compressed air pressure, respectively.
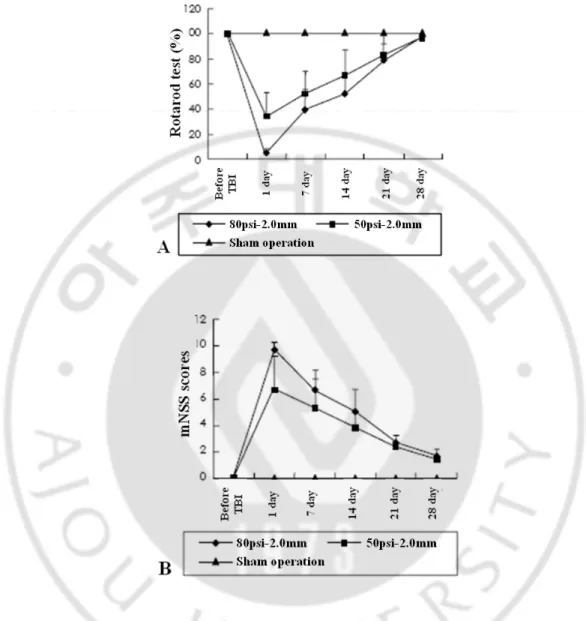
2. Changes in behavioral score after injury
In the three experimental groups, neurological behavioral scores were measured by performing rotorod motor test and mNSS test 1, 7, 14, 21 and 28 days after injury. As shown in Fig. 3, behavioral scores significantly decreased on day 1 in all TBI rats, and behavioral function started to improve from day 7. On day 28, behavioral score improved, almost to the level of the control group, in which craniotomy was only performed without brain traumatic injury. The animals in which TBI was induced with a velocity of 3.9 m/s showed more severe behavioral changes compared to those TBI-induced with a velocity of 3.2 m/s. However, the data is statistically invalid at this time due to the small number of tested animals.
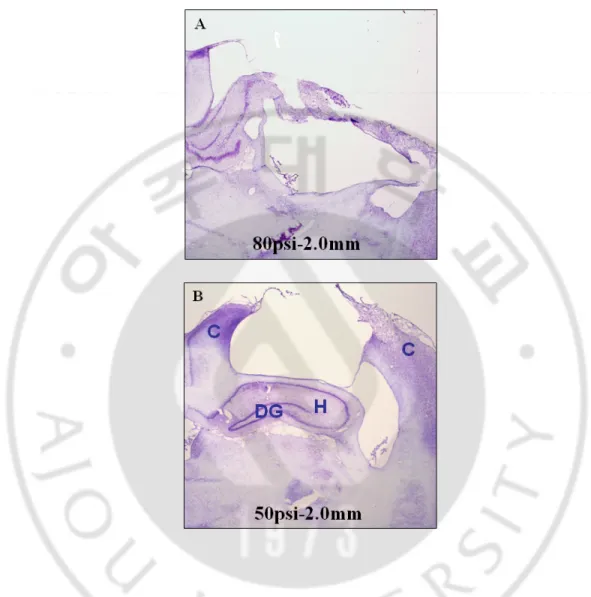
3. Optical microscopic observation
Crystal violet staining revealed that only cortical regions were damaged with 3.2 m/s of impact velocity and 2.0 mm of depth of deformation. However, with 3.9 m/s of impact velocity and 2.0 mm of depth of deformation, damage was extended to the hippocampus, dentate gyrus, hilus and thalamus regions (Fig. 4).
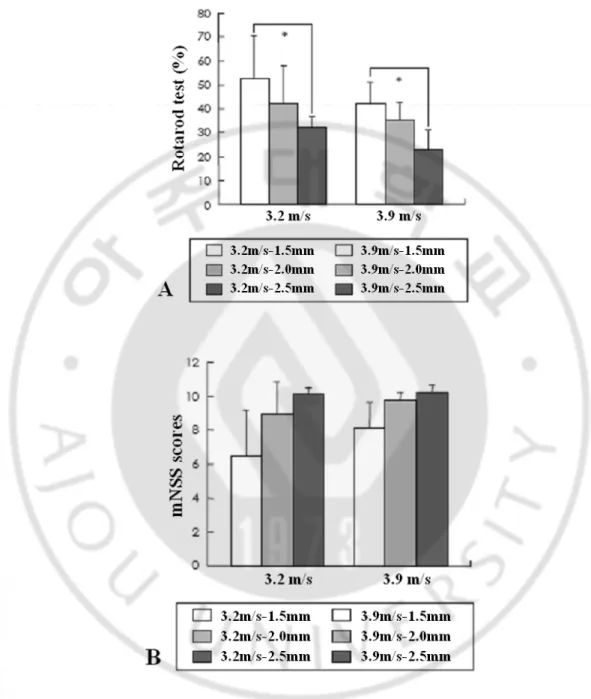
4. Changes in neurobehavioral scores according to varying impact velocities and depths of deformation
4-1. Rotarod motor test
With impact velocities of 3.2 m/s and 3.9 m/s, deformation was applied in various depths of 1.5 mm, 2.0 mm and 2.5 mm. Behavioral scores were measured one day after the injury, and percentage scores were 52.8%, 42.2%, and 32.4% on average with 3.2 m/s, and 41.7%, 35.2% and 22.8% with 3.9 m/s. Rotorod test results showed that the behavioral score percentage was significantly lowered under 2.5 mm depth of deformation compared to 1.5 mm depth of deformation (p<0.05, one-way ANOVA). However, injuries with different impact velocities under the same depth of deformation did not provide statistically significant results (Fig. 5).
4-2. Modified neurological severity score
With a given 3.2 m/s impact velocity, the depths of deformation were changed to 1.5 mm, 21
2.0 mm and 2.5 mm and their behavioral scores were 6.5, 9.0 and 10.1, respectively. Under the 3.9 m/s impact velocity condition, the scores were 8.2, 9.7 and 10.1, respectively. With fixed impact velocity, the scores were lower in higher depths of deformation, but were not statistically significant (Fig. 5).
5. Morphological change (TTC stain result)
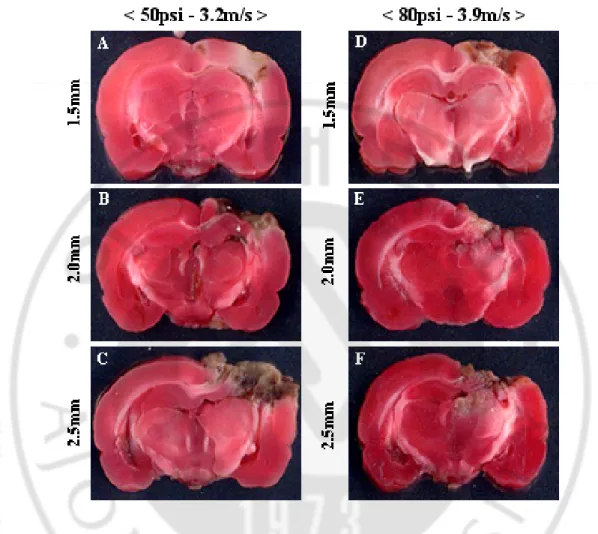
Brain specimen were stained with TTC and measured in the cortical area and hippocampal regions under each parameter by using Image J program (Fig. 6). In the cortical area, injury area percentages were 31.5%, 50.3% and 56.7% under 3.2 m/s impact velocity; under 3.9 m/s impact velocity, injury percentages were 38.9%, 54.0% and 61.2% (Fig. 7).
Given the same impact velocity, the cortical damage area was significantly increased in 2.0 mm and 2.5 mm depths of deformation compared to 1.5 mm depth of deformation. In the hippocampus, the damaged areas were at 36.7%, 44.1% and 83.9% with 3.2 m/s impact velocity and 47.0%, 85.9% and 96.7% with 3.9 m/s impact velocity.
With the same impact velocity, but different depths of deformation, the damaged areas of hippocampus were compared. In the case of 3.2 m/s impact velocity, slices from 2.5 mm depth of deformation only showed significant difference in the damaged area. Under 3.9 m/s impact velocity condition, groups with 2.0 or 2.5 mm depths of deformation showed significant increase in damaged areas compared to those with 1.5 mm depth (p<0.05, one-way ANOVA).
With the same deformation depth, damaged areas in the hippocampus according to 22
different impact velocities were compared. With 2 mm depth, 44.1% in 3.2 m/s and 85.9% in 3.9 m/s of hippocampal areas were damaged, and a significant increase in the damaged area was observed with higher impact velocity (p<0.05, independent samples t-test). There were no statistically significant differences in damaged cortical areas.
Fig. 3. Neurological changes after controlled cortical impact in the rat TBI model.
Various intensities of TBI were applied through different impact pressures of 50 and 80 psi and velocities of 3.2 and 3.9 m/s. The tests were performed after 1, 7, 14, 21 and 28 days after TBI. The rotarod motor score after TBI was calculated as a percentage value of the pre-TBI value.
Fig. 4. Pathological findings (cresyl violet stain) showing the different magnitude of brain injuries according to the different cortical impact pressure (velocity). Rats were
anesthetized with isoflurane and sacrificed one day after cortical injury (50 psi with 2 mm depth of deformation and 80 psi with 2 mm depth of deformation); then, pathological changes were observed after cresyl violet staining of tissue sections. C: cerebral cortex, H: hippocampus, DG: dentate gyrus (40×magnification)
Fig. 5. Results of neurobehavioral tests (A: Rotarod motor score, B: mNSS) 1 day after TBI according to the various injury parameters. *p< 0.05 in one-way ANOVA Turkey
and Duncan method. mNSS: modified neurological severity score, TBI: traumatic brain injury, ANOVA: analysis of variance
Fig. 6. 2,3,5-triphenyltetrazolium chloride monohydrate (TTC) staining findings. TTC
staining 1 day after TBI showed the different magnitudes of tissue injury according to various injury parameters (coronal section with 2-mm thickness). Extracted forebrain was washed out with PBS for two minutes and sliced 2-mm thick by rat brain matrix. Each slice was then placed on a 6-well dish and stained with 1% 2,3,5-triphenyltetrazolium chloride monohydrate (TTC) solution for 30 minutes. Morphological observation was performed after fixing with 4% paraformaldehyde.
Fig. 7. The ratio of injured volume of ipsilateral cortex and hippocampus compared to contralateral structures at various injury parameters. The volume was measured using
Image J freeware from the National Institutes of Health (http://rsb.info.nih.gov/ij/). A: Cerebral cortex. B: Hippocampus. *p<0.05 between different deformation depths with the same impact velocity in one-way ANOVA and Duncan method, †p< 0.05 between different impact velocities with the same deformation depth in an independent samples t-test. ANOVA: analysis of variance.
III. RESULT – PART B
1. Neurological function improved significantly in rats with TBI that received hMSCs treatment
In the sham control group, there was no evidence of neurological impairment during the experimental period. Rotarod motor scores in the placebo and the hMSCs groups dropped to 28.9% and 31.3% of the scores in the sham control group, respectively, at day 1 following TBI. The score in the hMSCs group started to improve at 2 days after TBI and showed a significant improvement from 15 days after TBI until the last day of the experimental period (day 29) when compared to the placebo group (Fig. 8A). Consistent with this, a significant improvement in the mNSS scores was detected in the hMSC group compared to the placebo group from day 15 after TBI until day 29 (Fig. 8B). These data clearly demonstrate a therapeutic effect of hMSCs in an animal model of TBI, which corroborates previous observations by other groups (Mahmood et al., 2001; Li et al., 2002).
2. Transplanted hMSCs migrated to perilesional area
To confirm whether hMSCs could migrate into injury site, immunohistochemical staining was performed using human nuclei specific antibody. Immunohistochemical
Fig. 8. Graph demonstrating rotarod motor scores and mNSS at different time points between the three experimental groups: the sham control group (only craniotomy without TBI), the placebo group (TBI followed by saline injection 24 hours later) and the hMSC group (TBI followed by transplantation of hMSCs 24 hours later). *; P <0.05
when comparing the placebo and hMSC groups
staining using the anti-human nuclei monoclonal antibody (MAB1281) demonstrated that positive cells representing transplanted hMSCs migrated to the perilesional site of impact at day 2 following TBI (1 day after transplantation of hMSCs). However, the number of positive cells had decreased markedly by day 15 following TBI (Fig. 9).
3. Minor portion of transplanted hMSCs differentiated into neuronal or glial cells
To observe whether transplanted hMSCs were differentiated into neuronal or glial cells, we also assessed the differentiation of hMSCs by fluorescent immunohistochemical staining of neuronal cell marker, NeuN, or astrocyte marker, GFAP. Minor fraction of MAB1281- positive cells were co-stained with NeuN or GFAP in the perilesional area at day 8 after TBI (Fig. 10 and 11).
Fig. 9. Migration of transplanted hMSCs at different time points. Photomicrographs
show the fluorescent staining for MAB1281, a marker for human nuclei, in the boundary zone of region area 2 and 15 days after TBI (Counterstained with DAPI).
Fig. 10. Neuronal cell differentiation of transplanted hMSCs 15 days after TBI. Double
immunofluorescence staining revealed that MAB1281 positive cells (FITC, green) were reactive for NeuN (CY3, red).
Fig. 11. Astrocyte differentiation of transplanted hMSCs 15 days after TBI. Double
immunofluorescence staining revealed that MAB1281 positive cells (FITC, green) were reactive for GFAP (CY3, red).
4. Tissue levels of NGF, NT-3 and BDNF were significantly increased in the hMSC-treated group
Since many neurotrophic factors have been reported to protect neural cells from cell death (Pierchala et al., 2004; Saito et al., 2004), we next addressed whether there were altered levels of neurotrophic factors in our experimental system, by employing quantitative ELISA on tissue extracts. Indeed, the levels of NGF in the hMSC group was remarkably increased at day 2 following TBI compared to the placebo group, and sustained a significant increase until day 8 after TBI, after then its expression decreased to levels observed in the placebo group (Fig. 12A). There were no significant differences in NGF levels between sham control and placebo groups during the experimental period. Therefore, induction of NGF seemed to be dependent on hMSC treatment.
In contrast, BDNF levels displayed a different pattern. Levels of BDNF were significantly increased in the placebo group compared to that of sham control group at day 2 following TBI, suggesting that BDNF expression was induced by TBI. Treatment with hMSCs further enhanced expression of BDNF at day 2 (Fig. 12B). However, during the remaining experimental period, BDNF levels were not significantly different between the 3 experimental groups.
The expression pattern of NT-3 was similar to that of BDNF, albeit with clearer differences of NT-3 levels between the 3 experimental groups. NT-3 levels were induced by trauma and were further enhanced by treatment with hMSCs at days 2, 8 and 15 after TBI (Fig. 12C). Similar to the pattern observed with NGF and BDNF, the expression of NT-3 in
Fig. 12. In vivo levels of cytokines measured in the traumatized cerebral hemisphere extracts using ELISA . Bar graph showing the in vivo levels of NGF (A), BDNF (B), NT-3
(C), VEGF (D) and bFGF (E) measured in the traumatized cerebral hemisphere extracts using ELISA. Neurotrophic factors are expressed along the horizontal axis (pg/mL). *; P <0.05 between the hMSC group and all others, # ; P <0.05 when comparing the placebo and sham control groups.
the hMSC group was highest at day 2 following TBI and showed a decreasing trend.
In contrast to the trophic factors already described that demonstrated increased levels after treatment with hMSCs, levels of VEGF and bFGF were not significantly changed by hMSCs treatment during the experimental period. However, there was an obvious induction of VEGF and bFGF by TBI (Fig. 12D, E). Collectively, the data suggest that hMSCs treatment increased expression of NGF, BDNF and NT-3, but not expression of VEGF and bFGF. However, since the ELISA systems we used could not delineate between human and rodent growth factors, the origin of the growth factors measured could either be from hMSCs or rat brain cells.
5. A little increased concentration of NGF in hMSCs culture medium
To assess NGF production of hMSCs, we tried to measure in vitro NGF concentration in hMSCs culture medium using enzyme-linked immunosorbent assay (ELISA). The results showed that hMSCs secreted little NGF and secretions were not significantly different compared to those of PC12 cells and 293T cells (Fig. 13).
Fig. 13. Enzyme-linked immunosorbent assay (ELISA) of nerve growth factor (NGF) protein in media from human mesenchymal stem cells cultures. Value was mean ±SD
from three different wells. Cell cultures were composed of 2x10³ hMSCs, 4x10³ hMSCs,
4x10³ PC12 cells and 4x10³ 293T-cells in 24-well plates; then, the culture media were
collected 1, 4 and 7 days in vitro. Using ELISA, NGF concentration was measured in each cell line. The hMSCs secreted a little NGF but did not significantly augment NGF compared to other cell lines (PC12 cells and 293T-cells).
6. Transplanted hMSCs migrated to the perilesional area and secreted growth factors
To investigate whether the observed increased levels of NGF, BDNF, and NT-3 were produced by hMSCs, we performed double staining with MAB1281 and antibodies against each growth factor. As shown in Fig. 14, the majority of MAB1281-positive cells in the hMSCs-treated group were positive for either NGF, BDNF or NT-3 in the perilesional area at day 2 after TBI (Fig. 14). Although the antibodies employed can detect both human and rat antigens, it is plausible to suggest that the increased neurotrophic growth factors were secreted from also transplanted hMSCs.
Fig. 14. Immunohistochemical staining of cytokines two and 15 days after TBI. Double
staining of Mab1281 (red) with NGF (green), BDNF (green), and NT-3 (green) two and eight days after TBI demonstrated that transplanted hMSCs express neurotrophic factors (X 80 in magnification, (Blue; counter-staining with DAPI).
7. Relative expression of neurotrophin mRNA in traumatized rat brain
Because of wide individual variances, there were no significant differences in NGF, NT-3 and BDNF mRNA levels among the three experimental groups (Fig. 15).
8. Detection of growth factors in protein level (western blot and immunoprecipitation)
When we did western blot analysis for each growth factor, we could not detect mature growth factors in all groups. Detectable protein volume was barely 0.3 ng when respective recombinant protein was loaded by western blot analysis (Fig. 16). In ELISA, NGF, NT-3 and BDNF were significantly increased 2 days after TBI in the hMSCs treated group, but the amount of growth factors was not detectable by western blot analysis. To increase the quantity of loading sample, immunoprecipitation was performed with samples of 0.5, 0.8, 1 mg that were binding with growth factor. Each protein was purified with agarose beads. Though total loading samples were increased to 0.5, 0.8 and 1 mg, expression of growth factors were not detected yet.
Fig. 15. Neurotrophin mRNA expression in injured rat brain. NGF, BDNF and NT-3
mRNA levels were determined by RT-PCR. NGF and BDNF mRNA expression levels in brain extraction were expressed as percentages of control (sham operation group). Data was analyzed using a one-way ANOVA followed by a Duncan test. Significance was assumed if the P value was <0.05 (* ; between TBI+MSCs and the others).
Fig. 16. Detection of NGF, BDNF and NT-3 using western blot analysis and immunoprecipitation. A: Expression of NGF was detected dose-dependently using NGF
recombinant protein (10, 3, 1 and 0.3 ng). B: The supernatant of brain extraction (500 ㎍, 800 ㎍ and 1 mg) was collected by centrifugation at 16,000 g for five minutes and incubated with or without an anti-NGF, BDNF and NT-3 serums or anti-rabbit IgG (3 μg/sample). Lane 1; positive control (respective recombinant protein), lane 2; RIPA buffer only (no samples), lane 3; brain extraction (500 ug), lane 4; brain extraction (800 ug), lane 5; brain extraction (1 mg). Each sample was resolved with 12% SDS polyacrylamide gel electrophoresis and then transferred to nitrocellulose membranes. The presence of NGF, BDNF and NT-3 were detected by anti-NGF, BDNF and NT-3 serums, respectively.
9. Detection of receptor on growth factors
Since we could not detect the expression of NGF, BDNF, NT-3 using western blot and immunoprecipitation, we studied the receptor activation by neurotrophin stimulus. Neurotrophin signaling occurs through the Trk receptor tyrosine kinases (TrkA, TrkB, and TrkC) and the low-affinity neurotrophin receptor p75. Although all neurotrophins bind to p75 with similar affinity, Trk receptors display selectivity toward different neurotrophins (Wan J et al., 2008; Fig. 17). Since only the pTrkA antibody, known as a receptor of NGF, is commercially available, western blot analysis was performed with pTrkA. We used 100 ng/ml NGF-treated PC12 cells to form a positive control group, which was known to activate TrkA at an early time point and also was reported to activate AKT downstream pathway (Annerén C et al., 2000; Woronowicz A et al., 2008).
Western blot was performed with pAKT and pTrkA after PC12 cells were treated with 100 ng/ml NGF in 2, 5, 10 minutes. While pAKT expression level was significantly increased in two and five minutes, pTrkA expression could not been detected (Fig. 18).
Fig. 17. TrkA signaling pathway. (A) Journal of Neurochemistry, 2006 (97):222 –233, (B)
Nature, 2004 (427): 843-848
Fig. 18. Western blot analysis of pAkt and pTrkA in the presence of PC12 cells and rat brain. A: Western blot analysis of extracts from PC12 cells, untreated or NGF-treated (100
ng/ml), normal rat brain using Phospho-TrkA (Tyr490) antibody from cell signaling. Lane 1; PC12 cells untreated, lane 2~4; NGF-treated (100 ng/ml) 2, 5 and 10 minutes, lane 5; normal rat brain extracts. B: Western blot analysis of extracts from PC12 cells, untreated or NGF-treated (100 ng/ml), normal rat brain using Phospho-TrkA (Tyr 680/Tyr 681) antibody from Santa Cruz Biotechnology. Lane 1; NGF-treated (100 ng/ml) 10 minutes, lane 2; normal rat brain extracts (50 ug), lane 3; normal rat brain extracts (100 ug).
10. Up-regulation of pAkt and reduced caspase-3 cleavage in the hMSCs-treated group
pERK and pAkt are members of well-known cell survival signaling pathways (Encinas et al., 1999; Saito et al., 2004). To determine which signaling pathway was responsible for the beneficial effects induced by the growth factors, we analyzed levels of pERK and pAkt in tissue lysates. As shown in Fig. 19, while pERK levels were not significantly different between the three groups, levels of pAkt were clearly increased at day 2 following TBI in the hMSC group compared to placebo and sham control group, coinciding with the time-point at which tissue levels of NGF, BDNF, and NT3 were highest. pAkt levels had returned to basal level by day 8 after TBI. We also looked at activation of the MAPK’s, p38 and JNK; phosphorylation levels of p38 and JNK were not significantly different between the 3 groups (Fig. 19 and data not shown). In addition, in concordance with the in vivo experiment, we observed phosphorylation of Akt when PC12 cells were treated with 100 ng/ml NGF for 5 min (Fig. 18). Collectively, these results suggest that the neurotrophic factors secreted by hMSCs (NGF, BDNF and NT-3) may mediate activation of cell survival mainly through activation of the AKT signaling pathway.
Notably, the cleaved form of caspase-3, an effector of apoptosis (Fig. 20), was increased in both the hMSCs and placebo groups compared to the sham control group at day 2 after TBI. Caspase 3 cleavage was significantly decreased at day 8 after TBI only in the hMSC group (Fig. 21). After this time point functional recovery was observed in the hMSC group compared to the placebo group (Fig.8). We hypothesize that the increased functional
recovery observed in the hMSC group during the late time points after TBI is due to the reduction in caspase-3 cleavage observed at day 8. We also examined expressions of further pro- and anti-apoptotic proteins such as Bcl-2, Bcl-xL, and Bax, however, no changes in expression were observed in any of the groups (Fig. 21 and data not shown).
Fig. 19. Effects of hMSC transplantation on MAPK and pAkt expression after TBI.
pAkt was transiently increased at day 2 after TBI in hMSC treated group (lane 9-12) compared to sham control (lane 1-4) and placebo group (lane 5-8), and returned to basal level at day 8 after TBI. Lane 13(+); positive control of pAkt (rhabdomyosarcoma cells treated with HGF).
Fig. 20. Inhibition of apoptosis pathway. The PI3K pathway, activated by many survival
factors, leads to the activation of Akt, an important player in survival signaling. Activated Akt inhibits the pro-apoptotic Bcl-2 family member Bad, Bax, caspase-9, GSK-3 and FoxO1 by phosphorylation. Many growth factors and cytokines induce anti-apoptotic Bcl-2 family members (Rong and Distelhorst, 2008; Zakeri and Lockshin, 2008).
Fig. 21. Effects of hMSCs transplantation on caspase-3 and Bcl-2 expression after TBI.
The expression of cleaved caspase-3 increased in both the hMSC and the placebo groups compared to the sham control group at day 2 after TBI. However, cleaved caspase-3 significantly decreased only in hMSC group at day 8 after TBI.
IV. DISCUSSION – Part A
Traumatic brain injury (TBI) is induced by many mechanical factors that lead to primary cellular damages followed by secondary pathological reactions, including changes in brain blood flow, focal or systemic inflammation, oxygen-carrying capacity and cellular metabolism (Ray et al., 2002). Due to the complex pathology of TBI, there are significant difficulties in establishing animal models that have resemblance to TBI in humans (Fujimoto et al., 2004). Among many known animal models, controlled cortical impact (CCI) model has an advantage in controlling parameters that induce cortical injury. However, the degrees of damages, expressed quantitatively, with CCI-induced brain injury have not been previously determined. In this study, reproductive, functional and morphological assessments of traumatic injury in animal model were studied with variable parameters.
In the CCI model, the most critical factor for brain injury is the impact velocity and depth of deformation (Choi SM et al., 2002). In most laboratory animal models, 3 m/s or 4 m/s of impact velocity and 2.0 mm depth of deformation were frequently used. In this study, we used 50-psi compressed air pressure which gives rise to 3.2 ± 0.1 m/s as preliminary experiment and 80 psi for 3.9 ± 0.1 m/s with 2 mm depth of deformation for inducing traumatic brain injury. From day 1 after injury, injury intensity using rotorod motor scoring was measured at regular intervals for 4 weeks. Due to the different characteristics of tested animals, the preliminary results were statistically invalid; however, decrease in rotorod motor score was observed with higher impact velocity. Morphological studies performed through crystal violet staining exhibited that the damaged area was only localized in the cortex with
lower air pressure, but it was extended to dentate gyrus of hippocampus with higher air pressure. Hence, we evaluated motor and behavioral scores after the induction of brain injury with variable impact speed and deformation depth.
Rotorod motor score and level of mNSS exhibited statistically valid results in 1.5 mm and 2.5 mm depths of deformation with 3.2 m/s and 3.9 m/s impact velocities.
The damaged cortical areas with 2.0 mm and 2.5 mm depths (with given impact velocities of 3.2 m/s and 3.9 m/s) exhibited significant differences compared to 1.5 mm deformation depth. Hence, to make the animal model with different degrees in cortical injury, it would be advisable to use 1.0 mm or greater difference in depth of deformation with 3.2 m/s (50 psi) or 3.9 m/s (80 psi) impact velocity.
In 2.0 mm depth, the size of damaged cortical area was positively correlated to the impact velocity (44.1 ± 17.3% with 3.2 m/s and 85.9 ± 8.3% with 3.9 m/s). Patients with severe TBI frequently experience cognitive disorders including memory loss and judgment disturbance. In experimental animals, Moris water maze test and allothetic place avoidance task were previously performed to evaluate the change in cognitive function and memory after inducing brain injury in hippocampus (Sanders MJ., 1999; Cimadevilla JM et al., 2001; Fujimoto ST et al., 2004; Vafaei AA et al., 2004). Sanders et al. performed Moris water maze tests on mild and severe form of TBI animals and concluded that severely brain injured animals took prolonged period of time to find a platform in the water maze. In our study, we could not measure memory impairment to assess the degree of hippocampal injury.
However, based on the results of the morphological study, we suggest that more than 2.5 mm depth of deformation for 3.2 m/s impact velocity and more than 2.0 mm for 3.9 m/s are
required to induce sufficient hippocampal destruction. Moreover, at least 2.0 mm depth with variable impact velocity is required to differentiate the degree of damages in the hippocampus.
IV. DISCUSSION – Part B
Several investigators have shown therapeutic effects of MSCs or neural stem cells (NSCs) in animal models of TBI (Chen et al., 2002; Mahmood et al., 2004; Chen et al., 2005), with the transplanted stem cells surviving until 13 weeks after transplantation and differentiating into neurons or astrocytes during this time (Mahmood et al., 2001, Mahmood et al., 2004). However, the fraction of stem cells reported to differentiate into neurons and astrocytes following tranplantation is not large enough to replace damaged tissue. On the other hand, functional recovery in animals with TBI has been reported to occur from 1 to 2 weeks after stem cell transplantation, suggesting that stem cells may act through other modes of action (Li et al., 2002; Fujimoto et al., 2004). Our present study revealed that functional improvement of TBI animals treated with hMSCs was apparent at day 15 after TBI (14 days after transplantation) compared to the placebo group. In addition, immunohistochemical data demonstrated that transplanted hMSCs had migrated to the perilesional area as soon as day 2 after TBI, but relatively few hMSCs differentiated into neurons and astrocytes. Therefore, it is hard to reconcile that the functional improvement observed resulted from cell replacement by the stem cells transplanted. For that reason many investigators have suggested other effects of stem cell transplantation, such as alteration of environmental conditions in the injured brain through production of neurotrophic factors.
Since MSCs have been demonstrated to produce a wide array of trophic and growth factors both in vivo and in vitro (Chen et al., 2002; Chen et al., 2005), a more reasonable explanation for the functional benefit derived from MSCs treatment might be that these cells
produce neurotrophic factors that protect from damage or activate endogenous restorative mechanisms within the injured brain.
In an effort to investigate the mechanism by which hMSCs induce functional recovery following TBI, we tested the hypothesis that transplantation of hMSCs into the CNS produces and/or stimulates the production of neurotrophic factors, which in turn account for the hMSC-associated recovery from neuronal injury in animal model systems. Thus, we measured expression of growth factors in brain extracts using ELISA. The results revealed a significant increase in tissue expression of NGF and NT-3 at day 2 and day 8 following TBI and of BDNF at day 2 following TBI in the hMSC group compared to the placebo group (p < 0.05). The increased expression induced by hMSCs reached a peak before functional improvement was observed. Expression gradually decreased over time and was followed by a significant functional improvement. To check for confirmation in protein level, we did western blot analysis but could not observe any positive band (data not shown). It might be that the amount of positive recombinant protein was not of detectable quantity. Loading 1 ng positive recombinant protein became detectable but loading less than 0.3 ng positive recombinant protein did not. Therefore, we thought that the amount of mature growth factor in our brain extraction was not of detectable levels. Many reports showed NGF protein, measured by ELISA, has little or no mature NGF detected in mouse, rat, and human brains (Fahnestock M et al., 2001).
Neurotrophic factors have a well-established role in the survival, differentiation, and function of CNS neurons. For example, exogenous NGF, plays a critical role in neuronal plasticity, regenerative capacity, and prevention of neural apoptosis after TBI (Pierchala et
al., 2004; Saito et al., 2004). Moreover, BDNF can enhance the differentiation of neural precursor cells (Vicario-Abejón et al., 2002; Barnabé-Heider and Miller, 2003) and may be useful as a therapeutic agent for CNS injuries, such as spinal cord injury (SCI), by protecting neurons and inducing differentiation of neural stem cells at sites of damage.
Similarly, BDNF is known to play a key role in cell survival and differentiation in the CNS, and is also implicated in axonal regeneration, synaptic formation, and synaptic plasticity (Encinas et al., 1999; Coumans et al., 2001). Several studies have demonstrated that NT-3 supports the survival of injured CNS neurons in vitro and in vivo and induces neurite outgrowth (Bregman et al., 2002; Coumans et al., 2001). In the present study, we have demonstrated by ELISA that NGF, BDNF and NT-3 levels were increased at an early stage after transplantation. To assess NGF production of hMSCs, in vitro NGF concentration in hMSC culture medium was measured using enzyme-linked immunosorbent assay (ELISA). However, hMSCs secreted little NGF and secretion was not significantly different compared to PC12 cells and 293T cells. This finding showed that hMSCs could augment some neurotrophins by influencing the brain environment.
We also attempted to confirm the increased tissue expressions using western blot analysis. However, we failed to detect expression of mature growth factors in all groups. This may be due to the lower sensitivity of western blot analysis compared to that of ELISA. While many studies have demonstrated expression of NGF protein by ELISA, little or no mature NGF is detected in mouse, rat and human brains by western blot analysis (Fahnestock et al., 2001).
AKT activation has been demonstrated to be modulated by growth factors, and to 57
prevent apoptotic cell death in several cell types including neurons (Encinas et al., 1999; Pierchala et al., 2004). In the present study, expression of pAkt in the hMSC group was significantly increased at day 2 after TBI and had returned to basal levels by day 8. We next examined cleaved caspase-3 expression by western blot to determine whether pAkt was involved in regulation of apoptosis. We found that expression of cleaved caspase-3 was increased at day 2 after TBI in both the hMSC group and the placebo group but had decreased by day 8 only in hMSC group. Taken together, our data collectively suggest that increased production of NGF, BDNF and NT-3 induced by hMSCs transplantation leads to activation of the Akt pathway. Increased AKT activity is accompanied by decreased caspase-3 cleavage which subsequently results in the rapid functional recovery of the hMSC-treated group.
V. CONCLUSION
Part A
1. Destruction of anatomical structures and decrease of neurological behavior score were observed with varying impact velocities and variable depths of deformation by physical force exertion on cortical areas.
2. With higher impact velocity and longer depth of deformation, the degree of anatomical destruction was significantly increased.
3. To classify the level of brain injury, the difference of deformation depth requires 1 mm or greater difference with 3.2 m/s (50psi) or 3.9 m/s (80 psi) impact velocity.
4. At least 2.0 mm of deformation depth is required to establish a severe TBI experimental model by generating traumatic injury to the hippocampal region.
Part B
1. There was statistically significant improvement in rotarod motor scores as well as mNSS scores 15 days after TBI in the hMSC-treated group compared to the control group.
2. We observed that in vivo expression of brain-derived neurotrophic factor (BDNF), nerve growth factor (NGF), and neurotrophin-3 (NT-3) were significantly increased in hMSC-treated group compared to the control group during the early period after TBI.
3. IHC findings also showed that the expression level of BDNF, NGF, and NT-3 were higher at the earlier period (1 day) after hMSC treatment compared to the later period (14 days).
4. Increased AKT activity was followed by decreased caspase-3 cleavage which subsequently resulted in the rapid functional recovery of the hMSC-treated group.