† Phirada Phutichaiwibon : 정회원,한국철도기술연구원, 철도환경연구실, 선임연구원 E-mail : [email protected]
TEL : (031)460-5376 FAX : (031)460-5279
* 정회원, 한국철도기술연구원, 철도환경연구실, 선임연구원 ** 정회원, 한국철도기술연구원, 철도환경연구실, 책임연구원
Embodied Energy and CO
2Emissions Evaluation for Freight Transport
프티차이위본 피라다† 이철규* 김용기**
Pruitichaiwiboon, Phirada Lee, Cheul-Kyu Kim, Young-Ki
ABSTRACT
This study aim at demonstrating the environmental performance of freight transport of the rail and road mode through an indicator of embodied energy and CO2 emissions.
Using the concept of LCA, the scope of evaluation includes energy production, supply chain activity and operation. The results of embodied energy and CO2 emissions are normalized by
means of traffic volume. The results shown that embodied CO2 emissions road mode is 607.07
gCO2-eq./ tkm and 284.67 g CO2-eq./tkm for road and rail mode, respectively. This number
reveals that road mode is 2.1 times larger than rail mode. The results also indicate that the main contribution of CO2 emission from road mode is in the operation stage, which accounts for
70%; however, it is the construction and supply chain stage that accounts for over 50% of the emission of rail mode.
1.Introduction
In order to provide a clear and complete picture of energy consumption and GHG emission for rail and road transport, activities related to energy-GHG from the supply chains of both systems should be evaluated. Life cycle assessment (LCA) is an acceptable tool for performing this assessment. This method requires specific and detailed data on target product or service from cradle to grave. Since rail and road transport are composed largely of parts, materials and processing, it is not easy to gather all data. To cope with this problem, input-output analysis, which is the only method and database available now for calculating life cycle energy and GHG emission of transportation in a consistent and integrated way, is applied. The contributions of many researchers have extended the input-output framework incrementally in the direction of employing physical units particularly material and energy flows for the area of transport [1,2,3,4,5]. The objective of this paper is to investigate the net energy consumption and GHG emission of freight on rail and road transport. Input-output analysis is the approach of this work. The economic activities of rail and road transportation of the year 2005, including freight traffic volume [6,7,8], are set as the functional unit of energy and CO2 emission calculation.
2.Methodology
2.1Goal, scope and system boundary
The goal of this study is to evaluate the energy and GHG emission of Korea’s rail and road transportation economic activities. The scope includes energy production, supply chain activity and transportation activity. End of life management is not included due to lack of sufficient technical
data. The economic activities of rail and road transportation of the year 2005, including passenger and freight traffic volume, are set as the functional unit of energy and CO2 emission
calculation.
2.2 Embodied energy estimation
Embodied energy is the sum of direct and indirect energy. Direct energy is the amount of energy required to process for industrial activity, while indirect energy is determined as the amount of energy required to operate a given energy production system.
2.3 Embodied CO2 emissions
Since the energy indicated by direct and indirect consumption can becalculated, a vector of embodied CO2 can be obtained. By doing so, the energy output is multiplied by a vector of CO2
equivalent per TOE unit of each fuel. The emission factors of CO2, CH4, and N2O for CO2
equivalent (eq.) for each fuel type mainly refer to the 2006 IPCC guidelinestationary and mobility combustion. To be able to calculate the equivalent of CO2, the GWP100 factors for
characterizing the climate gases of CH4 and N2O are identified. ISO and IPCC [9], the GWP100
factors applied in this study are 21 and 310 kg CO2/kg, respectively.
3.Application and Results
3.1 Analysis of energy consumption
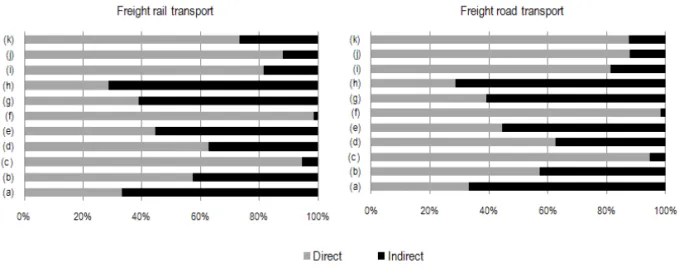
Life cycle stage of the transport sector is divided into six main categories. (1) energy production, (2) raw material extraction, (3) material preparation of petrochemical product, non-metallic metal, basic metal, textile and pulp product and fabricated metal, (4) manufacturing, (5) construction and (6) operation. Fig. 1 intends to identify the quantitative relations between direct and indirect energy in line with the life cycle stage of transportation. The direct is estimated at 0.356 million TOE/ year and the indirect energy is about 0.167 million TOE/year for rail freight transport. Road freight directly consumed energy at the point of use is 12.295 million TOE/year and indirect energy required for delivery of goods per year was 2.915 million TOE.
(a) raw material extraction (b) petrochemical product(processing base) (c) petrochemical product: material base (d) non-metallic product (e) basic metal: processing base (f) basic metal(material base) (g) textile, wood and pulp product (h) fabricated metal (i) manufacturing (j) construction (k) operation
Fig.1 Direct and indirect energy consumed by freight rail and road transport
Figure 2 presents a profile for the consumption of direct and indirect energy for rail and road modesfor passenger and freight transport. the details on structural energy for both direct and indirect consumption are provided. Indeed, this is one of the advantages of the energy input-output approach developed from the current study. For example, the freight rail transport is
Scope of evaluation unit Rail mode Road mode
Tailpipe million kg CO2-eq./year 474.00 29,421.05
Life cycle million kg CO2-eq./year 1,099.62 36,813.13
Life cycle kg CO2-eq./capita
68.16 769.08 g CO2-eq./tkm 284.67 607.07
estimated to be using 0.17 million TOE of fuel oil and 0.01 million TOE of electricity in its operation. Calculation results show that 0.07 million TOE is required for energy production. The result of this section attempts to address thechoice of direct energy that is meant for indirect and total energy consumption. Moreover, the choice of energy is strongly correlated with CO2
emission particularly energy base fossil fuels.
Fig.2 Life cycle energy consumption for rail and road transport
3.2 Analysis of CO2 emissions
To be able to address the environmental performance of rail and road, the total results for emission are divided by capita and traffic volume of freight transport expressed by tkm (ton-kilometer travel). The traffic volume, which is expressed in million ton-kilometers (tkm) for road and rail mode, was 68,971 and 61,246 tkm, respectively. The South Korean population was around 48.92 million.
As can be seen in Table 1, the first two rows compare the contribution of CO2 from tailpipe
and from the life cycle. Note that tailpipe is a consideration of fuel consumption and its contribution on CO2 emission at the operation stage. The difference between tailpipe and life
cycle is 132% and 25.12% for rail and road transport. Although the majority contribution of both modes is from tailpipe, this study has demonstrated the importance CO2 in all life cycle
stages. These results clearly show that there is a significant amount of energy consumption from the rail transport’s supply chain and energy production activity. By means of traffic volume basis, road mode produces emissions 2.1 times larger than rail mode due to road mode’s emitting on a 607.07 gCO2-eq./ tkm basis, while the value for rail mode was 284.67 g CO2-eq./tkm. On a
capita basis, rail mode generate 68.16 kgCO2-eq. while road mode emits 769.08 kgCO2-eq..
Table 1 CO2 emissions analysis
4. Conclusion
The results of the current work provide a more complete picture of energy and CO2 emission for
rail and road transport. The useful input-output method is applied to quantify the environmental burden for the transport supply chain. Given the modeling approach used for the analysis, the first result attempts to address the choice of direct energy that is meant for indirect and total energy consumption. Second, the results show that there are significant differences between tailpipe and life cycle in term of emission analysis. On a tkm basis, it is estimated that the road value is about three times that of rail. The results also show that the main contribution of CO2
emission from road transport is in the operation stage, which accounts for 70%; however, it is the construction and supply chain stage that accounts for over 50% of the emission of rail transport. This indicates that attention should also be focused on those supply chain activities with potentially sizeable impact on CO2 emission
5. Acknowledgement
The authors gratefully acknowledge the financial support from KICTTEP (Korea Institute of Construction & Transportation Technology Evaluation and Planning) and also from MKE (Ministry of Knowledge Economic).
Reference
1. Yoshido Y, Ishitani H, Matsuhashi R, Kudoh Y, Okuma H, Morita K, Koike A, Kobayashi O. Reliability of LCI considering the uncertainties of energy consumptions in input-output analyses. Applied Energy. 2002;73:71-82
2. Facanha C, Horvath A. Environmental Assessment of Freight Transportation in the U.S.. International Journal of Life Cycle Assessment. 2006; 11:229-239.
3. Hendrickson C, Matthews HS, Cicas G. Analyaia of Regional Supply Chain Economic and Economical Effects of Expansion of the U.S. Freight-Rail System. 2006. Cited 2009 June30. Available from:, http://www.ascelibrary.org
4. Crawford RH. Greenhouse gas emissions embodied in reinforced concrete and timber railway sleepers. Environmental Science and Technology. 2009;43: 3885-3890
5. The International Union of Railways (UIC). Carbon footprint of high-speed railway infrastructure (pre-study), Methodology and application of high speed railway operation of European railway. 2009.
6. Korea Energy Economics Institute, Ministry of Commerce, Industry and Energy. Energy Consumption Survey. 2005.
7. Korea Energy Economics Institute, Ministry of Knowledge Economy. Yearbook of Energy Statistics. 2008
8. BOK (The Bank of Korea)
9. IPCC. IPCC Guidelines for National Greenhouse Gas Inventories. 2006.