Effects of Paraquat Ban on Herbicide
Poisoning-Related Mortality
Dong Ryul Ko
1, Sung Phil Chung
1, Je Sung You
1, Soohyung Cho
2, Yongjin Park
2, Byeongjo Chun
3,
Jeongmi Moon
3, Hyun Kim
4, Yong Hwan Kim
5, Hyun Jin Kim
6, Kyung-Woo Lee
7, SangChun Choi
8,
Junseok Park
9, Jung Soo Park
10, Seung Whan Kim
11, Jeong Yeol Seo
12, Ha Young Park
13, Su Jin Kim
14,
Hyunggoo Kang
15, Dae Young Hong
16, and Jung Hwa Hong
171Department of Emergency Medicine, Yonsei University College of Medicine, Gangnam Severance Hospital, Seoul; 2Department of Emergency Medicine, College of Medicine, Chosun University, Gwangju;
3Department of Emergency Medicine, Chonnam National University Medical School, Gwangju; 4Department of Emergency Medicine, Yonsei University Wonju College of Medicine, Wonju;
5Department of Emergency Medicine, Samsung Changwon Hospital, Sungkyunkwan University School of Medicine, Changwon; 6Department of Emergency Medicine, Konyang University College of Medicine, Daejeon;
7Department of Emergency Medicine, Catholic University of Daegu School of Medicine, Daegu; 8Department of Emergency Medicine, Ajou University School of Medicine, Suwon;
9Department of Emergency Medicine, Inje University Ilsan Paik Hospital, Ilsan;
10Department of Emergency Medicine, Chungbuk National University Hospital, Cheongju;
11Department of Emergency Medicine, College of Medicine, Chungnam National University, Daejeon;
12Department of Emergency Medicine, Chuncheon Sacred Heart Hospital, College of Medicine, Hallym University, Chuncheon; 13Department of Emergency Medicine, Inje University Haeundae Paik Hospital, Busan;
14Department of Emergency Medicine, College of Medicine, Korea University Hospital, Seoul; 15Department of Emergency Medicine, Hanyang University College of Medicine, Seoul; 16Department of Emergency Medicine, Konkuk University School of Medicine, Seoul;
17Department of Research Affairs, Biostatistics Collaboration Unit, Yonsei University College of Medicine, Seoul, Korea.
Purpose: In Korea, registration of paraquat-containing herbicides was canceled in November 2011, and sales thereof were com-pletely banned in November 2012. We evaluated the effect of the paraquat ban on the epidemiology and mortality of herbicide-in-duced poisoning.
Materials and Methods: This retrospective study analyzed patients treated for herbicide poisoning at 17 emergency departments in South Korea between January 2010 and December 2014. The overall and paraquat mortality rates were compared pre- and post-ban. Factors associated with herbicide mortality were evaluated using logistic analysis. To determine if there were any changes in the mortality rates before and after the paraquat sales ban and the time point of any such significant changes in mortality, R software, version 3.0.3 (package, bcp) was used to perform a Bayesian change point analysis.
Results: We enrolled 2257 patients treated for herbicide poisoning (paraquat=46.8%). The overall and paraquat poisoning mor-tality rates were 40.6% and 73.0%, respectively. The decreased paraquat poisoning mormor-tality rate (before, 75% vs. after, 67%,
p=0.014) might be associated with increased intentionality. The multivariable logistic analysis revealed the paraquat ban as an
in-dependent predictor that decreased herbicide poisoning mortality (p=0.035). There were two major change points in herbicide mortality rates, approximately 3 months after the initial paraquat ban and 1 year after complete sales ban.
pISSN: 0513-5796 · eISSN: 1976-2437
Received: October 4, 2016 Revised: March 7, 2017 Accepted: April 3, 2017
Corresponding author: Dr. Sung Phil Chung, Department of Emergency Medicine, Yonsei University College of Medicine, Gangnam Severance Hospital, 211 Eonju-ro, Gang-nam-gu, Seoul 06273, Korea.
Tel: 82-2-2019-3030, Fax: 82-2-2019-4820, E-mail: [email protected] •The authors have no financial conflicts of interest.
© Copyright: Yonsei University College of Medicine 2017
This is an Open Access article distributed under the terms of the Creative Commons Attribution Non-Commercial License (http://creativecommons.org/licenses/by-nc/4.0) which permits unrestricted non-commercial use, distribution, and reproduction in any medium, provided the original work is properly cited.
Yonsei Med J 2017 Jul;58(4):859-866 https://doi.org/10.3349/ymj.2017.58.4.859
INTRODUCTION
Paraquat is a non-selective herbicide that is widely used in agri-culture, because it is fast acting and non-persistent in the envi-ronment. However, paraquat is also one of the herbicides com-monly used for suicide. Worldwide, paraquat accounts for 20 deaths per million persons. Paraquat has been used in Korea for the past three decades, with an estimated 2000 toxic inges-tions annually and an associated 60–70% mortality.1 As there are still no effective therapies to treat paraquat poisoning,2 vari-ous measures have been instituted in the effort to reduce the mortality rate thereof. The INTEON formulation, which con-tains a natural alginate that immediately gels in the gastric pH environment, was developed to reduce the gastrointestinal ab-sorption of paraquat.3 However, this formulation did not signifi-cantly improve survival rates.4
There are controversies as to whether the restriction or sales ban of highly toxic pesticides could reduce the mortality from pesticide poisoning. A study conducted in India showed that re-striction of pesticide availability and accessibility by non-pesti-cide management has the potential to reduce suinon-pesti-cide attempts.5 However, research in Sri Lanka revealed a propensity to switch to using other pesticides that are often as toxic as the banned agent in agricultural practice.6
In Europe, the sale of paraquat has been banned since 2007. A study in France that analyzed poisoning-related cases that occurred 4.5 years before and after the sales ban revealed only a slight decrease after the sales ban.7 The decrease was found mostly in unintentional poisoning cases. In Korea, the com-plete ban of paraquat product sales took effect in 2012. The pesticide-related suicide mortality decreased from 5.26 to 2.67 per 100000 population between 2011 and 2013.8 A single-cen-ter study showed that the total number of suicide attempts decreased, and the proportion of paraquat- to pesticide-relat-ed suicide attempts decreaspesticide-relat-ed from 63.4% to 24.5% from 2011 to 2014.9 The purpose of this study was to evaluate the effect of the paraquat ban on the incidence and mortality of herbicide poisonings in Korea.
MATERIALS AND METHODS
Study setting
In Korea, herbicide sales are managed by a notification system
and not a licensing system. Since 1999, the Korean government has set restrictions on herbicide handling, such as increasing the required qualifications of sellers and recording the personal information of buyers, to strengthen paraquat management. However, this strategy has proven insufficient.
The paraquat ban was implemented in two stages in Korea. First, the registration of all products containing paraquat was canceled in November 2011; however, the sales and use were permitted for 1 year. Then, a complete sales ban was instituted in November 2012, after which all remaining products were re-covered from sellers.
Data collection
The present study was a multicenter, retrospective, cohort study. From the Korean Society of Clinical Toxicology, the hospital centers were selected after verifying the willingness of the clinical toxicologists in each hospital to participate. We selected 17 hospitals across the country to determine the national dis-tribution of paraquat poisoning: four in Seoul; two each in Gy-eonggi-do, Busan, Daejeon, Gwangju, Chungcheong Province (Chungcheongnam-do, Chungcheongbuk-do), and Gangwon-do; and one in Daegu (Fig. 1).
This study was approved by the Institutional Review Board (IRB), which waived the requirement for informed consent (3- 2014-0302). In addition, all the hospitals that participated in the study were approved by the IRB. The patient medical re-cords were reviewed by a clinical toxicologist at each hospital in the study, and the data were entered into the study database. The collected data were classified according to the selection criteria by two reviewers.
Subject
Among the patients who visited the emergency departments of the selected hospitals between January 2010 and December 2014, the data for those with herbicide poisoning were elec-tronically retrieved using a final diagnostic code for toxic effects of herbicides and fungicides (ICD-10 code, T60.3). In addition to paraquat, we also collected herbicide poisoning-related in-formation irrespective of age and sex to see if the poisoning by other herbicides increased after the paraquat ban. If the name of the exposure product or ingredient was an herbicide, it was included in the investigation, even if the exposure dose was un-known. All routes of exposure, such as the skin, eye contact, and ingestion, were included. Patients exposed to unknown herbi-Conclusion: This study suggests that the paraquat ban decreased intentional herbicide ingestion and contributed to lowering herbicide poisoning-associated mortality. The change point analysis suggests a certain timeframe was required for the manifesta-tion of regulatory measures outcomes.
cide products or fungicides, as well as those with unknown outcomes (death or survival), were excluded.
Variables
We reviewed the medical records and extracted personal (ad-mission date, age, and sex), poisoning-related (product name, route of exposure, ingestion amount, and intentionality), and outcome (death or survival) information. If we could not obtain information about survival from the provided medical record, a telephone survey was conducted. Exposure routes were classi-fied into ingestion and other groups. Ingestion amounts were classified as less than 50 mL, 50 mL or more, 100 mL or less, 100 mL or more, and unknown. These measurements were deter-mined from the practice of recording ingestion amounts
usual-ly recorded based on the volume of one soju glass, which is 50 mL. Then, to determine the difference in changes among her-bicide types, the toxic substances were classified into paraquat, glyphosate, glufosinate, and other groups.
To account for the changes in the quantities sold and used, glyphosate and glufosinate, which are non-selective herbicides similar to paraquat, were included in the herbicide group of substances that can be substituted for paraquat. Furthermore, other substances such as bentazone sodium, 2-methyl-4-chlo-rophenoxyacetic acid, orthosulfamuron, fenoxaprop-P-ethyl, and mixtures of various agents were grouped together for the analysis since they were few. We defined the period before the paraquat ban as from January 2010 to November 2012 while the period after the ban was defined as December 2012 to 2014.
Statistical analysis
Data are presented as the mean±standard deviation or per-centages. The mortality rate during the study period, the sex proportions, intentionality, and percentage of poisoning pa-tients were calculated according to study region. We performed univariate logistic regression analysis to evaluate relationships between the demographic characteristics. Furthermore, we identified independent prognostic factors for death from her-bicide intoxication using multivariable logistic regression analysis integrating major covariates (selected here as vari-ables with a p<0.05), as indicated in the univariate analysis. In addition, factors commonly known to affect the prognosis of poisoning patients were included in the multivariate statistical analysis. The results are expressed as odds ratios (ORs) and 95% confidence interval.
Statistical Analysis Software (SAS) version 9.2 (SAS Institute, Cary, NC, USA) was used for all data analyses. Based on the mortality rates calculated for each drug type, a chi-square test was performed and a p value<0.05 was considered statistically significant. To determine any changes in the characteristics before and after the paraquat sales ban, a chi-square test and independent two-sample t-test were performed. A p value<0.05 was considered as statistically significant. To determine any significant changes in the mortality rates before and after the paraquat sales ban and their time points, R software, version 3.0.3 (package, bcp) was used to perform a Bayesian change point analysis, which divides time intervals to calculate the probability of change at each point. The Bayesian approach
as-sumes prior distributions of the means in each block of the di-vision, and then it estimates the probability of a change point and updates the posterior means based on the data, probabil-ities, and division blocks. The choice of a cut-off for the poste-rior probabilities can be subjective.10,11
RESULTS
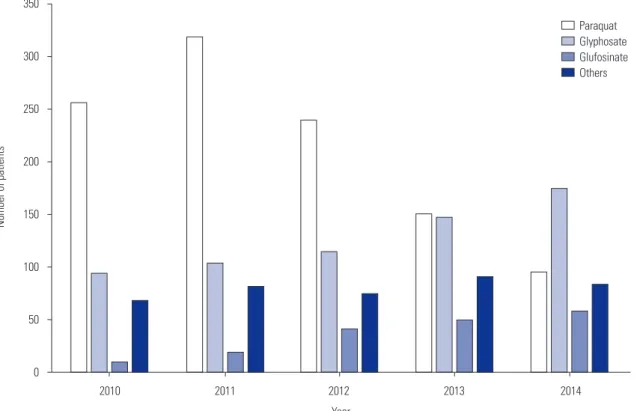
We enrolled 2257 patients with a mean age of 59.8±16.1 years; there was a higher number of male (90.9%) than female patients. Among the patients, 1794 (79.4%) intentionally ingested her-bicides, and the number of poisoning cases was highest in Gwangju, followed by Daejeon and Gangwon Province in that order (Fig. 1). The products that patients were exposed to were paraquat 1056 (46.8%), glyphosate 629 (27.9%), glufosinate 176 (7.8%), and other agents 366 cases (16.2%), including 30 mixed poisonings. The study period was analyzed by separat-ing each year to evaluate the changes in each herbicide poi-soning (Fig. 2). Then, 60% of the patients were classified in the period “before paraquat ban.” The average patient mortality rate was 40.6%; the mortality rates for each herbicide were 73.0%, 13.8%, and 9.6%, for paraquat, glyphosate, and glufos-inate, respectively.
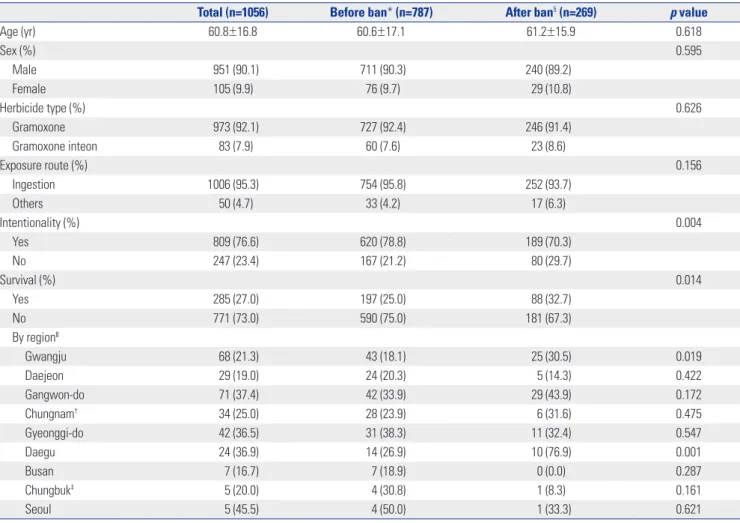
Among patients with paraquat poisoning, the mortality rate decreased from 74.9% before the ban to 67.3% in the period after it was instituted (p=0.014) (Table 1). The proportion of intentional poisonings significantly decreased after the
para-Fig. 2. Changes in number of deaths due to herbicide poisoning.
350 300 250 200 150 100 50 0 Year 2010 2011 2012 2013 2014 Number of patients Paraquat Glyphosate Glufosinate Others
quat ban (78.8% vs. 70.3%, p=0.004) (Table 1). There were sig-nificant differences in age, region, herbicide type, period, co-ingestion, exposure route, estimated dose, and intentionality between the survival and the mortality groups (Table 2). Mul-tivariate logistic regression analysis confirmed that the period “after paraquat ban” was associated with lower herbicide mor-tality (OR=0.738, p=0.035) (Table 3). In the Bayesian change point analysis, a major increase in the change rate of herbi-cide mortality was observed in February 2012, approximately 3 months after the paraquat ban was enforced, which corre-lated with a prominent decrease in the mortality rate. Subse-quently, the mortality rate decreased slightly and then stabi-lized until November 2013, when it dropped by a wide margin. This resulted in another major increase in the change rate that was higher than the previous change, which occurred approx-imately 1 year after the complete sales ban (Fig. 3).
DISCUSSION
Paraquat is widely used because it has a faster effect and is
cheaper than other herbicides. The paraquat ban has limited the choice of herbicides available to farmers, which had the following confirmed effect: The number of paraquat poison-ings gradually but distinctly decreased, while that of glypho-sate, glufosinate, and other agents increased slightly (Fig. 2). Similar results were previously reported by Lee, et al.,9 who discovered a significant trend of increased annual number of suicides and proportion of suicides induced by glyphosates and glufosinates versus total herbicide. In addition, in this study, there was a significant difference in intentionality (p=0.004) and mortality (p=0.014) (Table 1). Another previous study re-vealed there was only a slight decrease in paraquat-related mortalities after its sale was banned in Europe from July 2007.7 Unlike the studies mentioned above, this study revealed that the epidemiology of herbicide poisonings changed after the paraquat ban. Since the ban would limit both accidental and intentional exposure, it was possible to objectively analyze the effects of the ban in that context. Our results suggest that the mortality rate changed according to the herbicide used, as data for accidental ingestion, as well as suicide, was included. These results seem to reflect the fact that the ban on toxic drugs alone
Table 1. Characteristics and Statistical Differences in Variables between the Periods before and after Paraquat Ban in Patients with Paraquat Poisoning
Total (n=1056) Before ban* (n=787) After ban§ (n=269) p value
Age (yr) 60.8±16.8 60.6±17.1 61.2±15.9 0.618 Sex (%) 0.595 Male 951 (90.1) 711 (90.3) 240 (89.2) Female 105 (9.9) 76 (9.7) 29 (10.8) Herbicide type (%) 0.626 Gramoxone 973 (92.1) 727 (92.4) 246 (91.4) Gramoxone inteon 83 (7.9) 60 (7.6) 23 (8.6) Exposure route (%) 0.156 Ingestion 1006 (95.3) 754 (95.8) 252 (93.7) Others 50 (4.7) 33 (4.2) 17 (6.3) Intentionality (%) 0.004 Yes 809 (76.6) 620 (78.8) 189 (70.3) No 247 (23.4) 167 (21.2) 80 (29.7) Survival (%) 0.014 Yes 285 (27.0) 197 (25.0) 88 (32.7) No 771 (73.0) 590 (75.0) 181 (67.3) By regionǁ Gwangju 68 (21.3) 43 (18.1) 25 (30.5) 0.019 Daejeon 29 (19.0) 24 (20.3) 5 (14.3) 0.422 Gangwon-do 71 (37.4) 42 (33.9) 29 (43.9) 0.172 Chungnam† 34 (25.0) 28 (23.9) 6 (31.6) 0.475 Gyeonggi-do 42 (36.5) 31 (38.3) 11 (32.4) 0.547 Daegu 24 (36.9) 14 (26.9) 10 (76.9) 0.001 Busan 7 (16.7) 7 (18.9) 0 (0.0) 0.287 Chungbuk‡ 5 (20.0) 4 (30.8) 1 (8.3) 0.161 Seoul 5 (45.5) 4 (50.0) 1 (33.3) 0.621
*January 2010–October 2012, †Chungcheongnam-do, ‡Chungcheongbuk-do, §November 2012–December 2014, ǁSurvivors number (percentage survivors of
has some limitations on reducing mortality.
A previous study by Cha, et al.8 reported that the ban on para-quat lowered the pesticide suicide rate from 2011–2012. That study had limitations, such as a short study period and the en-rollment of only patients who attempted suicide, although the results were similar to those of the present study. According to the multivariate logistic regression analysis in this study, inten-tionality and herbicide type were expected to affect the death rate from herbicide poisoning. Intentional ingestion was re-duced from 78.8% to 70.3% after the sales ban, suggesting that
intentionality affected the mortality rate of paraquat. We also confirmed that the number of intentional suicides dropped after the paraquat ban. It is evident that the paraquat ban con-tributed to a decline in the total number of suicides, although the proportion of cases of herbicide poisonings out of the total suicide cases was relatively small. The multivariate logistic re-gression model revealed that the paraquat ban was associated with herbicide-related mortality (p=0.035). This observation suggests that, in addition to the decreased suicide rate observed in previous studies, the paraquat ban affected mortality.
There-Table 2. Demographics of Patients with Herbicide Poisoning According to Survival and Death
Total (n=2257) Survival (n=1341) Death (n=916) p value*
Age (yr) 59.8±16.1 56.4±15.4 64.6±15.9 <0.001 Sex (%) 0.474 Male 2053 (91.0) 1215 (90.6) 838 (91.5) Female 204 (9.0) 126 (9.4) 78 (8.5) Region (%) 0.024 Gwangju 697 (30.9) 403 (30.0) 294 (32.0) Daejeon 337 (14.9) 189 (14.1) 148 (16.2) Gangwon-do 313 (13.9) 188 (14.0) 125 (13.6) Chungnam† 259 (11.5) 137 (10.2) 122 (13.3) Gyeonggi-do 224 (9.9) 142 (10.6) 82 (9.0) Daegu 156 (6.9) 100 (7.5) 56 (6.1) Busan 150 (6.6) 99 (7.4) 51 (5.6) Chungbuk‡ 85 (3.8) 56 (4.2) 29 (3.2) Seoul 36 (1.6) 27 (2.0) 9 (1.0) Herbicide type (%) <0.001 Paraquat 1056 (46.8) 285 (21.2) 771 (84.2) Glyphosate 629 (27.9) 543 (40.5) 86 (9.4) Glufosinate 176 (7.8) 159 (11.9) 17 (1.8) Others 396 (17.5) 354 (26.4) 42 (4.6) Paraquat ban (%) <0.001 Before§ 1362 (60.3) 697 (52.0) 665 (72.6) Afterǁ 895 (39.7) 644 (48.0) 251 (27.4) Coingestion (%) 0.007 None 1789 (79.2) 1039 (77.5) 750 (81.9) Alcohol 419 (18.6) 265 (19.8) 154 (16.8) Other herbicide 34 (1.5) 23 (1.7) 11 (1.2) Oral pill 15 (0.7) 14 (1.0) 1 (0.1) Exposure route (%) <0.001 Mouth 2186 (96.8) 1278 (95.3) 908 (99.1) Others 71 (3.2) 63 (4.7) 8 (0.9) Estimated dose, mL (%) <0.001 <50 322 (14.3) 237 (17.7) 85 (9.3) 50–100 540 (23.9) 349 (26.0) 191 (20.9) >100 796 (35.3) 474 (35.3) 322 (35.1) Unknown 599 (26.5) 281 (21.0) 318 (34.7) Intentionality (%) 0.001 Yes 1794 (79.5) 1033 (77.0) 761 (83.1) No 463 (20.5) 308 (23.0) 155 (16.9)
fore, it appears that after the paraquat ban the mortality rate tended to decline (Table 3).
A previous study by Myung, et al.12 reported a marked de-crease with time in the number of suicides related to poisoning with herbicide after the paraquat ban. In the present study, a Bayesian change point analysis was performed to determine when the statistically significant changes in herbicide-related mortality occurred, not just suicide.11,13 There were two time points with a wide amplitude change in posterior probability,
which can be considered as a significant change point of the herbicide-related mortality. The first change point was between December 2011 and February 2012, which was approximately 3 months after the ban on production. After the mortality rate had dropped, it was maintained at that level and a period of stabilization was observed. The changes in mortality rate at this point may be attributable to low accessibility to paraquat, be-cause production was banned, but existing inventory was still on sale. Therefore, depending on the inventory consumed on small farms, the accessibility of paraquat reduced with time. However, the existing stock in certain sales outlets was still be-ing used and, hence, the mortality rate did not attain the level seen in the latter parts. The second change point was in No-vember 2013, which was approximately 1 year after the imple-mentation of the sales ban. At this point, another drop in mor-tality rate was observed, followed by a period of stabilization. We believe most of the paraquat that had been on hand since the production ban was used, which drastically decreased its availability, and relatively less toxic substances were used as substitutes. This resulted in a drop in herbicide-related mortali-ty, which remained at a low level. However, these mortality rate results appear to be higher than the average results of other her-bicides (except paraquat), and it has been suggested that the ban on toxic substances has a limited contribution to mortali-ty reduction.
The present study has several limitations that are worth men-tioning. First, this was a retrospective study and some informa-tion provided by the patients, such as inteninforma-tionality or estimat-ed ingestion dose, might have been inaccurate or insufficient. Second, although it was a study on mortality, it was not possible
Table 3. Univariate and Multivariate Logistic Regression Analyses Predicting Herbicide-Related Mortality
Univariate logistic regression Multivariate logistic regression
OR (95% CI) p value OR (95% CI) p value
Age (yr) 1.034 (1.028–1.04) <0.0001 1.048 (1.04–1.056) <0.0001
Sex (female) 0.898 (0.668–1.206) 0.474
Herbicide type
Paraquat 1 (reference) 1 (reference)
Glyphosate 0.059 (0.045–0.076) <0.0001 0.039 (0.029–0.053) <0.0001
Glufosinate 0.04 (0.024–0.066) <0.0001 0.028 (0.016–0.048) <0.0001
Others 0.044 (0.031–0.062) <0.0001 0.031 (0.021–0.046) <0.0001
Paraquat ban (after) 0.409 (0.341–0.489) <0.0001 0.766 (0.598–0.982) 0.0352
Co-ingestion
None 1 (reference) 1 (reference)
Alcohol 0.805 (0.646–1.003) 0.053 1.63 (1.156–2.299) 0.0053
Other herbicides 0.663 (0.321–1.367) 0.266 0.959 (0.37–2.485) 0.9321
Other medications 0.099 (0.013–0.754) 0.026 0.215 (0.024–1.893) 0.1662
Exposure route
Ingestion 1 (reference) 1 (reference)
Others 0.179 (0.085–0.375) <0.0001 0.099 (0.043–0.228) <0.0001
Intentionality (yes) 1.464 (1.181–1.814) 0.0005 2.417 (1.711–3.416) <0.0001
OR, odds ratio; CI, confidence interval.
Fig. 3. Bayesian change point analysis of herbicide mortality. Posterior mean is trend line of herbicide mortality, posterior probability of change reflects change in herbicide mortality. (A) Production ban and (B) distri-bution ban. 0.6 0.5 0.4 0.3 0.2 0.9 0.6 0.3 0.0 Posterior mean
Posterior probability of change
2010 Jan. 2011 Nov. 2012 Nov. 2014 Dec.
to standardize and reflect the past medical history and health status of the individual patients. Third, this study was a multi-center study, and therefore, regional and institutional differ-ences may have influenced the results.
In conclusion, this study suggests that the paraquat ban is as-sociated with a reduced mortality rate of herbicide poisoning. After the paraquat ban, the number of associated poisonings decreased, while that of the other less toxic herbicides poison-ings increased. It may also have resulted from decreased inten-tional ingestion. Furthermore, a certain period may be required for the effect of regulatory measures to reduce the mortality.
ACKNOWLEDGEMENTS
The authors would like to thank Dong-Su Jang, MFA, (Medical Illustrator) for his help with the illustrations.
REFERENCES
1. Seok SJ, Gil HW, Jeong DS, Yang JO, Lee EY, Hong SY. Paraquat in-toxication in subjects who attempt suicide: why they chose para-quat. Korean J Intern Med 2009;24:247-51.
2. Gil HW, Hong JR, Jang SH, Hong SY. Diagnostic and therapeutic approach for acute paraquat intoxication. J Korean Med Sci 2014; 29:1441-9.
3. Heylings JR, Farnworth MJ, Swain CM, Clapp MJ, Elliott BM. Identification of an alginate-based formulation of paraquat to re-duce the exposure of the herbicide following oral ingestion.
Toxi-cology 2007;241:1-10.
4. Wilks MF, Tomenson JA, Fernando R, Ariyananda PL, Berry DJ, Buckley NA, et al. Formulation changes and time trends in out-come following paraquat ingestion in Sri Lanka. Clin Toxicol (Phila) 2011;49:21-8.
5. Vijayakumar L, Satheesh-Babu R. Does ‘no pesticide’ reduce sui-cides? Int J Soc Psychiatry 2009;55:401-6.
6. Roberts DM, Karunarathna A, Buckley NA, Manuweera G, Sheriff MH, Eddleston M. Influence of pesticide regulation on acute poison-ing deaths in Sri Lanka. Bull World Health Organ 2003;81:789-98. 7. Kervégant M, Merigot L, Glaizal M, Schmitt C, Tichadou L, de
Haro L. Paraquat poisonings in France during the European ban: experience of the Poison Control Center in Marseille. J Med Toxi-col 2013;9:144-7.
8. Cha ES, Chang SS, Gunnell D, Eddleston M, Khang YH, Lee WJ. Impact of paraquat regulation on suicide in South Korea. Int J Ep-idemiol 2016;45:470-9.
9. Lee JW, Hwang IW, Kim JW, Moon HJ, Kim KH, Park S, et al. Com-mon pesticides used in suicide attempts following the 2012 Para-quat Ban in Korea. J Korean Med Sci 2015;30:1517-21.
10. Christensen J, Rudemo M. Multiple change-point analysis of dis-ease incidence rates. Prev Vet Med 1996;26:53-76.
11. Erdman C, Emerson JW. bcp: an R package for performing a Bayes-ian analysis of change point problems. J Stat Softw 2007;23:1-13. 12. Myung W, Lee GH, Won HH, Fava M, Mischoulon D, Nyer M, et
al. Paraquat prohibition and change in the suicide rate and meth-ods in South Korea. PLoS One 2015;10:e0128980.
13. Moriarty JP, Schiebel NE, Johnson MG, Jensen JB, Caples SM, Mor-lan BW, et al. Evaluating implementation of a rapid response team: considering alternative outcome measures. Int J Qual Health Care 2014;26:49-57.