CFX-5.7 Simulation of Thermal-Chemical Experiments
for a CANDU Fuel Channel
Hyoung Tae Kim, Bo Wook Rhee, Joo Hwan Park
Korea Atomic Energy Research Institute 150 Dukjin-Don, Yusong-Gu, Daejon 305-353, Korea
1. Introduction
An experimental program, the CHAN thermal Chemical Experimental Program [1], has been performed by AECL in Canada for validation of computer codes such as CHAN-II and CATHENA. These codes are capable of predicting the thermal-chemical response of CANDU fuel channels during a postulated Loss-of-Coolant Accident (LOCA) without Emergency Core Cooling System (ECCS). This program consists of several series of experiments: a single fuel element simulator (FES), 7-element, and 28-element tests.
CS28-2, one of 28-element tests, has 3-dimensional effects due to eccentric configuration of test section. The Computational Fluid Dynamic (CFD) code, CFX 5.7 is used to simulate the CS28-2 test at this study.
2. Overview of CS28-2 Experiment
2.1 Test Apparatus
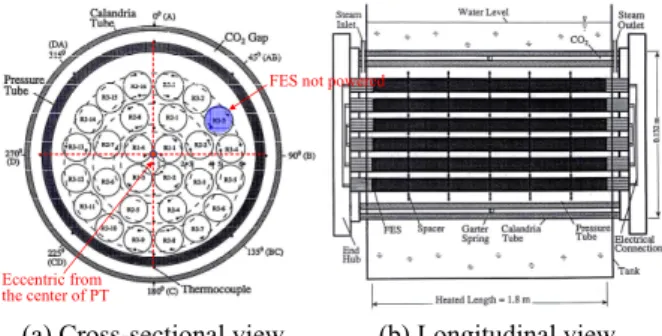
The test apparatus is shown in Fig. 1. The test section consists of the electrically heated FES bundle, pressure tube, gap annulus, and Calandria tube. The Calandria tube is surrounded by an open tank of 40℃ water. The FES bundle is consisted of three rings of FESs and eccentrically located inside the pressure tube. This eccentric configuration is prepared to understand the fuel channel behavior when the pressure tube is ballooned and most of the steam flow is bypassed through the upper part of the channel.
The superheated steam at 670℃ is injected to the inlet of the test section with a mass flow of 15 g/sec.
The CO2 gas flow in the annulus gap is 1.6 SLPM.
During the experiment, the electrically heated FESs are cooled by steam convection, conduction, and thermal radiation radially from FESs to the pressure tube and from the pressure tube to Calandria tube.
(a) Cross-sectional view (b) Longitudinal view Figure 1 Schematic diagram of test section
2.2 Main Test Results
The power history curve of the FES bundle is shown in Fig. 2. The individual power is supplied to the outer, middle, and inner rings. The temperatures measured at FES and pressure tube are plotted in Fig. 3.
0 100 200 300 400 500 600 700 800 900 1000 0 20 40 60 80 100 120 140 160 Power (kW ) Time (s) Experiment (CS28-2) Total power Inner ring Middle ring Outer ring Stage 1: Steady-state
Figure 2 FES power transient
0 200 400 600 800 1000 1200 1400 600 800 1000 1200 1400 1600 1800 Temp erature ( oC) Time (s) Experiment (CS28-2) Inner ring(12)- inner surface Inner ring(12)- outer surface middle ring(12)- inner surface middle ring(12)- outer surface Outer ring(11)- inner surface Outer ring(11)- outer surface Pressure tube(12)
Figure 3 FES and pressure tube temperatures
3. CFX Modeling of CS28-2
3.1 Mesh Generation
The grid of CS28-2 test section is generated using the ICEM CFD [3] software. Figure 4 shows the results of grid generation and the mesh layers near the solid walls.
Mesh layer near the solid wall
PT Steam Heater rod
Figure 4 Mesh generation of CS28-2 test section
FES not powered
Eccentric from the center of PT
Transactions of the Korean Nuclear Society Autumn Meeting Busan, Korea, October 27-28, 2005
3.2 Material Properties
The materials used in the domain setting are graphite,
Al2O3, Zircaloy, steam, and CO2. Zircaloy is used for
FES sheath, pressure tube, and Calandria tube. These properties are the same as those used in CATHENA code [4].
3.3 Boundary Conditions
The modeling of pool surrounding the Calandria tube is simplified using the temperature boundary condition (40℃) on the outer surface of the Calandria tube. The steam injection flow is modeled by mass flow rate boundary condition at the inlet on the interface between steam and pressure tube domains. The FES power is modeled by an energy source within a solid sub-domain.
4. Discussion of Simulation Results
The present simulation of CS28-2 is performed only for steady-state conditions in this study.
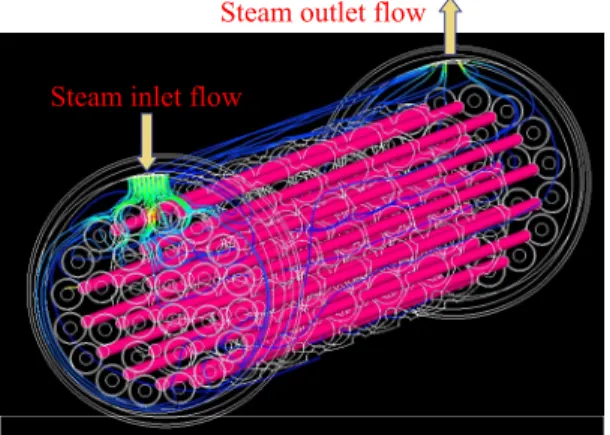
Figure 5 shows the stream lines of steam flow in the test section. It is confirmed that steam is injected and vented through upper sides of test section.
Steam inlet flow
Steam outlet flow
Figure 5 Stream lines of steam flow in the test section
FES temperatures are calculated along the axial direction of the test section as shown in Fig. 6. The predictions of FES temperature are higher than the experimental results. Considering the validation work for radiation heat transfer of CFX-5.7 [5], this discrepancy may come from inaccurate prediction of convection heat transfer or unknown heat loss in the experiment. The temperature drops at both ends of the heated section are due to the heat loss to the unheated zone at both ends
Figure 7 shows the radial temperature distribution between pressure tube and Calandria tube including the
CO2 gap. The temperature prediction of the pressure
tube is well agreed with the measured value, 600℃ as
shown in Fig. 7. The linear temperature gradient at CO2
gap comes from the conduction heat transfer and its
heat transfer rate is estimated as 7000.0 W/m2 using the
CO2 conductivity (0.04 W/m-℃) at average temperature
of 320℃. This value is much higher than the natural
convection heat transfer rate; 3017.2 W/m2, calculated
by the correlation of Raithby and Hollands [6].
0.0 0.2 0.4 0.6 0.8 1.0 1.2 1.4 1.6 1.8 680 700 720 740 760 780 800 Experiment T e mpera ture ( oC)
Distance from beginning of heated zone [m] CFX5.7
Outer ring Middle ring Outer ring
Figure 6 Axial temperature distributions of FESs
-0.062 -0.060 -0.058 -0.056 -0.054 -0.052 0 100 200 300 400 500 600 T em p era ture ( oC)
Radial location from center of test section [m] CFX-5.7 PT Temp. by Exp.
CO2 gap
40o
C
Calandria Pressure tube
Figure 7 Radial temperature distribution in the annulus gap (at axial location of 1.725 m)
5. Conclusions
From the simulation of CS28-2 using CFX-5.7 code, the following results are obtained.
• CFX-5.7 predictions of FES temperature are higher than the experimental measurements by 10~20℃. • The prediction of the pressure tube temperature is well
agreed with the measured data at exit region. • FES temperature drops at both ends of the heated
section in CFX-5.7 simulation, which is attributed to heat loss to unheated zone.
• Gap conductance and thermal radiation are dominant heat transfer modes in the annulus gap of CS28-2.
Further works are required for investigation of discrepancy of code prediction and transient simulation.
REFERENCES
[1] Hyoung Tae Kim, Bo Wook Rhee, and Joo Hwan Park, “Review of the Thermal-Chemical Experiments for a CANDU Fuel Channel”, AR-737/2005 KAERI Report 2005.
[2] ANSYS Inc., “Installing & Introduction to CFX5,” 2004. [3] ANSYS Inc., “ANSYS ICEM CFD 5.1: Tutorial Manual,” 2004.
[4] T.G. Beuthe, and B.N. Hanna (editors), “CATHENA MOD-3.5c/Rev 0 Theoretical Manual”, CANDU Owners Group Report, COG-99-007, 1999.
[5] Hyoung Tae Kim, Bo Wook Rhee, and Byung-Joo Min, “Validation of the Thermal Radiation Heat Transfer of CFX-5.7 Code Using Analytical Solutions”, Proc. of KNS Jeju May 2005.
[6] Adrian Bejan, “Convection Heat Transfer”, p.257-p.259, 2nd Edition, John Wiley & Sons, Inc. 1995.
middle ring outer ring