Comparison Study on the Noise Reduction Methods of Prompt Gamma Spectra
Yun-Hee Leea, Hee-Jung Ima, Byung Chul Songa, JungHwan Chob, Yong-Joon Parka, and Won Ho Kima
a Nuclear Chemistry Research Division, Korea Atomic Energy Research Institute, 150, Deokjin-dong, Yuseong-gu, Daejeon 305-353,Korea,[email protected] b College of Pharmacy, Sookmyung Women’s University, 53-12 Chungpa-dong 2-ga,
Yongsan-Ku,Seoul 140-742, Korea 1. Introduction
As international terrorism is increasing, security inspections that are conducted on the basis of travel baggage at places such as airports, are being strengthened. From this procedure, spectral data which have characteristics of components consisting of the substance are obtained. It is uneasy to discriminate random noises and special signals representing its characteristic through the original spectra measured during a short time.
In this study, to reduce the noises and to find the special signals of the spectra measured during a short time, principal component analysis(PCA) using singular value decomposition(SVD) has been applied. And the results of the method have been compared with those of a wavelet transformation, which is an usual method of a noise reduction(NR).
2. Methodologies 2.1 Principal Component Analysis
PCA is a multivariate statistical method to reduce the dimensionality of a data set consisting of a large number of interrelated variables, while retaining as much as possible the variation present in the data set[1-2]. PCA, to reduce noises, is closely related with the SVD of the data set.
Given an arbitrary matrix
X
of dimension n×p , which is a matrix of n observations on p variables measured about their means,X
can be writtenT
USV
X = (1)
where
X
has a rankr
(r≤min(n,p))and U , V are rn× , p× matrices, respectively, each of which has r
orthonormal columns so that UTU = ,Ir
r
TV I
V = .
S
is ar
×
r
diagonal matrix whose diagonal elements are the square root values of the eigenvalues of XTX.When the number of significant PCs are determined as k (k≤ [2], r)
X
given above in equation (1) can be reconstructed to T k p k k k n p n U S V X × = × × × summarized bymajor PCs k . The remaining r−k PCs include information about the noises.
The main idea of a noise reduction by PCA is to estimate the eigenvalues and eigenvectors, which are characteristics presenting information of a population, from given samples. Due to this reason, a data set
should consist of samples having sufficient information on the population.
2.2 Wavelet Transformation
Wavelet transformation was developed to revise a disadvantage of Fourier transformation[3]. This method reduces noises with various solutions. The general form of wavelet transformation function is defined as below
∫
−∞∞ Ψ = f t t dt t Wa,b( ) ( ) a,b() , ) ( ) ( /2 , t a a t b b b b a = Ψ − Ψ − − (2)where
f
(t
)
is the signal, Ψa,b(t) is the waveletfunction, a is the scale of length, and b is the time shift.
Unlike PCA, wavelet method needs only one sample. That is, it estimates signals by the shape of one given sample.
3. Experiments and Results 3.1 Experimental Data
The experimental prompt gamma spectra were collected using a HANARO PGAA facility in KAERI run with the neutron flux of about 1.4x10⁸ n·cm-2·s-1[4].
A sample used in this study is melamine (MEL, C3H6N6,
Aldrich, 99%), which is a non-explosive substance but contains similar relative concentrations of C, H, and N like explosives do. MEL of the amount of 0.1g was irradiated 10 times, respectively, for 20, 30, 50, 100, and 500 seconds.
3.2 Analysis of Results
PCA and wavelet transformation were performed using MATLAB 6.5. Figure 1 and Table 1 show how many PCs are significant for classifying the noise and the signal part of the measured spectra. It seems to be proper to choose two PCs. The optimal condition of a number of wavelet functions is a symlet wavelet with order 2, which was determined with one having a maximum root mean square(RMS) over the entire energy levels.
Transactions of the Korean Nuclear Society Autumn Meeting Busan, Korea, October 27-28, 2005
Figure 1. Scree plot showing Eigenvalues vs. PC number. Table 1. Eigenvalues and the proportions of their variance and cumulative variance
# of PC Eigenvalue Variance(%) Variance(%) Cumulative 1 1.64E+10 99.77 99.77 2 1.39E+07 0.08 99.85 3 2.64E+06 0.02 99.87
… … … …
50 64606 0.00 100.00
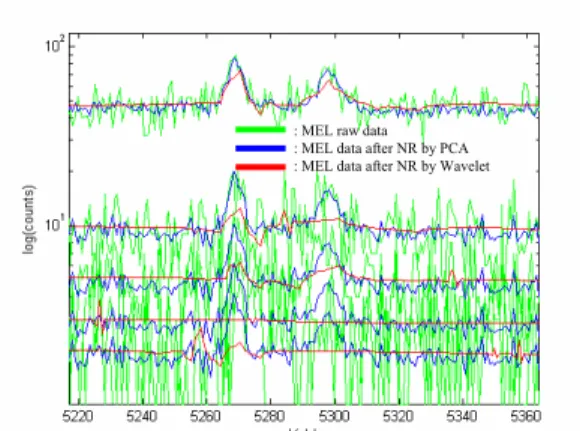
Figure 2 shows the raw spectra of MEL before NR and the spectra after NR with both methods. Figure 3 shows the nitrogen(N) peaks(at 5269.2 and 5297.8 KeV) before and after NR based on one sample. It seems to be that the result of NR by PCA is more effective than that by a wavelet. Especially, for the results of the spectra measured during a short time, N peaks by PCA are almost exactly exposed, while not being found by the wavelet method.
Figure 2. Raw and noise-reduced spectra by PCA and Wavelet on the basis of a MEL sample.
To quantify the degree of the reduced noises, a signal-to-noise ratio(S/N) was presented, which was defined as the peak intensity of the first N peak/standard deviation of the noise. Figure 4 shows the mean values of the S/N ratios calculated at each measurement time. As the time is increasing, it seems to be that all the S/N ratios of the three types are linearly increasing. The mean values of the S/N ratios by PCA and by Wavelet were enhanced by about 2.5-4.0 and 1.1-1.9 times, respectively, from those of the raw data. Especially, at 20 seconds, the value by PCA was improved more than that by a wavelet
.
Figure 3. Nitrogen peaks of MEL sample before and after NR by both methods.
Figure 4. Means of S/N ratios corresponding to each situation vs. transformed measurement time.
4. Conclusion
The noise reductions using PCA and a wavelet transformation have been carried out on the basis of prompt gamma spectra measured from a MEL sample. PCA is much more effective than the wavelet method, and the result of PCA is especially significant at a short measurement time. It is necessary to test the performance of the PCA with the spectra measured at a shorter time than 20 seconds.
REFERENCES
[1] K. Pearson, Phils. Mag., 1901
[2] I.T. Jolliffe, Principal Component Analysis, Springer-Verlag New York, INC., 2002.
[3] C. K. Chui, L. Montefusco, and L. Puccio, Wavelets: Therory, Algorithms, and Applications, ACADEMIC PRESS, INC., 1994.
[4] (a) H.-J. Cho, K.-W. Park, H.-J. Im, B.-C. Song, and Y.-J. Chung, Nucl. Instr., Meth. B 2005, submitted. (b) H.-J. Cho, Y.-J. Kim, Nucl. Instr. Meth. B 2005.
: MEL raw data : MEL data after NR by PCA : MEL data after NR by Wavelet
MEL raw data before NR
MEL data after NR by PCA