Role of hippocampal metabotropic
glutamate receptor 5 (mGluR5)
in stress-induced response:
physiological and behavioral analyses
Yeong Shin Yim
Department of Medical Science
The Graduate School, Yonsei University
Role of hippocampal metabotropic
glutamate receptor 5 (mGluR5)
in stress-induced response:
physiological and behavioral analyses
Directed by Professor Dong Goo Kim
The Doctoral Dissertation submitted to the
Department of Medical Science,
The Graduate School of Yonsei University
in partial fulfillment of the requirements for the degree
of Doctor of Philosophy
Yeong Shin Yim
June 2012
This certifies that the Doctoral Dissertation
of Yeong Shin Yim is approved.
Thesis Supervisor: Dong Goo Kim
Thesis Committee Member #1: Jae Jin Kim
Thesis Committee Member #2: Jeong-Hoon Kim
Thesis Committee Member #3: Insop Shim
Thesis Committee Member #4: Chul Hoon Kim
The Graduate School
Yonsei University
ACKNOWLEDGEMENTS
2006년 겨울, 신경과학을 전공하고 싶다는 의욕만으로 안영수 교수님과 김동구 교수님을 찾아 뵈었던 것이 벌써 6년 이나 흘렀습니다. 약리학교실의 많은 교수님들과 선-후배님들의 도움이 없었다면 현재의 저는 없었을 것입니다. 부족하나마 이 지면을 통하여, 그 동안 표현하지 못하였던 감사의 마음을 전하고자 합니다. 학위 과정 동안 저를 정성껏 이끌어 주시고 학문적으로 성숙시켜 주신 김동구 교수님께 정말 깊은 감사를 드립니다. 교수님의 훌륭하신 지도하에 지식뿐 아니라, 연구자로써 학문과 연구에 임하는 자세를 조금이나마 알게 되었습니다. 그리고, 약리학교실과 인연을 맺을 수 있도록 해주신 안영수 교수님께 무한한 감사의 마음을 전하고 싶습니다. 지난 6년 동안 함께하며 많은 것을 배울 수 있는 기회를 주셨던, 때로는 엄한 가르침으로 힘든 순간마다 새롭게 출발 할 수 있는 원동력을 제공해 주신 김철훈 교수님께 진심으로 감사 드립니다. 처음 제 손에 파이펫을 쥐어주신 이진우 선생님. 아무것도 모르던 저에게 연구에 대한 흥미를 심어주신 이진우 선생님께 늘 감사 드립니다. 언제나 섬세한 부분까지 신경 써 주시던 김경환 교수님, 연구에 대한 식견과 안목을 넓혀주신 이민구 교수님, 일하는 열정이 아름다우신 박경수 교수님과 김주영 교수님께 감사 드립니다. 멀리 떨어져 있지만, 언제나 저에게 관심 가져 주시는 문석준 교수님 감사합니다. 바쁘신 시간에 학위논문을 꼼꼼히 검토해 주시고 격려와 축하를 보내주신 김재진 교수님, 김정훈 교수님, 그리고 심인섭 교수님께 감사 드립니다. 긴 시간 동안 매일 함께 생활하면서 울고 웃던 약리학교실선-후배님들에게도 감사 드립니다. 실험에 대한 열정을 본받고 싶었던 이정호, 지헌영, 박현우 선생님께 감사 드립니다. 대학원 과정 동안 좋은 추억을 간직하게 해준, 임미경, 임아영, 정우영, 이정남, 이윤정, 손미란 선생님 고맙습니다. 함께한 시간은 오래되지 않았지만, 오래 알고 지낸 언니, 오빠같은 문여정, 윤홍인, 박형순, 정진세 선생님 고맙습니다. 힘든 일 기쁜 일 함께 나누며 열심히 일해준 뉴로랩 식구들, 손선영, 고석진, 권오빈, 윤은장, 한웅수, 최재용, 오소라, 신소라, 조호진, 지지 제호, 삼통 이정호 선생님 모두 감사하고 고맙습니다. 교실 궂은 일 도맡아 해주시는 임종수 선생님, 민선자 선생님, 김건태 선생님께도 감사 드립니다. 저에게 처음으로 연구를 하고 싶다는 생각을 심어주신 배성수 교수님과 박래준 교수님 감사합니다. 연구를 하면서 힘들 때 마다 멘토를 자청하며 응원해주고 격려해주신, 권용현, 김중휘, 이혜정, 박소현 교수님 감사합니다. 끝으로 어린 시절 큰 병으로 속만 썩이던 딸을 위해 항상 희생하셨던 부모님. 부모님의 사랑과 보살핌으로 인해 오늘의 제가 있을 수 있었습니다. 감사합니다. 더 자랑스러운 딸이 되도록 노력하겠습니다. 2012.06.
TABLE OF CONTENTS
ABSTRACT ---1
I INTRODUCTION ---3
1. Stress and stress response ---5
2. Epigenetics ---8
3. Glutamate receptor ---12
4. Aim of this study ---16
II MATERIALS AND METHODS ---18
Experiment 1. Hippocampal mGluR5 in the helplessness behavior after repetitive exposure to uncontrollable stressor ---18
1. Animals and housing ---18
2. Exposure to electric footshock ---19
3. Helplessness behavior ---19
4. Exploratory activity ---20
5. Immunoblotting for hippocampal mGluR5 ---20
6. Statistical analysis ---22
Experiment 2. Epigenetic modulation of hippocampal mGluR5 in establishing coping strategies after repetitive exposure to uncontrollable stressor ---23
1. Animals and housing ---23
3. Blood corticosterone measurement ---24
4. Implantation surgery of EEG telemetry device ---24
5. EEG recording and data analysis ---25
6. Immunoblotting ---26
7. RNA preparation and cDNA conversion ---27
8. Real-Time PCR ---28
9. gDNA purification, sodium bisulfite treatment, and methylation analysis ---28
10. Statistical analysis ---30
III RESULTS ---31
Experiment 1. Hippocampal mGluR5 in the helplessness behavior after repetitive exposure to uncontrollable stressor ---31
1. The relationship between helplessness behavior and the protein expression of mGluR5 after exposure to electric footshock stress ---31
2. The exploratory activity after exposure to electric footshock stress ---36
Experiment 2. Epigenetic modulation of hippocampal mGluR5 in establishing coping strategies after repetitive exposure to uncontrollable stressor ---38
1. Individual differences in mGluR5 protein and mRNA expression after repetitive exposure to restraint stress ---38
2. DNA methyltransferase activity after repetitive exposure
to restraint stress ---42
3. DNA methylation pattern of the mGluR5 gene after repetitive exposure to restraint stress ---44
4. Theta power in electroencephalograms after repetitive exposure to restraint stress ---50
5. Blood concentrations of corticosterone after repetitive exposure to restraint stress ---58
6. The mGluR5 antagonist, MPEP, blocks variations in coping strategies after repetitive exposure to restraint stress ---60
IV DISCUSSION ---62
V CONCLUSION ---67
REFERENCES ---69
LIST OF FIGURES
Figure 1. Protein expression of mGluR5 in the hippocampus
---34
Figure 2. Exploratory activity in a novel environment ---37
Figure 3. Individual differences in the protein and mRNA
expression of mGluR5 after repetitive exposure to
restraint stress for 6 days ---40
Figure 4. DNA methyltransferase (DNMT) activity after
repetitive exposure to restraint stress for 6 days -43
Figure 5. Prediction of CpG islands in the mGluR5 gene --47
Figure 6. DNA methylation pattern of the mGluR5 gene after
6 days of repetitive restraint stress ---48
Figure 7. Schematic diagram of brain EEG telemetry
implantation and EEG recording to monitor
circadian rhythms ---53
Figure 8.
Theta power in electroencephalograms after
exposure to repetitive restraint stress ---54
Figure 9. Real-time EEG monitoring on Days 1 and 6 ---56
Figure 10.
Corticosterone blood concentrations after exposure
Figure 11. The mGluR5 antagonist, MPEP, blocks responses
after repetitive restraint stress ---61
LIST OF TABLE
Table 1. An occurrence of helplessness behavior in the
exposure to footshocks in PNDs 14 and 90 ---33
1
ABSTRACT
Role of hippocampal metabotropic glutamate receptor 5 (mGluR5) in stress-induced response: physiological and behavioral analyses
Yeong Shin Yim
Department of Medical Science, The Graduate School, Yonsei University
(Directed by Professor Dong Goo Kim)
An individual’s behavior is generally based on genetic blueprint and previous experiences. A coping strategy, affected by personal interpretation of past events, can be determined by behavioral controllability of stress. In this study, I investigated the role of mGluR5 in stress-induced physiological and behavioral responses by using two different behavioral models; the helplessness paradigm and the restraint stress model.
An increased or decreased mGluR5 expression was found in the hippocampus of the repetitive exposure to the uncontrollable stressor. An increased mGluR5 protein expression level is accompanied by the helplessness
2
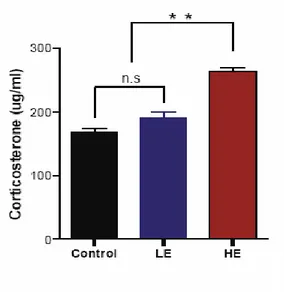
(HL) (+) behavior, a decreased EEG theta power and an increased blood corticosterone concentration, suggesting the negative adaptation to the stressor. In contrast, a decreased mGluR5 protein expression level is accompanied by the HL (-) behavior, no changed EEG and no changed corticosterone level, suggesting the positive adaptation to the stressor.
Moreover, the increased mGluR5 protein expression level is positively related to the increased mGluR5 mRNA level, no changed DNA methyltransferase (DNMT) 3a mRNA level, and a decreased methylation site in the CpG island of the mGluR5 gene, while decreased mGluR5 protein expression level is positively related to the decreased mGluR5 mRNA level, the increased DNMT 3a mRNA level, and increased DNA methylation sites of the mGluR5 gene.
Thus these results suggest that mGluR5, one of the candidate molecules modulating specific forms of memory, played a critical role in the development of controllability-dependent stress coping strategies, and epigenetic modulation of mGluR5 gene is involved in the adaptation mechanism.
3
Role of hippocampal metabotropic glutamate receptor 5 (mGluR5) in stress-induced response: physiological and behavioral analyses
Yeong Shin Yim
Department of Medical Science, The Graduate School, Yonsei University
(Directed by Professor Dong Goo Kim)
I. INTRODUCTION
When organisms are under stress, they develop a coping strategy, either controllable or uncontrollable, which is manifested via their behaviors. Eventually, those who are able to control stress specialize their behaviors to escape or prevent stressful situations and those who are unable to control stress reorganize the associative part of the brain for the acquisition of new behavioral strategies to adapt stressful situations1.
Once an individual pattern to cope with a stressor is established, it can maintain for a long time, sometimes throughout one's whole life. It is assumed
4
that a genetic change is involved in this long-term biological change. Among many possible genetic changes, epigenetic changes are focused, because epigenetic regulation allows for an integration of intrinsic and environmental signals in the genome that are not attributable to changes in the primary DNA sequence2-4. A greater emphasis has been placed on the role of epigenetic mechanisms in facilitating the adaptation of an organism to changing environments through regulation of gene expression level. It seems that epigenetic modulation is deeply involved in establishing coping strategy to repetitive stress when memory function is needed to establish a new strategy.
When an organism is exposed to the same stressor repeatedly, its coping strategy to the facing stressor depends on previous experience of the stress episode. The memory of the previous stress episode will be the key determinant of the coping strategy, such as memory of resisting stress or exhaustion by the stress. Metabotropic glutamate receptor 5 (mGluR5) is a candidate molecule for the establishment of coping strategy because mGluR5 is crucially related with the acquisition of new memory, especially when confronted with the previous memory5.
In this study, I hypothesized that epigenetic change of mGluR5 induced by the stress episode is crucial for the establishment and maintenance of the coping strategy to the similar subsequent stress episode.
5
1. Stress and stress response
1) General Adaptation Syndrome and Central Adaptation Syndrome
The General Adaptation Syndrome (GAS) was developed by Hans Selye6. The GAS is divided into three phases; alarm, resistance, and exhaustion phases. During the alarm reaction phase, a stressor disturbs homeostasis and the brain subconsciously perceives the stressor and prepares the body either to fight or to run away. Then, the reaction moves to the resistance phase where it attempts to cope by using mechanisms of protection and defend the stress. In the ‘exhaustion’ phase, the organism’s resources are eventually depleted and the organism is unable to maintain normal function. The initial autonomic nervous system symptoms, such as sweating and raised heart rate, may reappear. Selye also distinguished two types of stress, ‘eustress’ and ‘distress’. Eustresses enhance function, for example through challenging work, whereas distresses refer to persistent stresses that are not resolved through coping or adaptation and may lead to illnesses, for example anxiety or depression.
The Central Adaptation Syndrome (CAS), developed by Huether7, described the differential effects of controllable and uncontrollable stress on neural structures. According to this theory, stress affects the brain and changes
6
brain structures. The strength of the stress reaction and of its short-term and long-term effects depend on the controllability of the stressor. Controllable stress triggers the facilitation of neuronal networks involved in the generation of appropriate patterns of coping, whereas uncontrollable stress favors the extinction of inappropriate patterns and the reorganization of neuronal connections underlying certain inappropriate behaviors. Therefore, both controllable and uncontrollable stress response processes are inherent challenges to the development of an individual’s behavior.
2) Stress response
The stress response is mediated by the hypothalamic-pituitary-adreno cortical axis that regulates the production and release of corticosterones in the adrenal cortex. And, the stressor evokes cellular mediators that can promote adaptation when the response is efficiently turned on and shut off, but which can also promote pathophysiological processes when the response is overused or dysregulated8. Not only the brain is central in the adaptation to stress, as it perceives and determines what is threatening, and orchestrates the behavioral and physiological responses to the stressor, but also the brain is a target of stress. Animal studies have shown stress-induced remodeling of brain architecture, such as dendritic atrophy and loss of dendritic spines in neuronal populations8-10.
7
Also, depending on the age of the animal at the time of exposure and the duration and type of stressor experienced, stressor has often divergent effects on stress responses. In relation to these effects, stress is known to influence several distinct cognitive processes, including spatial, declarative, and emotional memories. However, the underlying mechanism of these effects is not clear.
3) Animal model
Early life and repeated chronic stressors have been linked to chronically high levels of corticotropin-releasing-hormone in human and animal studies. And finally these are associated with long-lasting interrelated genetic changes in the central nervous system11,12. In this study, the HL paradigm and the repetitive restraint stress model were used.
A HL paradigm was developed from the learned helplessness theory created by Seligman and Maier, which provided a methodological means to study biochemical and physiological correlates of depressive-like behavior of animals. Animals showed HL behavior after repetitive exposure to uncontrollable and unpedictable electric footshocks13. Similar to the learned helplessness theory, the HL paradigm provided an easy classification of the responses into 2 large groups in which animals show HL behavior or not, when footshock stress is applied. HL (-) behavior is considered as the positive coping
8
response and HL (+) behavior as the negative coping response. In particular, HL (+) behavior was regarded as a manifestation of depressive-like behavior similar to the helplessness theory in which freezing was interpreted as the behavioral manifestation to the uncontrollable stressor in the fear conditioning paradigm14. The advantage of the HL model is able to observe the behavioral response of animals during exposure to the stress by the researcher. However,this paradigm during stress experiences is inadequate to measure the electrical activity of the brain using EEG, because EEG is interfered by the electric shock stimulation. Therefore, to monitor the real-time electrical activity of the brain, the restraint stress model was used in this study.
2. Epigenetics
The epigenetics refers to mechanisms altering gene expression that are not attributable to changes in the primary DNA sequence. Epigenetic regulation allows for an integration of intrinsic and environmental signals in the genome. Greater emphasis has recently been placed on the role of epigenetic mechanisms for facilitating the adaptation of organisms to changing environments through the regulation of gene expression level2,4,15,16. Mechanisms of epigenetic alterations include changes in DNA methylation and associated histone
9
modifications that influence the chromatin states and impact gene expression patterns17.
1) DNA methylation
DNA methylation involves the addition of a methyl group to the 5’- position of the cytosine within “CpG” sites. CpG sites are often found in clusters within DNA regions and referred to as CpG islands. It is composed of at least 200 base pairs, of which greater than 50% are CpG sites18. CpG islands are present at several gene promoters or coding region, and are often the focus of active DNA methylation and demethylation. In addition, CpG islands occur within intragenic DNA regions and subsequently affect transcriptional activity19. In principle, a DNA methylation state is associated with gene silencing20.
DNA methylation is mediated by DNA methyltransferases (DNMT), and S-adenosyl methionine (SAM) serves as the methyl donor. Three active DNMTs have been identified in mammals; DNMT 1, DNMT3a, and DNMT3b. DNMT1 is the most abundant DNMT, and preferential for maintenance methyltransferase. DNMT3a and DNMT3b are responsible for de novo methylation21.
DNA methylation has been studied extensively in the area of development because it is a static process following cell differentiation. Because the mammalian brain primarily consists of post-mitotic neurons and glial cells, most
10
neuroscience researches have not focused on brain epigenetics; however, high levels of DNMT mRNA have recently been reported in adult mammalian brains22. This finding raised the possibility that certain brain functions could be regulated by DNA methylation catalyzed by DNMT enzymatic activity. In fact, it has been recently reported that brain DNMT activity or DNA methylation could influence memory formation.
DNA methylation is also a two-faced modification resulting in either gene repression or activation. Generally, a hypermethylated DNA state is normally associated with gene silencing, whereas a hypomethylated DNA state is associated with active gene expression23.
2) Histone modification
Eukaryotic genomes are organized into chromatins, in which DNA sequences wrap around histone octamers to form nucleosomes. The H3 and H4 histones have long tails protruding from the nucleosome, which can be covalently modified at several places. Modifications of the histone tail include methylation, acetylation, phosphorylation, ubiquitination, and SUMOylation. The core of the histones H2A, H2B, and H3 can also be modified. Modification of histone proteins is another widely studied epigenetic mechanism that regulates the interconversion between the silenced heterochromatin state and the
11
actively transcribed euchromatin state.
3) Epigenetics and stress
Initial studies investigating learning-induced histone alterations within the adult brain have demonstrated a direct relationship between histone acetylation and the expression of several memory-related genes. Further analysis of the histone microenvironment has also revealed a role for histone phosphorylation occurring in concert with histone acetylation to regulate gene expression changes during fear memory consolidation. Abnormal regulation of histone methylation can result in cognitive decline that in associated with neuropsychiatric disorders, and hence the chromatin-modifying enzymes may also serve as potential therapeutic targets24.
In addition, fear conditioning is associated with the DNA methylation of the memory suppressor genes, protein phosphatase and calcineurin, and the demethylation of the synaptic plasticity gene, reelin21,25. After contextual fear conditioning, DNMT expression in the hippocampus increased, and the DNMT inhibitors, 5-azadeoxycytidine or zebularine, blocked fear memory formation25. DNA methylation is more suitable than histone modification to investigate the epigenetic changes on local specific DNA. Therefore, the DNA methylation was used to observe the effect of environmental stimuli on specific gene.
12
3. Glutamate receptor
Glutamate, the amino acid, is known as the main excitatory neurotransmitter in the mammalian brain. It is released from synapses, and binds to neurons, and thereby activates cell surface receptors. These receptors are characterized as either ionotropic or metabotropic.
1) Ionotropic glutamate receptor
Ionotropic glutamate receptors (iGluRs) are the principal mediators of excitatory neurotransmission. The iGluR is divided into three subtypes, named according to their selective agonists: a-amino-3-hydroxyl-5-methylisoxazol-4-proprionate (AMPA), N-methyl-D-aspartate (NMDA) and kainate (KA). All these receptors pass ions that depolarize neuronal plasma membranes. However, they perform very distinct functions at the synapse and in neural processing. AMPA receptors are found in most excitatory synapses and mediate fast excitatory neurotransmission. Activation of NMDA receptors depends on the coincidence of presynaptic activity (release of glutamate, presence of the co-agonist glycine) and postsynaptic activity (membrane depolarization by
13
AMPA/KA or other excitatory inputs). Overstimulation of these receptors by glutamate is thought to be a major mechanism for Ca2+ overload in neurons, which mediates neuronal injury and death26,27.
2) Metabotropic glutamate receptor
Metabotropic glutamate receptors (mGluRs) are G-protein coupled receptors (GPCR), which activate intracellular secondary messenger systems when bound by the physiological ligand, glutamate. Activation of mGluRs results in modulating and fine-tuning effects on ion channel function changed via synaptic plasticity and excitotoxicity28,29.
The mGluRs consist of eight receptor subtypes, which are divided into three groups, based on sequence homology, signal transduction pathways and pharmacological properties. Group I mGluRs (mGluR1 and mGluR5) are coupled to phospholipase C, resulting in an intracellular Ca2+ signalling. Group II (mGluR2 and mGluR3) and group III (mGluR4, mGluR6, mGluR7 and mGluR8) mGluRs inhibit adenylate cyclase.
The mGluRs have three distinctly separated topological domains: an extracellular hydrophilic N-terminal domain, transmembrane domain, and a variable intracellular C-terminal domain. The extracellular domain contributes to glutamate binding, agonist activation of the receptor and subtype specificity
14
for group selective agonists. Extracellular and intracellular domains are connected by seven transmembrane domains located hydrophobic segments. The second intracellular loop and the amino portion of the C-terminal tail contribute to G-protein coupling. However, the first and the third intracellular loop seem to play an important role in G-protein activation30. The presence of numerous phosphorylation sites at the C-terminus suggests it has targets for several types of kinases that regulate receptor activity. All mGluR subtypes show amino acid sequence similarity and conservation of the 19 cysteine residues31.
The mGluRs are widely expressed throughout the central nervous system (CNS). Each subtype is specifically distributed in certain brain regions29. mGluRl is highly expressed in the cerebellum, the ventral pallidum and the substantia nigra, and mGluR5 is expressed in the striatum, the hippocampus and the cortex. Group II mGluRs are primarily distributed in the forebrain region and group III mGluRs are widely expressed throughout the CNS, except mGluR6, which is essentially expressed in the retina.
3) Glutamate receptor and stress
Corticosterones, released from the adrenal glands, secreted during the diurnal rhythm and during stress. Corticosterones can bind, with different
15
affinities, to the glucocorticoid receptor and the mineralocorticoid receptor. When released to blood, corticosterones can result in non-genomic effects (mediated by membrane receptors), indirect genomic effects (mediated by membrane receptors and second messengers), and genomic effects (mediated by cytoplasmic receptors that move to the nucleus and act as transcription factors)32,33. Corticosterones rapidly induce glutamate release in the hippocampus through a mechanism that may involve a membrane associated form of the mineralocorticoid receptor34,35. An indirect way by which corticosterones can influence neurotransmission (glutamatergic, GABAergic, cholinergic, noradrenergic and serotonergic) is through crosstalk with the endocannabinoid system36.
Acute exposure to the restraint stress rapidly increases glutamate release in the hippocampus37. And, using patch-clamp recordings, application of 100 nM corticosterone to hippocampal slices rapidly enhanced the frequency of miniature excitatory postsynaptic potentials in CA1 pyramidal neurons, suggesting that corticosterone increases glutamate release probability in the hippocampus38. As discussed above, stress acutely enhances glutamate release in the hippocampus. However, the effects of chronic stress on glutamate release are still mostly unknown.
Not only glutamate release was affected by the stressor, but also total expression level or synaptic expression level of the glutamate receptors
16
influenced by the stressor. Acute stress has a delayed and sustained impact on postsynaptic glutamate receptor, causing a rapid and transient increase in presynaptic glutamate release 40,41. Acute stress or corticosterone treatment increases AMPAR and NMDAR responses, but more selectively enhances AMPAR-mediated currents in CA1 neurons than NMDAR mediated currents41,42. Glutamate, released during stress, also primes hippocampal excitability by activating mGluR1 and mGluR5, and thus causes a sustained reduction of the activation threshold for forthcoming hippocampal inputs7. After exposure to the chronic mild stress during 9 days, the level of mGluR5 receptor protein was increased in CA1 and decreased in CA3 region of the hippocampus43. However, the reason for the changes of the mGluR5 expression level is not yet known.
4. Aim of this study
When an organism is exposed to a stressor repetitively, it develops individually different stress response depending on whether the stressor can be controlled or not. The purpose of the study was to investigate the mechanism of individual differences in the coping strategy to the same environmental stressful stimulus. Two behavioral models were used in this study. The modified HL
17
paradigm was used for studying behavioral changes according to the differential expression of mGluR5 protein, and repetitive restraint stress model was used for investigating underlying mechanism.
18
II MATERIALS AND METHODS
Experiment 1. Hippocampal mGluR5 in the helplessness behavior after repetitive exposure to uncontrollable stressor
1. Animals and housing
The Sprague-Dawley(SD) rats used for breeding were supplied by the Division of Laboratory Animal Medicine, Yonsei University College of Medicine. All animal experiments were approved by the Committee for the Care and Use of Laboratory Animals at Yonsei University (Project license number: #00062). Rats were cared for in accordance with the Guide for Animal Experiments as well as with the NIH Guide for the Care and Use of Laboratory Animals. All animals were raised in a Specific Pathogen Free (SPF) environment, with maintained temperature (22 ± 1°C), controlled humidity (55%), and a 12:12 hour light/dark cycle (with light starting at 7:00 am). The day pups were found in the cage was referred to as postnatal day (PND) 0. On PND 2, litters were culled to eight with an equal sex ratio based on Latin square method from different 12 females, if possible. On PND 12, animals were weaned, and pair-housed throughout the experiment. And, a litter
19
was comprised 6 male rats.
2. Exposure to electric footshock
Male SD rats were divided into two groups: the shock-exposed group and the control group. A rat of the shock-exposed group received inescapable and unpredictable footshocks twice (on PND 14 and PND 90) in an electric footshock chamber (20.5 × 17 × 20 cm). The shock chamber was equipped with metal rod (stainless steel) flooring connected to a shock generator and a grid scrambler (ENV-412, Med Associates, VT, USA). The control group was neither put into the chamber nor exposed to electric footshock. Rats were handled and weighed every ten days. And prior to the footshock exposure, they were handled every day. On both footshock exposure days, electric footshocks were randomly administered 40 times by as a 4 sec scrambled alternating current (0.8 mA), each of which was separated by an average of 60 sec interval (randomly ranging from 30 to 90 sec and averaging 60 sec).
20
Helplessness behavior was measured by observation. An animals’ helplessness behaviors were defined by the following criteria:
- There was no movement (such as lifting feet to avoid a shock, climbing a wall, shrinking back as if startled, etc.) at all for 3 consecutive 4 sec shocks.
- The tail was hanging down when footshock was present.
- Once 1 and 2 are fulfilled, these conditions usually continue to be met until the last footshock.
4. Exploratory activity
Rats, from both the control and shock-exposed groups, were exposed to a new environment (50 × 50 cm) three times on PND 91 for 5 min each. They were given a 5 min break between the trials. The ambulatory activity was measured during the 5 min period in each session.
5. Immunoblotting for hippocampal mGluR5
On PND 92, rats were sacrificed and their hippocampal tissues were quickly dissected. The hippocampus was weighed and homogenized using a glass homogenizer in a volume of homogenizing buffer (0.32 M
21
sucrose, 100 mM HEPES, pH 7.4) that was five times the tissue weight. Homogenated tissue lysates were then centrifuged. The resulting supernatants were resuspended in a lysis buffer (1% triton X-100, 100 mM NaCl, 0.1% sodium dodecyl sulfate (SDS), 0.5% Na-deoxycholate), incubated for 30 min in a 4°C rotator, and then centrifuged. Protein concentrations of the samples were determined by a protein assay that used bicinchoninic acid (BCA; Pierce, CA, USA). Fifty micrograms of protein were run on a sodium dodecyl sulfate-polyacrylamide (SDS-PAGE) gel and blotted onto polyvinylidene fluoride (PVDF) membranes in a methanol-based tris-glycine buffer. Membranes were then blocked with 5% non-fat milk (Bio-Rad). Each of the primary antibodies (anti-mGluR5 against mGluR5 C-terminus peptide; anti-beta actin, Santa Cruz, USA) was suspended in 1% non-fat milk and incubated over the membrane with continuous mixing for 2 hrs at room temperature or overnight at 4°C. Membranes were rinsed at least three times with tris-buffered saline (TBS) and tween 20 for 5 min each and were then incubated in 1% non-fat milk which contained a horseradish peroxidase (HRP) conjugated secondary antibody for 1 hr at room temperature. After the final TBS-T rinse, the membranes were suspended in an enhanced chemiluminescence solution (Pierce, CA, USA) and were exposed on Kodak film. Then, western blots were
22
scanned and quantified by densitometry using Scion Image Analysis Software (National Institutes of Health, Bethesda, MD, USA).
6. Statistical analysis
All data were presented as mean ± standard error of the mean (SEM). From the data, overall differences in mGluR5 expression levels were analyzed with one-way analysis of variance followed by pre-planned multiple comparison tests (Tukey-HSD). Cumulative exploratory activity was analyzed with repeated measures ANOVA. And, correlation coefficient between the mGluR5 protein expression level and exploratory activity was analyzed with Pearson’s correlation coefficient. All statistical analyses were performed with the SPSS v.18 software. Statistical significance was defined as p<0.05.
23
Experiment 2. Epigenetic modulation of hippocampal mGluR5 in establishing coping strategies after repetitive exposure to uncontrollable stressor
1. Animals and housing
Adult male Sprague-Dawley (SD) rats (9-12 wks) were used. The rats were cared for in accordance with the Guide for Animal Experiments and the NIH Guide for the Care and Use of Laboratory Animals. They were raised in a Specific Pathogen Free environment with temperatures maintained at 22 ± 1°C, controlled humidity at 55%, and a 12:12-hr light/dark cycle (with light starting at 7:00 a.m.). The protocol was approved by the Committee for the Care and Use of Laboratory Animals at Yonsei University (Project license number: #00062).
2. Schedule for exposure to restraint stress
Rats were subjected to 1 hr restraint session per day for 6 consecutive days inside cylindrical acrylic restraint tubes (8 cm diameter × 20 cm height). Control rats were left undisturbed in their home cages. For the antagonist study, a separate group of rats were injected with 0.36 µg/µl
24
MPEP into the lateral ventricle 30 min prior to stress exposure from Days 2 to 6.
3. Measurement of blood corticosterone
Blood corticosterone concentrations were measured with a radioimmunoassay kit obtained commercially (Siemens Medical Solutions Diagnostics, CA, USA). On Day 6, all rats were sacrificed between 3-4 p.m., 1 hr after the stress exposure was completed, to ensure that circadian rhythms were uninterrupted for stable basal corticosterone levels. Trunk blood was collected immediately after decapitation and was centrifuged at 1500 × g for 20 min. The serum was then removed and stored at -70°C until assay. Serum samples and 131I radiotracers were mixed in tubes containing antibody-bound corticosterone and incubated for 2 hrs at room temperature. Each of the tubes was then counted for 1 min in a Wallac 1480 Wizard 3 automatic gamma counter (Perkin-Elmer, Waltham, MA, USA).
4. Implantation surgery of EEG telemetry device and cannulae
25
Sciences, St. Paul, MN, USA) was implanted in animals anesthetized with chloropent. The device was composed of two double-wound lead wires that were attached to the transmitter body. A 3-4 cm incision was made on the dorsal midline of the head to insert the body of the electrode into the subcutaneous cavity and to place it in the flank near the midaxillary line. The two wires (silicon-insulated except the top) were threaded through 1 mm holes, respectively, which were located 2 mm away from the sagittal line on either side and 2 mm anterior to the lambda suture. The exposed tips of the lead wires were placed between the dura mater and the skull base and then secured to the skull with dental acrylic. After the surgery, animals were given a single dose of antibiotics (ampicillin, 40 mg/kg). They recovered from surgery at least 2 weeks prior to data recording.
To inject the antagonist of mGluR5, the cannulae (22G, 11mm length) was positioned for injection into the intracerebralventricular space (ICV) at 5.2 mm anteroposterior, -1.0 mm in the mediolateral, and -9.1 mm dorsoventrical from Bregma.
5. EEG recording and data analysis
26
carrier frequency of 455 KHz to the receiver plate (Model RPC-1, Data Sciences, USA), which was placed under the cage. This radio transmission was read digitally and analyzed with a data acquisition program (Data Quest A.R.T. 4.1, Data Sciences, USA). The EEG signals were recorded for 65 min (pre-exposure period: 5 min, exposure period: 60 min) each day for 6 consecutive days. The EEG acquisition and analyzing system was able to calculate the EEG variances without any data loss. The EEG signals were band-pass filtered with a low cutoff frequency of 0.5 Hz and a high cutoff frequency above 50 Hz. And then the mean value of the EEG variances for each day was calculated.
6. Immunoblotting
On Day 6, rats were sacrificed, and their hippocampal tissues were quickly dissected. The hippocampus was weighed and homogenized using a glass homogenizer in a volume of homogenizing buffer (0.32 M sucrose, 100 mM HEPES, pH 7.4) that was five times the tissue weight. Homogenate tissue lysates were then centrifuged. The resulting supernatants were resuspended in lysis buffer (1% triton X-100, 100 mM NaCl, 0.1% SDS, 0.5% Na-deoxycholate), incubated for 30 min in a 4°C rotator, and then centrifuged. The total protein concentration in each
27
sample was determined by a BCA assay (Pierce, IL, USA). Fifty micrograms of protein were run on a SDS-PAGE gel and blotted onto PVDF membranes in a methanol-based tris-glycine buffer. The membranes were then blocked with 5% non-fat milk (Bio-Rad, CA, USA). Each of the primary antibodies (anti-mGluR5 against mGluR5 C-terminus and anti-beta actin; Santa Cruz Biotechnology, Santa Cruz, CA, USA) were suspended in 1% non-fat milk and incubated over the membrane with continuous mixing overnight at 4°C. The membranes were rinsed at least three times with TBS and tween 20 for 5 min each and then incubated in 1% non-fat milk containing a HRP conjugated secondary antibody for 1 hr at room temperature. After the final TBS-T rinse, the membranes were suspended in an enhanced chemiluminescence solution (Pierce, IL, USA) and exposed to Kodak film. The western blots were scanned and quantified by densitometry using Scion Image Analysis Software (National Institutes of Health, Bethesda, MD, USA).
7. RNA preparation and cDNA conversion
For RNA preparation (RNeasy mini kit, Qiagen, Germany), 30 mg of hippocampal tissue sample was disrupted and homogenized in 600 µl of RLT buffer. The lysate was then centrifuged for 3 min, and the
28
supernatant was saved. After adding one volume of 70% ethanol to the cleared supernatant, the sample was transferred to the RNeasy spin column and centrifuged at 8000 × g for 15 sec. The RNeasy spin column was centrifuged two more times at 8000 × g for 15 sec: once after adding 700 µl of RW1 buffer and again after adding 500 µl of RPE buffer. Finally, 30 µl of RNase-free water was added directly to the spin column membrane for RNA elution. I then used 200 ng RNA as the template for cDNA synthesis using Superscript III (Invitrogen, CA, USA).
8. Real-time PCR
To measure levels of mGluR5 and DNMT mRNA, quantitative real-time PCR was used. The expression of GAPDH mRNA served as an internal control. The real-time PCR reactions were performed with a 7500 Real-time PCR System (Applied Biosystems, CA, USA) using fluorescent SYBR Green technology (Applied Biosystems, CA, USA). Unique 18-25 bp primer pairs from coding sequences were specifically identified using Primer Express (Applied Biosystems, CA, USA). Real-time PCR was performed on 2 µl of cDNA synthesized from 200 ng of total RNA. As an endogenous control, primers were constructed to detect the ubiquitously expressed GAPDH message.
29
9. gDNA purification, sodium bisulfite treatment, and methylation analysis
The hippocampal tissue was incubated overnight with 300 µl of lysis buffer containing 30 µg of Proteinase K at 55ºC. Next, 100 µl of protein precipitation solution was added to the tissue, which was then vortexed for 1 min and centrifuged at 13,000 rpm for 3 min. The supernatant was transferred to a clean tube containing 300 µl of 100% isopropanol, was mixed by gentle inversion (about 50 times), and centrifuged at 13,000 rpm for 1 min. The genomic DNA, now visible as a pellet, was washed with 70% ethanol, centrifuged at 13,000 rpm twice, resuspended in 50 µl of DNA hydration solution (containing 1.5 µl of RNase A), and incubated at 37ºC for 60 min. For DNA hydration, the sample was incubated again at 65ºC for 1 hr, and 1 µg of the resulting genomic DNA was then saved for the bisulfite conversion with a commercial kit (EpiTect bisulfite kit, Qiagen, Germany). Bisulfite reactions were prepared and thoroughly mixed in PCR tubes so the bisulfite DNA conversion could be performed using a thermal cycler. For cleanup of bisulfite converted DNA, the PCR tubes containing the bisulfite reactions were briefly centrifuged, and solutions were transferred to clean 1.5 ㎖ microcentrifuge tubes. After
30
adding 560 µl of lysis buffer, the mixture was vortexed, briefly centrifuged, transferred to the corresponding EpiTect spin columns, and centrifuged at 13,000 rpm for 1 min. Then, 500 µl of wash buffer was added, and the spin column was centrifuged. Desulfonation buffer (500 µl) was also added to the spin column, incubated for 15 min at room temperature, and centrifuged. After adding 500 µl of wash buffer and centrifuging, the spin columns were then placed into clean 1.5 ㎖ microcentrifuge tubes, incubated for 5 min at 56ºC, and eluted with 20 µl of elution buffer. The direct sequencing method was used for the methylation analysis on bisulfite-treated gDNA-utilized PCR. Primers flanking the CpG island on the mGluR5 gene were designed to be bisulfite specific (i.e., primers containing non-CpG cytosines such that they are not complementary to non-bisulfite-treated DNA). The nested PCR method was used to enhance the product for sequencing.
10. Statistical analysis
All data were presented as mean ± SEM. The methylation pattern of each CpG site in the matching group was tested by Pearson’s chi-squared test. Differences in mGluR5 expression levels, DNMT activity, overall methylation, theta power, and antagonist effects were analyzed with
one-31
way ANOVA followed by pre-planned multiple comparison tests (Tukey-HSD). All statistical analyses were performed with the SPSS v.18 software. Statistical significance was defined as p<0.05.
32
III RESULTS
Experiment 1. Hippocampal mGluR5 in the helplessness behavior after repetitive exposure to uncontrollable stressor
1. The relationship between helplessness behavior and the protein expression of mGluR5 after exposure to electric foot shock stress
Rats were divided into three groups based on their behavioral responses to electric footshocks on PND 14 and PND 90: 1) the control group (no exposure to footshock; n=8); 2) the HL (-) group (exposure to footshock but no signs of HL behavior during both footshock experiences; n=8); and 3) the HL (+) group (exposure to footshock that showed signs of HL behavior during both footshock experiences; n=8). The behavioral response was measured by delivering electric footshocks once on PND 14 and again on PND 90. Those that showed HL on both days and those that didn’t were selected to be used in the study.
The two days (PND 14 and PND 90) denoted their preadolescence and adulthood, respectively. Two times exposure was chosen whether the stressful experience during preadolescence would affect their behavioral controllability during adulthood if they were placed in the same situation. For this reason, only those that responded with the same pattern of behavior (i.e. HL vs. no HL) on
33
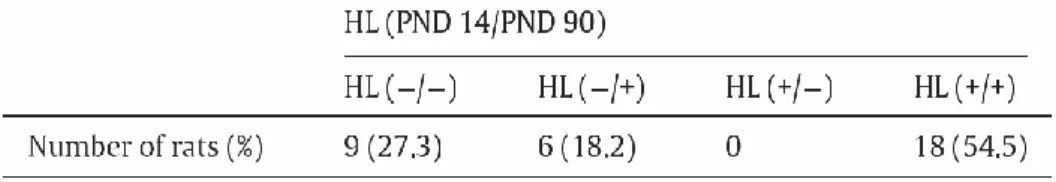
both shock days were used in this experiment. Out of all the animals that were given the same stressor on both days, 81.8 % (27 out of 33 rats) of them showed the same behavior during the second footshock as they did during the first. And among these, 66.7 % (18 out of 27 rats) manifested HL (+) behavior and the rest displayed HL (-) behavior during both shock periods (Table 1).
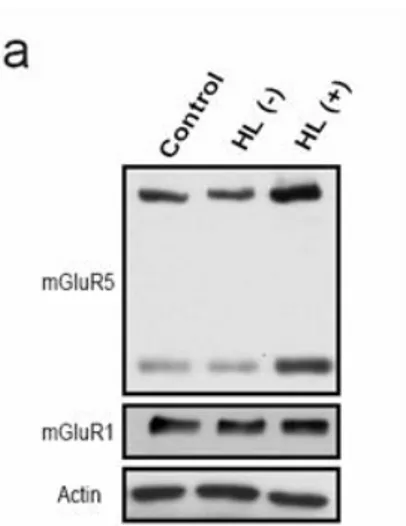
Interestingly, the presence or absence of HL behavior was found to be closely related to the expression of hippocampal mGluR5. The Western blot analysis of mGluR5 protein showed two bands, in which the upper one corresponded to mGluR5 receptor dimers and the lower one mGluR5 monomers. Data for mGluR5 dimers were specifically used for density analysis. And the result showed that mGluR5 expression increased (42 ± 9.7 %) in the HL (+) group and decreased (33 ± 8.9 %) in the HL (-) group (F(2,21)=22.7, p<0.01),
compared to the control group. However, the mGluR1, which belongs to Group I mGluR, protein expression level was not changed in HL (-) and HL (+) groups compared with control group (HL (-) group; 95 ± 5.7 %, HL (+) group; 102 ± 7.3 %) (Figure 1).
34
Table 1. An occurrence of helplessness behavior in the exposure to
footshocks in PNDs 14 and 90.
Rats showed helplessness positive (+) and negative (-) behaviors. Total
33 rats enrolled and 81.8 % of them showed the same behavior during the
second footshock as they did during the first.
35
Figure 1. Protein expression of mGluR5 in the hippocampus. (a) mGluR5 protein expression level. Two bands were detected for mGluR5; dimers and monomers. (b) Quantification plot for dimeric mGluR5. Compared to the control group, hippocampal mGluR5 expression level increased in the HL (+)
36
group and decreased in the HL (-) group. (c) Quantification plot for mGluR1. Compared to the control group, hippocampal mGluR1 expression level was not changed in the HL (+) and HL (-) groups. Data are represented as means + SEM (ANOVA/Tukey-HSD post hoc test *p<0.05, **p<0.01).
37
2. The exploratory activity after exposure to electric footshock stress
The exploratory activity, which was tested two days after shock deliverance, gradually decreased in the control and HL (-) groups throughout the repeated trials. However, in the HL (+) group, there was no decrease in exploratory activity (F(8,63)=4.7, p<0.01, One-way ANOVA) (Figure 2a). The
high level of exploratory activity of the HL (+) group implied that there was a lack of adaptation to the novel environment. On the third trial, the HL (+) group showed higher exploratory activity than other groups (F(8,63)=4.7, p<0.01, vs. the
HL(-) group). In the analysis of individual rats, the mGluR5 protein expression levels showed a strong positive correlation with the sum of 3 trials’ exploratory activities in each rat (Pearson’s correlation coefficient, r=0.832, p<0.01) (Figure 2b).
38
Figure 2. Exploratory activity in a novel environment. (a) Exploration during 5 min in each 3 trials. Rats were exposed to the same environment three times on PND 91. Exploratory activity decreased gradually as the trial was repeated in the control and the HL (-) group, while the HL (+) group did not show any decrease in ambulatory activity during the repeated trials. Data are represented as means ± SEM (ANOVA/Tukey-HSD post hoc test, *P<0.05, **P<0.01). (b) The correlation between the mGluR5 protein expression levels and exploratory activities. The mGluR5 protein expression levels are positively correlated with the cumulative exploratory activities in each rat (Pearson’s correlation coefficient, r=0.832, p<0.01).
39
Experiment 2. Epigenetic modulation of hippocampal mGluR5 in establishing coping strategies after repetitive exposure to uncontrollable stressor
1. Individual differences in mGluR5 protein and mRNA expression after repetitive exposure to restraint stress
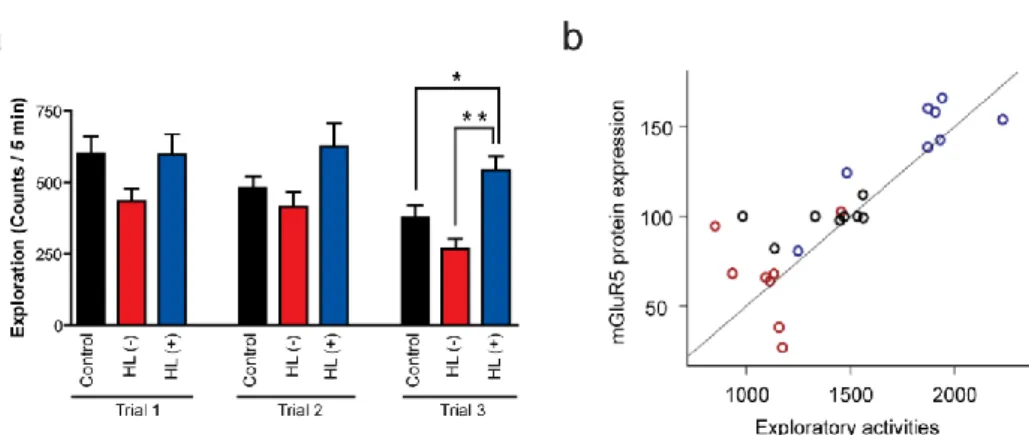
To determine whether repetitive exposure to a stressful environment could mediate individual differences in the protein expression of mGluR5, 60 rats were repetitively exposed to restraint stress for 1hr per day for 6 consecutive days. After the final stress exposure, the rats were sacrificed and the hippocampus was prepared for measuring mGluR5 protein expression. The mGluR5 protein level varied from 20.95% to 210.65% (mean 113.78%) of the control group which was not exposed to restraint stress. Two groups were selected according to the mGluR5 protein expression level: the low expression group (LE, 10 rats with the lowest mGluR5 expression level) and the high expression group (HE, 10 rats with the highest mGluR5 expression) (Figure 3a-c). The protein expression level in the LE group was 36.34 ± 3.04% (p<0.01) of the control group, and the level in the HE group was 191.53 ± 4.02% of the control group (p<0.01). Real-time PCR analysis revealed that the mGluR5 mRNA levels in the LE group were low (41.41 ± 10.36%, p<0.01) compared to
40
the control group, while the levels in the HE group were high (174.09 ± 11.38%,
p<0.01) (Figure 3d). Evidently, mGluR5 protein and mRNA expression levels
41
Figure 3. Individual differences in the protein and mRNA expression of mGluR5 after repetitive exposure to restraint stress for 6 days. Rats were sacrificed 1 hr after the last restraint stress exposure on Day 6, and hippocampi were obtained for the analyses. (a) Individual plot of mGluR5 protein expression in the hippocampus. Each gray circle represents one rat. The mGluR5 protein expression was widely distributed compared to the control
42
group, not exposed to restraint stress. Ten rats with higher mGluR5 expression levels were chosen as the high expression (HE) group, and 10 rats with lower mGluR5 expression levels were chosen as the low expression (LE) group. (b) mGluR5 protein expression levels in the hippocampus. Two bands were detected for mGluR5 by western blot; the upper one corresponds to dimeric mGluR5 and the lower to monomeric mGluR5. (c) Quantification plot for dimeric mGluR5. Hippocampal mGluR5 protein decreased in the LE group and increased in the HE group. (d) mGluR5 mRNA expression in the hippocampus. **p<0.01, one way ANOVA followed by Tukey-HSD test.
43
2. DNA methyltransferase activity after repetitive exposure to restraint stress
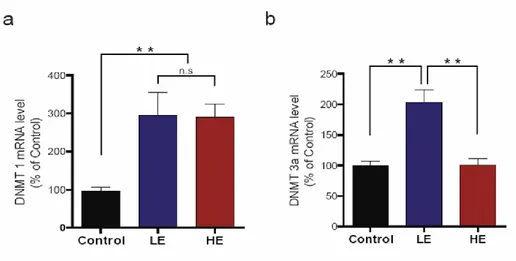
To investigate a possible role for mGluR5 gene methylation in the observed individual differences in post-stress mGluR5 expression, I studied whether DNMT mRNA levels in the hippocampus were altered after repetitive exposure to restraint stress. The mRNA levels for two DNMT subtypes, DNMT 1 and DNMT 3a, were measured by real-time PCR. DNMT 1 mRNA levels were increased in both groups after repetitive exposure to restraint stress (p<0.01) and showed no group differences (LE; 295.9 ± 58.4%, HE; 290.1 ± 35.0%) (Figure 4a). Interestingly, the DNMT 3a mRNA levels increased two fold in the LE group (202.7 ± 20.9%, p<0.01), while the levels in the HE group (101.2 ± 10.3%) did not change (Figure 4b). These results indicate that an increase in DNMT 3a mRNA is associated with a decrease in mGluR5 expression.
44
Figure 4. DNA methyltransferase (DNMT) activity after repetitive exposure to restraint stress for 6 days. DNMT 1 and DNMT3a mRNA levels were measured by real-time PCR. (a) Level of DNMT 1 mRNA expression. The DNMT 1 mRNA levels were increased in both groups after exposure to repetitive restraint stress, and no group differences were observed. (b) Level of DNMT3a mRNA expression. The DNMT3a mRNA levels increased in the low expression (LE) group but not in the high expression (HE) group. **p<0.01, one way ANOVA followed by Tukey-HSD test.
45
3. DNA methylation pattern of the mGluR5 gene after repetitive exposure to restraint stress
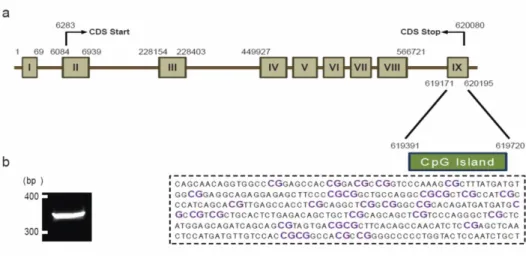
To elucidate whether an epigenetic mechanism is involved in the regulation of mGluR5 expression after repetitive exposure to stress, the DNA methylation of the CpG island on the mGluR5 gene was analyzed. Computational analysis predicted one CpG island located within the mGluR5 gene. This CpG island contains 31 CpG sites within a stretch of 330 bp in exon IX in the rat mGluR5 gene. To investigate the DNA methylation status, bisulfite conversion and DNA sequencing were used, as they are capable of providing detailed information about methylation status at single CpG site resolution (Figure 5).
In the control group, about 20% of all 31 CpG sites were methylated (20.64 ± 4.5%, n=10), suggesting the existence of natural DNA methylation. This epigenetic modulation appears to be necessary to manage ordinary life in rats. Notably, a remarkable increase in CpG methylation sites (58.38 ± 3.7%,
p<0.01) was found in the LE group, whereas those in the HE group showed
similar levels to the control group (16.13 ± 2.94%) (Figure 6a). Therefore, the results showed that the overall increase in the methylation rate of the CpG island was associated with a decrease in mGluR5 protein and mRNA levels in the LE group.
46
Next, to identify which CpG sites are directly responsible for mGluR5 expression, the methylation status of each CpG site within a CpG island was analyzed. I analyzed each methylation site as a decreased, unchanged, or increased methylation site compared with the degree of methylation in the matching CpG site in the comparison group. Three comparisons with Pearson’s Chi-square test was performed: control vs. LE, control vs. HE, and LE vs. HE. Twelve (CpGs 3, 5, 9, 10, 11, 12, 14, 16, 18, 19, 22, and 30) out of the 31CpG sites in the LE group showed increased methylation compared with the control group (p<0.05), and no decreased sites were observed. Interestingly, the HE group showed decreased methylation at only one site (CpG 24) compared with the controls; although, the overall methylation rates in the HE group were not different from the controls. When comparing the HE and LE groups, 16 CpG sites (CpGs 5, 9, 10, 11, 12, 13, 14, 16, 17, 18, 19, 22, 24, 25, 29, and 30) in the HE group showed a decreased degree of methylation (p<0.05) (Figure 6b,c). Therefore, I speculated that the increased methylation of 11 CpG sites in the LE group (CpGs 5, 9, 10, 11, 12, 14, 16, 18, 19, 22, and 30) was likely responsible for the decreased mGluR5 protein and mRNA expression after exposure to repetitive stress. Particularly, the CpG 24 site was the only site in the HE group showing decreased methylation post-stress, because this site may be important of increasing the expression of mGluR5 protein and mRNA. These results indicate that alterations in the methylation of the mGluR5 gene are associated
47
48
Figure 5. Prediction of CpG islands in the mGluR5 gene. (a) Location of predicted CpG island in the mGluR5 gene. Computational analysis predicted one CpG island in the mGluR5 gene, which contains 31 CpG sites within a stretch of 330 bp in exon IX. (b) PCR product of CpG island. For the investigation of DNA methylation patterns, bisulfite conversion and PCR amplification of the CpG island were conducted. PCR product size is 330 bp.
50
Figure 6. DNA methylation pattern of the mGluR5 gene after 6 days of repetitive restraint stress. (a) Percentage of overall mGluR5 gene methylation. The control group showed methylation of about 20% of the CpG island. The overall methylation of the CpG island increased in the low expression (LE) group compared to the control and high expression (HE) groups. **p<0.01, one way ANOVA followed by Tukey-HSD test. (b) Site specific analysis of GluR5 gene methylation patterns. Compared to the control group, the LE group exhibited 12 hypermethylated CpG sites (#3, 5, 9, 10, 11, 12, 14, 16, 18, 19, 22, and 30), and the HE group showed one hypomethylated site (#24). The LE group showed 16 hypermethylated CpG sites (# 5, 9, 10, 11, 12, 13, 14, 16, 17, 18, 19, 22, 24, 25, 29, and 30) compared to the HE group (Pearson’s Chi-square test, p<0.05 is the significance level). (c) CpG island methylation pattern for each rat from the three groups. The X axis indicates animal numbers (n=10 per group), and the Y axis indicates the CpG sites (31 sites). The white square denotes unmethylated CpG site, and dark square shows methylated CpG site.
51
4. Theta power in electroencephalograms after repetitive exposure to restraint stress
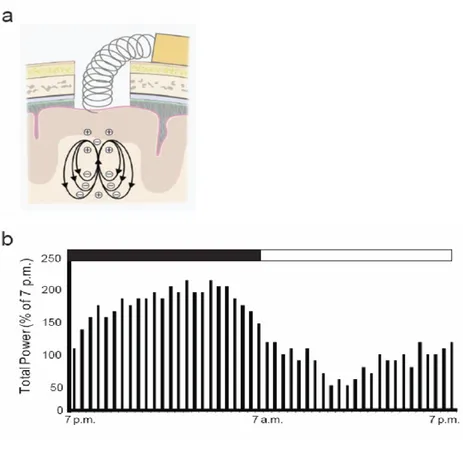
To determine whether different levels of mGluR5 expression after repetitive stress are associated with varied brain activities, EEG using a wireless telemetry system was performed. The real-time EEG responses of animals were recorded. Positive and negative poles for the EEG recordings were placed on the surface of the dura mater inside a drilled hole, which was located 2 mm lateral to the sagittal suture and 2 mm anterior to the lambda suture (Figure 7a). Circadian rhythms were monitored 2 weeks after the implantation of the telemetry device for EEG recordings. The EEG total power rose during the dark phase and declined toward the end of the dark phase. The total power during the light phase was lower, with occasional higher values (Figure 7b). This pattern allowed us to confirm that the recording device was implanted correctly and the general condition of the rats after surgery was appropriate. The EEGs were monitored during the pre-exposure period (5 min immediately before stress exposure) and the exposure period (60 min exposure to the stress) to restraint stress for all 6 days (Figure 8a). The EEG recording from the pre-exposure period on Day 1 were considered to represent basal brain activity, and the EEGs from the pre-exposure period on Day 6 were considered basal brain activity after 5 days of repetitive exposure to the stress.
52
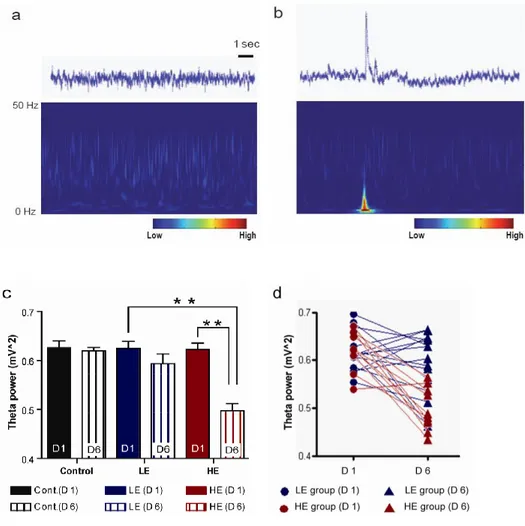
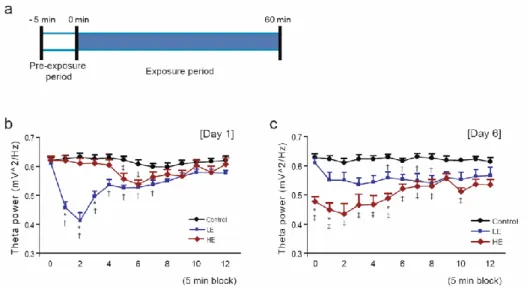
When the rats were restrained, the EEG waves exhibited unique peak deviants from those detected during the pre-exposure period on Day 1 (Figure 9a,b). To investigate which frequencies of brain waves (e.g., delta, theta, alpha, beta, or gamma) were responsible for this unique peak, the raw EEG data was analyzed by using the MATLAB software. The analysis revealed that the EEG theta frequency showed increased power at the peak during the stress exposure condition (Figure 9a,b). Then EEG analysis was focused on the theta power in the pre-exposure and exposure periods on Days 1 and 6. The theta power during the pre-exposure period on Day 1 did not differ between the LE and the HE groups (control: 0.62 ± 0.01 mV2, LE: 0.61 ± 0.01 mV2, HE: 0.62 ± 0.013 mV2). Interestingly, after exposure to repetitive stress, two different EEG patterns were observed during the pre-exposure period. On Day 6, the theta power in the HE group was reduced by 21% compared to Day 1 (p<0.01), whereas the theta power in the LE group was not changed (control: 0.63 ± 0.013 mV2, LE: 0.61 ± 0.015 mV2, HE: 0.48 ± 0.016 mV2) (Figure 9c). When the effect of stress exposure was plotted as individual changes in EEG theta power, 9 out of 10 rats showed decreased power after repetitive exposure to stress, whereas the LE group showed variable directions of change in theta power (Figure 9d).
The theta power was analyzed during the exposure periods on Days 1 and 6. These data were divided into 5 min intervals for the entire 60 min exposure period. On Day 1, in the LE group, an exposure to stress initially decreased the
53
theta power to 35% of pre-exposure period levels followed by a subsequent gradual increase; however, the theta power of the HE group decreased late in the 6th block to 11% of pre-exposure period levels and gradually increased. On Day 6, the theta power of the HE group, compared to the control group, decreased in almost all blocks during the exposure period and that of the LE group decreased only in the 5th-8th blocks during the exposure period. Moreover, the theta power of the HE group was less than that of the LE group in the 1st and 5th blocks (Figure 8b,c). These EEG data indicate that brain activity can be altered by repetitive exposure to stress, and the theta power is negatively correlated with the mGluR5 expression after repetitive exposure to stress.
54
Figure 7. Schematic diagram of brain EEG telemetry implantation and EEG recording to monitor circadian rhythms. (a) Diagram of lead implantation. Positive and negative poles were placed on the surface of the dura mater inside the drilled hole located 2 mm lateral to the sagittal suture and 2 mm anterior to the lambda suture. (b) Rat circadian rhythm. Two weeks after device implantation, circadian rhythm was monitored by EEG. During the dark phase, the total EEG power initially rose and eventually declined toward the end of the dark phase. During the light phase, the total power was low with occasional higher values.
55
Figure 8. Theta power in electroencephalograms after exposure to repetitive restraint stress. (a) EEG trace and spectral analysis during the pre-exposure period on Day 1. The EEG waves indicated basal condition when animals were not stressed. The upper panel shows the raw EEG trace, and the lower panel represents spectral analysis using MATLAB. (b) EEG trace and spectral analysis during the exposure period on Day 1. When rats were restrained, the raw EEG
56
trace shown in the upper panel depicted a unique deviant peak from those detected during the exposure period at Day 1. This peak was closely associated with increased theta power. (c) Theta power in the pre-exposure period on Days 1 and 6. Theta powers between the low expression (LE) and the high expression (HE) groups were not different during the pre-exposure period on Day 1. On Day 6, the HE group theta power was reduced, while theta power in the LE group was not changed. (d) Spaghetti plot for individual tracing on Days 1 and 6. In the HE group, the theta power decreased in 9 out of 10 rats after 5 days of repetitive stress. In contrast, the theta power changed variably in the LE group. **p<0.01, one way ANOVA followed by Tukey-HSD test.
57
Figure 9. Real-time EEG monitoring on Days 1 and 6. (a) Schedule of monitoring EEG. EEGs were monitored during the pre-exposure period (5 min immediately preceding stress exposure) and during the exposure period (60 min) to restraint stress for 6 days. Data were divided into 5-min intervals, as represented by min blocks numbered 0 to 12. The zero block indicates the 5-min pre-exposure period (from -5 5-min to 0 5-min), 1st block represents 0 5-min to 5 min, and the 12th block indicates the last 5 min of the exposure period (from 55 min to 60 min). (b) Theta power during the pre-exposure and the exposure periods on Day 1. During the pre-exposure period, the theta power did not differ between the low expression (LE) and the high expression (HE) groups. The LE group showed low EEG band power in the 2nd block after the restraint, then
58
gradually increased throughout the remaining exposure period. The theta power of the HE group decreased a little late in the 5th and the 6th blocks and gradually increased. The control group showed no changes. (c) Theta power during the pre-exposure and the exposure periods on Day 6. The HE group showed decreased theta power during the pre-exposure period. During the exposure period, the decreased theta power maintained in the HE group. However, in the LE group, a decreased theta power was observed only in the 5th-8th blocks. One way ANOVA followed by Tukey-HSD test. Control vs. LE; † p<0.05, Control vs. HE; ‡ p<0.05, LE vs. HE; *p<0.05, **p<0.01.