© 2015 The Korean Academy of Medical Sciences.
This is an Open Access article distributed under the terms of the Creative Commons Attribution Non-Commercial License (http://creativecommons.org/licenses/by-nc/4.0) pISSN 1011-8934
Risks of Lung Cancer due to Radon Exposure among the Regions
of Korea
Radon is likely the second most common cause of lung cancer after smoking. We estimated the lung cancer risk due to radon using common risk models. Based on national radon survey data, we estimated the population-attributable fraction (PAF) and the number of lung cancer deaths attributable to radon. The exposure-age duration (EAD) and exposure-age concentration (EAC) models were used. The regional average indoor radon concentration was 37.5 95 Bq/m3. The PAF for lung cancer was 8.3% (European Pooling
Study model), 13.5% in males and 20.4% in females by EAD model, and 19.5% in males and 28.2% in females by EAC model. Due to differences in smoking by gender, the PAF of radon-induced lung cancer deaths was higher in females. In the Republic of Korea, the risk of radon is not widely recognized. Thus, information about radon health risks is important and efforts are needed to decrease the associated health problems.
Keywords: Epidemiology; Lung Neoplasms; Risk Assessment; Radon; Republic of Korea
Hye Ah Lee,1 Won Kyung Lee,2
Dohee Lim,1 Su Hyun Park,1
Sun Jung Baik,1 Kyoung Ae Kong,3
Kyunghee Jung-Choi,1 and Hyesook Park1 1Department of Preventive Medicine, School of Medicine, Ewha Womans University, Seoul; 2Department of Social and Preventive Medicine, Inha University School of Medicine, Incheon; 3Ewha Clinical Trial Center, Ewha Womans University Medical Center, Seoul, Korea
Received: 27 October 2014 Accepted: 15 January 2015 Address for Correspondence: Hyesook Park, MD
Department of Preventive Medicine, School of Medicine, Ewha Womans University, 1071 Anyangcheon-ro, Yangcheon-gu, Seoul 158-710, Korea
Tel : +82.2-2650-5756, Fax: +82.2-2652-8325 E-mail : hpark@ewha.ac.kr
Funding: This study was supported by a grant of the Korean Health Technology R&D Project, Ministry of Health & Welfare, Republic of Korea (HI13C0729).
http://dx.doi.org/10.3346/jkms.2015.30.5.542 • J Korean Med Sci 2015; 30: 542-548
INTRODUCTION
The leading cause of death in Korea is cancer, and especially lung cancer. According to the annual report on causes of death statistics from the Korea National Statistics Office (KNSO), the rate of lung cancer death increased from 26.1 per 100,000 peo ple in 2002 to 33.1 per 100,000 people in 2012 (1).
Although smoking is a known major risk factor for lung can cer, several cohort studies conducted in the USA, Europe, and China, have revealed that chronic exposure to radon also con tributes to the occurrence of lung cancer (2). Indeed, the World Health Organization (WHO) reported that radon was the sec ond most common cause after smoking (2). Based on the accu mulated evidence, the International Agency for Research on Cancer (IARC) classified radon as a carcinogen in 1988 (3). For that reason, USA and European nations, through national surveys, have reported concentrations of radon and its daugh ter species. Radon is a radioactive gas of natural origin, produc ed from uranium and radium. Various levels of radon exposure occur naturally across the population. Since 1989, the Republic of Korea has also reported indoor radon concentrations (4). How ever, there has been no report on the health risks of lung cancer due to radon exposure. Although investigations on the risk of
lung cancer due to individual radon exposure are difficult, indi rectly, an ‘ecological approach’ is possible. In this way, many countries have estimated the health risks due to radon expo sure (58). Such quantification of health risks is helpful in pub lic health policy making and the allocation of resources. Thus, using risk models developed by the sixth Biological Ef fects on Ionizing Radiation Committee (“BEIRVI”) (9) and the European Pooling Study (10), we estimated the populationat tributable fraction (PAF) of radoninduced lung cancer deaths by gender across Korean administrative districts.
MATERIALS AND METHODS Radon concentration by region
In the Republic of Korea, national radon surveys were conduct ed in 1989, 2000, 20022005, and 20082009 to estimate the dose to the public. Kim et al. (4) reported the average distribution of indoor radon from these four surveys. Briefly, the sample sizes for each survey were 530, 2,953, and 970 dwellings, and 1,100 public buildings, respectively. The fourth survey was conducted in schools and local governmental offices. There were distinct differences by region, and the range of average exposures was
37.5 to 95.0 Bq/m3. The regional distribution of indoor radon
concentrations is presented in Fig. 1. The arithmetic means of the indoor radon concentrations across the 16 administrative districts for the total survey were obtained from Kim et al. (4). Lung cancer death data
Absolute numbers of lung cancer death by gender, age, and the 16 administrative districts from the years 2000 to 2012, were ob
tained from the Korea National Statistical Office (1). Lung can cer deaths in those aged over 30 yr were included. During that period, 181,510 deaths due to lung cancer occurred, 73.6% of which were males (n = 133,582). Thus, lung cancer was respon sible for 13,962 deaths per year (Table 1).
Risk assessment of the relationship between lung cancer and radon
To estimate the lung cancer risk due to radon, models devel oped by the BEIRVI Committee (9) and the European Pooling Study (10) were used. Published risk assessment studies com monly use the relationship between lung cancer and radon de rived from the miners’ cohort study in the US; this was publish ed by the BEIRVI Committee. Darby et al. (10) reported residen tial radon exposure risk for lung cancer using 13 general Euro pean population case control studies (7,148 cases of lung can cer and 14,208 controls). Later results were used in the global burden of disease study in 2010 (11).
Risk assessment based on evidence from BEIR-VI
The two linear excess relative risk models for lung cancer due to radon, developed by the BEIRVI Committee, were used to esti mate excess risk. These were based on extrapolations of risk models derived from 11 cohort studies of underground miners to the general population. These models are presented as linear functions of cumulative exposure, by either exposureagedu ration (the EAD model) or exposureageconcentration (the EAC model).
To apply the BEIRVI risk models, we assumed that all indi viduals in the same district were exposed equally and that the exposure concentrations were unchanged over their lifetime.
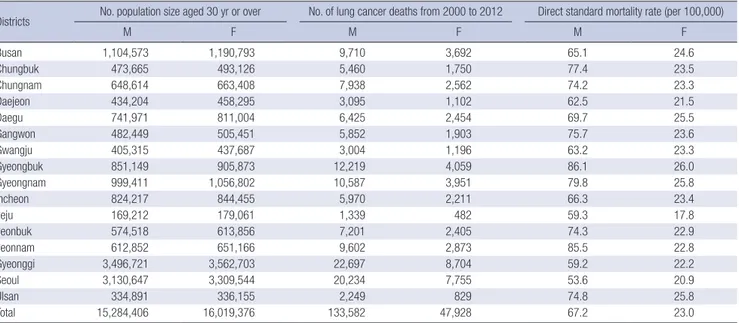
Table 1. Demographic features by regions in Republic of Korea
Districts No. population size aged 30 yr or over No. of lung cancer deaths from 2000 to 2012 Direct standard mortality rate (per 100,000)
M F M F M F Busan 1,104,573 1,190,793 9,710 3,692 65.1 24.6 Chungbuk 473,665 493,126 5,460 1,750 77.4 23.5 Chungnam 648,614 663,408 7,938 2,562 74.2 23.3 Daejeon 434,204 458,295 3,095 1,102 62.5 21.5 Daegu 741,971 811,004 6,425 2,454 69.7 25.5 Gangwon 482,449 505,451 5,852 1,903 75.7 23.6 Gwangju 405,315 437,687 3,004 1,196 63.2 23.3 Gyeongbuk 851,149 905,873 12,219 4,059 86.1 26.0 Gyeongnam 999,411 1,056,802 10,587 3,951 79.8 25.8 Incheon 824,217 844,455 5,970 2,211 66.3 23.4 Jeju 169,212 179,061 1,339 482 59.3 17.8 Jeonbuk 574,518 613,856 7,201 2,405 74.3 22.9 Jeonnam 612,852 651,166 9,602 2,873 85.5 22.8 Gyeonggi 3,496,721 3,562,703 22,697 8,704 59.2 22.2 Seoul 3,130,647 3,309,544 20,234 7,755 53.6 20.9 Ulsan 334,891 336,155 2,249 829 74.8 25.8 Total 15,284,406 16,019,376 133,582 47,928 67.2 23.0 M, male; F, female.
Fig. 1. Average radon concentration during 1989-2009 by 16 districts in Republic of Korea. Source: Kim et al. (4).
Fig. 1. 84-95 (Bq/m3) 72-84 61-72 49-61 37-49
The excess relative risk model developed by BEIRVI was as fol lows:
ERR =β (w514 + θ1524w1524 + θ25+w25+) γz,
where β indicates the risk coefficient of the exposureresponse
relationship, w indicates the exposure windows, w514, w1524, and w25+, the parameter θ is the relative contributions to risk, θ1524
and θ25+, and γz represents either exposure duration or concen
tration, which is basically the age of the person divided by the time window 514, 1524, and 25+ yr before the person’s cur rent age. Details regarding these models have been presented elsewhere (9).
As proposed by the BEIRVI Committee, the value of β was
adjusted twofold for non smokers and 0.9 times for smokers versus the general population. To consider the risk attributable to smoking, we used the calculation methods described by Ve loso et al. (8). Information about the proportion of lung cancer attributable to smoking was obtained from a large prospective Korean cohort study. In that study, Jee et al. (12) reported that the rate of death due to lung cancer among smokers was 94% for males who were current smokers, and 32% for females. In turn, to estimate the number of lung cancer deaths attrib utable to radon, we used the following formula:
Nr, a, d, s= (ERRr, a× Na, d, s)/(1 + ERRr, a),
where Nr, a, d, s indicates the number of lung cancer deaths due to radon exposure r, at age a, in district d, and for gender s. Na, d, s is the total number of lung cancer deaths at age a, in district d, and for gender s, and ERRr,a is the excess relative risk for radon expo sure r and for age a.
Risk assessment based on evidence from the European Pooling Study
The risk of lung cancer from radon derived from the European Pooling Study was expressed as a linear model. Its risk coeffi cient was adjusted for age, gender, region of residence, and smo king status. Thus, we estimated the excess relative risk with the following formula:
ERR =β × X,
where β indicates the risk coefficient of the exposureresponse
relationship, and X is the mean radon concentration by district. The PAF and number of lung cancer deaths attributable to ra don were estimated as recommended by WHO (13).
RESULTS
The average indoor radon concentration across the 16 adminis trative districts is presented in Fig. 1. The average indoor radon level was 62.1 Bq/m3 and it was differed by district. The concen
trations was highest in Chungbuk (95 Bq/m3) and lowest in Bu
san (37.5 Bq/m3). During the period 20002010, the adjusted
lung cancer mortality rate was highest in Gyeongbuk for both genders (Table 1).
Table 2 provides the estimated regional risk of lung cancer due to radon by applying exposureresponse relationships. Re gardless of smoking status, indoor radon accounted for 13.5% 19.5% and 20.4%28.2% of lung cancer deaths in males and fe males, respectively, from the EAD and EAC models. Addition ally, PAF for lung cancer was 8.3%, with reference to the Euro pean Pooling Study model; use of this model produced the few
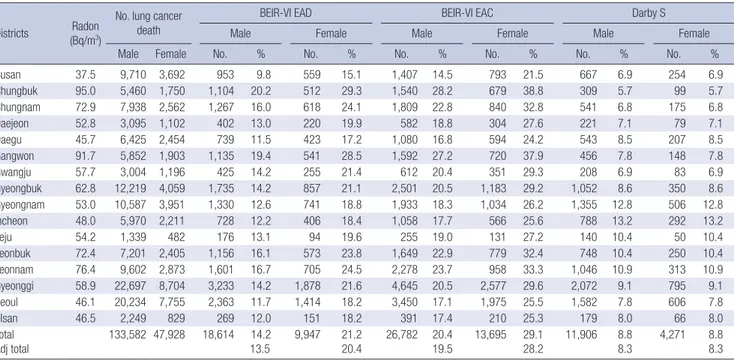
Table 2. Estimate of lung cancer deaths attributable to radon exposure between 1989 and 2009 by gender applying to the risk models developed by the sixth Biological Effects on Ionizing Radiations Committee and European pooling study
Districts Radon (Bq/m3)
No. lung cancer death
BEIR-VI EAD BEIR-VI EAC Darby S
Male Female Male Female Male Female
Male Female No. % No. % No. % No. % No. % No. %
Busan 37.5 9,710 3,692 953 9.8 559 15.1 1,407 14.5 793 21.5 667 6.9 254 6.9 Chungbuk 95.0 5,460 1,750 1,104 20.2 512 29.3 1,540 28.2 679 38.8 309 5.7 99 5.7 Chungnam 72.9 7,938 2,562 1,267 16.0 618 24.1 1,809 22.8 840 32.8 541 6.8 175 6.8 Daejeon 52.8 3,095 1,102 402 13.0 220 19.9 582 18.8 304 27.6 221 7.1 79 7.1 Daegu 45.7 6,425 2,454 739 11.5 423 17.2 1,080 16.8 594 24.2 543 8.5 207 8.5 Gangwon 91.7 5,852 1,903 1,135 19.4 541 28.5 1,592 27.2 720 37.9 456 7.8 148 7.8 Gwangju 57.7 3,004 1,196 425 14.2 255 21.4 612 20.4 351 29.3 208 6.9 83 6.9 Gyeongbuk 62.8 12,219 4,059 1,735 14.2 857 21.1 2,501 20.5 1,183 29.2 1,052 8.6 350 8.6 Gyeongnam 53.0 10,587 3,951 1,330 12.6 741 18.8 1,933 18.3 1,034 26.2 1,355 12.8 506 12.8 Incheon 48.0 5,970 2,211 728 12.2 406 18.4 1,058 17.7 566 25.6 788 13.2 292 13.2 Jeju 54.2 1,339 482 176 13.1 94 19.6 255 19.0 131 27.2 140 10.4 50 10.4 Jeonbuk 72.4 7,201 2,405 1,156 16.1 573 23.8 1,649 22.9 779 32.4 748 10.4 250 10.4 Jeonnam 76.4 9,602 2,873 1,601 16.7 705 24.5 2,278 23.7 958 33.3 1,046 10.9 313 10.9 Gyeonggi 58.9 22,697 8,704 3,233 14.2 1,878 21.6 4,645 20.5 2,577 29.6 2,072 9.1 795 9.1 Seoul 46.1 20,234 7,755 2,363 11.7 1,414 18.2 3,450 17.1 1,975 25.5 1,582 7.8 606 7.8 Ulsan 46.5 2,249 829 269 12.0 151 18.2 391 17.4 210 25.3 179 8.0 66 8.0 Total Adj total 133,582 47,928 18,614 13.514.2 9,947 21.220.4 26,782 19.520.4 13,695 29.128.2 11,906 8.88.3 4,271 8.88.3
est attributable deaths.
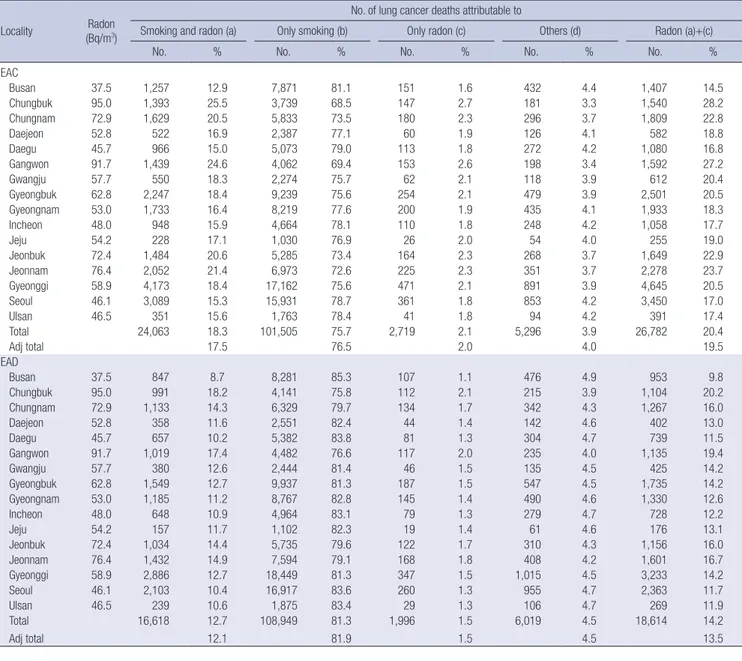
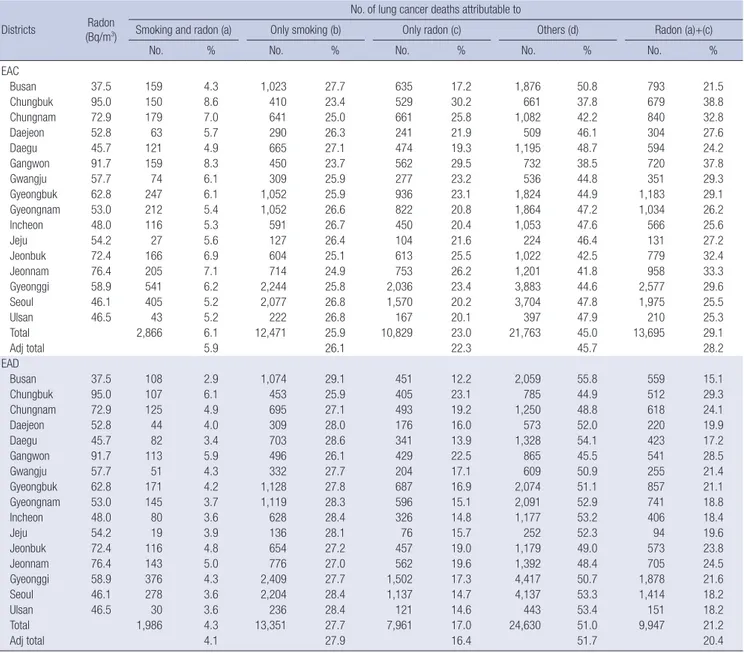
Tables 3 and 4 show the numbers of lung cancer deaths ac cording to smoking status. In males, smoking alone produced the most attributable deaths, and radon alone, the fewest. How ever, in females, issues other than smoking and radon produced the most attributable deaths, and joint effects of smoking and radon, the fewest. Overall, the proportion of lung cancer deaths was higher among smokers than nonsmokers in males. How ever, deaths attributable to lung cancer in females were higher among nonsmokers than smokers; approximately twice as many deaths occurred among female nonsmokers than smokers. The summary of joint effect between smoking and radon on lung cancer by gender represents in Fig. 2.
Table 3. Estimate of lung cancer deaths attributable to radon exposure according to smoking status in male Locality (Bq/mRadon 3)
No. of lung cancer deaths attributable to
Smoking and radon (a) Only smoking (b) Only radon (c) Others (d) Radon (a)+(c)
No. % No. % No. % No. % No. %
EAC Busan 37.5 1,257 12.9 7,871 81.1 151 1.6 432 4.4 1,407 14.5 Chungbuk 95.0 1,393 25.5 3,739 68.5 147 2.7 181 3.3 1,540 28.2 Chungnam 72.9 1,629 20.5 5,833 73.5 180 2.3 296 3.7 1,809 22.8 Daejeon 52.8 522 16.9 2,387 77.1 60 1.9 126 4.1 582 18.8 Daegu 45.7 966 15.0 5,073 79.0 113 1.8 272 4.2 1,080 16.8 Gangwon 91.7 1,439 24.6 4,062 69.4 153 2.6 198 3.4 1,592 27.2 Gwangju 57.7 550 18.3 2,274 75.7 62 2.1 118 3.9 612 20.4 Gyeongbuk 62.8 2,247 18.4 9,239 75.6 254 2.1 479 3.9 2,501 20.5 Gyeongnam 53.0 1,733 16.4 8,219 77.6 200 1.9 435 4.1 1,933 18.3 Incheon 48.0 948 15.9 4,664 78.1 110 1.8 248 4.2 1,058 17.7 Jeju 54.2 228 17.1 1,030 76.9 26 2.0 54 4.0 255 19.0 Jeonbuk 72.4 1,484 20.6 5,285 73.4 164 2.3 268 3.7 1,649 22.9 Jeonnam 76.4 2,052 21.4 6,973 72.6 225 2.3 351 3.7 2,278 23.7 Gyeonggi 58.9 4,173 18.4 17,162 75.6 471 2.1 891 3.9 4,645 20.5 Seoul 46.1 3,089 15.3 15,931 78.7 361 1.8 853 4.2 3,450 17.0 Ulsan 46.5 351 15.6 1,763 78.4 41 1.8 94 4.2 391 17.4 Total 24,063 18.3 101,505 75.7 2,719 2.1 5,296 3.9 26,782 20.4 Adj total 17.5 76.5 2.0 4.0 19.5 EAD Busan 37.5 847 8.7 8,281 85.3 107 1.1 476 4.9 953 9.8 Chungbuk 95.0 991 18.2 4,141 75.8 112 2.1 215 3.9 1,104 20.2 Chungnam 72.9 1,133 14.3 6,329 79.7 134 1.7 342 4.3 1,267 16.0 Daejeon 52.8 358 11.6 2,551 82.4 44 1.4 142 4.6 402 13.0 Daegu 45.7 657 10.2 5,382 83.8 81 1.3 304 4.7 739 11.5 Gangwon 91.7 1,019 17.4 4,482 76.6 117 2.0 235 4.0 1,135 19.4 Gwangju 57.7 380 12.6 2,444 81.4 46 1.5 135 4.5 425 14.2 Gyeongbuk 62.8 1,549 12.7 9,937 81.3 187 1.5 547 4.5 1,735 14.2 Gyeongnam 53.0 1,185 11.2 8,767 82.8 145 1.4 490 4.6 1,330 12.6 Incheon 48.0 648 10.9 4,964 83.1 79 1.3 279 4.7 728 12.2 Jeju 54.2 157 11.7 1,102 82.3 19 1.4 61 4.6 176 13.1 Jeonbuk 72.4 1,034 14.4 5,735 79.6 122 1.7 310 4.3 1,156 16.0 Jeonnam 76.4 1,432 14.9 7,594 79.1 168 1.8 408 4.2 1,601 16.7 Gyeonggi 58.9 2,886 12.7 18,449 81.3 347 1.5 1,015 4.5 3,233 14.2 Seoul 46.1 2,103 10.4 16,917 83.6 260 1.3 955 4.7 2,363 11.7 Ulsan 46.5 239 10.6 1,875 83.4 29 1.3 106 4.7 269 11.9 Total 16,618 12.7 108,949 81.3 1,996 1.5 6,019 4.5 18,614 14.2 Adj total 12.1 81.9 1.5 4.5 13.5
Fig. 2. Summary results of attributable proportion (%) of radon induced lung cancer deaths by gender applying to the risk models developed by the sixth Biological Effects on lionizing Radiations Committee. EAC, age-concentration; EAD, exposure-age-duration.
Attributable proportion (%)
Male Female
EAC EAD EAC EAD 100 90 80 70 60 50 40 30 20 10 0 17.5 12.11.5 81.9 4.5 45.7 26.1 22.3 5.9 4.1 16.4 27.9 51.7 2.0 76.5 4.0
DISCUSSION
Using the exposureresponse relationships from BEIRVI and the European Pooling Study, we estimated the proportion of lung cancer deaths attributable to radon. Radon accounted for 8% to 28% of deaths, depending on lung cancer, gender, and smoking status. Overall, in the results of the BEIRVI models, the EAC model gave higher estimates than the EAD model and the estimated proportion attributable to radon in nonsmokers was higher than that in smokers. These results are consistent with previous studies conducted in various countries (5, 7, 8). Radon is a colorless, odorless, and tasteless gas, to which hu mans are exposed from natural sources. Risks due to radon have come to the fore during the last two decades, but in Korea there is a lack of public concern regarding the risks posed by radon.
Table 4. Estimate of lung cancer deaths attributable to radon exposure according to smoking status in female Districts (Bq/mRadon 3)
No. of lung cancer deaths attributable to
Smoking and radon (a) Only smoking (b) Only radon (c) Others (d) Radon (a)+(c)
No. % No. % No. % No. % No. %
EAC Busan 37.5 159 4.3 1,023 27.7 635 17.2 1,876 50.8 793 21.5 Chungbuk 95.0 150 8.6 410 23.4 529 30.2 661 37.8 679 38.8 Chungnam 72.9 179 7.0 641 25.0 661 25.8 1,082 42.2 840 32.8 Daejeon 52.8 63 5.7 290 26.3 241 21.9 509 46.1 304 27.6 Daegu 45.7 121 4.9 665 27.1 474 19.3 1,195 48.7 594 24.2 Gangwon 91.7 159 8.3 450 23.7 562 29.5 732 38.5 720 37.8 Gwangju 57.7 74 6.1 309 25.9 277 23.2 536 44.8 351 29.3 Gyeongbuk 62.8 247 6.1 1,052 25.9 936 23.1 1,824 44.9 1,183 29.1 Gyeongnam 53.0 212 5.4 1,052 26.6 822 20.8 1,864 47.2 1,034 26.2 Incheon 48.0 116 5.3 591 26.7 450 20.4 1,053 47.6 566 25.6 Jeju 54.2 27 5.6 127 26.4 104 21.6 224 46.4 131 27.2 Jeonbuk 72.4 166 6.9 604 25.1 613 25.5 1,022 42.5 779 32.4 Jeonnam 76.4 205 7.1 714 24.9 753 26.2 1,201 41.8 958 33.3 Gyeonggi 58.9 541 6.2 2,244 25.8 2,036 23.4 3,883 44.6 2,577 29.6 Seoul 46.1 405 5.2 2,077 26.8 1,570 20.2 3,704 47.8 1,975 25.5 Ulsan 46.5 43 5.2 222 26.8 167 20.1 397 47.9 210 25.3 Total 2,866 6.1 12,471 25.9 10,829 23.0 21,763 45.0 13,695 29.1 Adj total 5.9 26.1 22.3 45.7 28.2 EAD Busan 37.5 108 2.9 1,074 29.1 451 12.2 2,059 55.8 559 15.1 Chungbuk 95.0 107 6.1 453 25.9 405 23.1 785 44.9 512 29.3 Chungnam 72.9 125 4.9 695 27.1 493 19.2 1,250 48.8 618 24.1 Daejeon 52.8 44 4.0 309 28.0 176 16.0 573 52.0 220 19.9 Daegu 45.7 82 3.4 703 28.6 341 13.9 1,328 54.1 423 17.2 Gangwon 91.7 113 5.9 496 26.1 429 22.5 865 45.5 541 28.5 Gwangju 57.7 51 4.3 332 27.7 204 17.1 609 50.9 255 21.4 Gyeongbuk 62.8 171 4.2 1,128 27.8 687 16.9 2,074 51.1 857 21.1 Gyeongnam 53.0 145 3.7 1,119 28.3 596 15.1 2,091 52.9 741 18.8 Incheon 48.0 80 3.6 628 28.4 326 14.8 1,177 53.2 406 18.4 Jeju 54.2 19 3.9 136 28.1 76 15.7 252 52.3 94 19.6 Jeonbuk 72.4 116 4.8 654 27.2 457 19.0 1,179 49.0 573 23.8 Jeonnam 76.4 143 5.0 776 27.0 562 19.6 1,392 48.4 705 24.5 Gyeonggi 58.9 376 4.3 2,409 27.7 1,502 17.3 4,417 50.7 1,878 21.6 Seoul 46.1 278 3.6 2,204 28.4 1,137 14.7 4,137 53.3 1,414 18.2 Ulsan 46.5 30 3.6 236 28.4 121 14.6 443 53.4 151 18.2 Total 1,986 4.3 13,351 27.7 7,961 17.0 24,630 51.0 9,947 21.2 Adj total 4.1 27.9 16.4 51.7 20.4
Generally, indoor radon concentrations are higher than those of other sources of exposure, such as air and drinking water. In door radon concentrations depend on factors such as the soil, building materials, house type, and ventilation. Kim et al. re ported that the radon distribution was correlated with the geo logical distribution of granite, and that the concentration in tra ditional Korean houses was higher than that in apartments (4). As the second leading cause of lung cancer, after smoking, accumulated evidence supports the carcinogenicity of radon and its decay products (3). The biological mechanism of the link between radon and lung cancer is explained by deposition of decay products formed after the inhalation of radon in the lung epithelium. Although no domestic evidence regarding in dividual radon exposure and lung cancer is available, arbitrary quantity estimations seem to be meaningful in public health
and policy decisionmaking. However, there has been contro versy as to whether extrapolation of evidence from occupation al exposure to the general population is reasonable. The fourth BEIR report recommended a correcting factor of 0.7, meaning that residential exposures were about 30% lower than those in mines, but the BEIRVI report revised that to 1.0 (14). Addition ally, several lines of evidence originating from the general pop ulation suggest that chronic low exposure to radon is a cause of lung cancer (10, 15). The American Cancer Society Cancer Pre vention Study reported a 15% increase in lung cancer deaths for
each 100 Bq/m3 increase in residential radon concentration
(15). This is similar to the results of 13 European casecontrol studies (10).
Although the findings are unclear, indoor radon concentra tions were not lower than the average of OECD countries. The mean radon concentrations for the Republic of Korea are 62.1
Bq/m3 (arithmetic mean) and 49.0 Bq/m3 (geometric mean)
(4). These are higher than Japan and the United Kingdom, and similar to Portugal and France (2). According to a recent study on the environmental burden of disease in six European coun tries, the burden of radon was highest in France and lowest in the Netherlands (6). A study in the north of Portugal reported that of the total number of lung cancer cases, 18 to 28% (8) could be associated with indoor radon exposure compared with 8.3% in Switzerland, 5% in Germany (16), and 14%16% in Canada (7, 17).
The prevalence of smoking in Korean females was relatively low compared with that in other countries (18), although it has increased gradually in recent years. Several studies estimated the risk of lung cancer attributable to radon taking into consid eration joint effects with smoking (5, 8). In reports from the BEIR VI Committee and United States Environmental Protection Agency (US EPA), smokers comprised almost 95% and 90% of lung cancer deaths in males and females, respectively (9, 14). In a study conducted in Portugal, the values were 85% in males and 21% in females (8). Compared with a largescale prospec tive Korean cohort study (12), this was similar in males and high er in females. A later study in Portugal reported slightly lower numbers for both males and females. Using the values recom mended by the BEIRVI Committee, in the present study, the proportion attributable to radon was approximately 33.0% in nonsmokers and 19.0% in smokers of both genders using EAC (male: 33.2% in nonsmokers and 18.6% in smokers, female: 32.8% in nonsmokers and 18.5% in smokers). Similarly, 40.0% in nonsmokers and 24.7% in smokers were estimated to be at tributable to radon in the north of Portugal (8), and 50.3% in nonsmokers and 10.9% in smokers in a study conducted in France (5). With the exception of lung cancer, the American Cancer Society Cancer Prevention Study also reported a posi tive linear trend and 13% increase in chronic obstructive pul monary disease mortality for each 100 Bq/m3 increase in radon
concentration (19). However, no evidence of an association be tween radon and non respiratory deaths (20) is available. Regarding national efforts to reduce the health risks due to radon, the Korean Ministry of the Environment has recommend ed that the indoor radon concentration be less than 4 pCi/L (picocuries per liter of air, equal to 148 Bq/m3), the same value
as the United States Environmental Protection Agency (21). Moreover, the Korean Ministry of the Environment (KME) has suggested guidelines for reducing the radon risk, such as en couraging construction of radonresistant buildings and im provements in ventilation systems (22). To reduce the health risk associated with radon, education of residents of highlevel regions and provision of information regarding radonrelated health risks are necessary.
The use of average concentrations during the fourth survey, instead of one measure, might have reduced the variation due to measurement error. However, limitations in the available data on the distribution of radon make this difficult to deter mine. In addition, there was also limitation in interpreting re sults due to study design. Using summarized data through eco logical study might lead to under or overestimation in real ex posure. In estimation of the PAF, it was calculated by several risk models not based on domestic evidence, thus it has to be interpreted carefully except for international comparison under same risk models. However, this is the first reported study to quantify lung cancer deaths attributable to indoor radon expo sure across the 16 administrative districts of the Republic of Ko rea. Furthermore, risk assessment in personal level based on national data is required.
In this study, we estimated the regionallevel risk of radon induced lung cancer deaths. These data will assist in making decisions regarding action plans for public health and the allo cation of resources across the regions of Korea.
DISCLOSURE
The authors have no conflicts of interest to disclose. AUTHOR CONTRIBUTION
Study concept and guarantor: Park H. Study design and data collection: Lim D, Baik SJ, Lee WK, Park SH, Kong KA, JungChoi K, Park H. Data analysis and writing: Lee HA, Park SH, Kong KA, JungChoi K. Approval of manuscript: all authors.
ORCID
Hye Ah Lee http://orcid.org/0000-0002-4051-0350 Won Kyung Lee http://orcid.org/0000-0002-6014-8854 Dohee Lim http://orcid.org/0000-0002-0549-8704 Su Hyun Park http://orcid.org/0000-0002-5527-7520
Sun Jung Baik http://orcid.org/0000-0001-9139-7581 Kyoung Ae Kong http://orcid.org/0000-0003-1658-3282 Kyunghee JungChoi http://orcid.org/0000-0002-9800-0994 Hyesook Park http://orcid.org/0000-0002-9359-6522 REFERENCES
1. National Statistical Office of Korea. 2012 Annual report on the cause of
death statistics. Dae Jeon: Korea National Statistical Office, 2013. Avail-able at http://kostat.go.kr/portal/korea/kor_nw/2/1/index.board?bmode =read&aSeq=308559 [accessed on 13 March 2014].
2. World Health Organization. WHO handbook on indoor radon: a public
health perspective. Geneva: World Health Organization, 2009. Available at http://whqlibdoc.who.int/publications/2009/9789241547673_eng. pdf [accessed on 21 February 2014].
3. International Agency for Research on Cancer. Man-made mineral
fi-bers and radon. IARC Working Group on the Evaluation of Carcinogenic Risks of Humans, Vol. 43. 1988; Lyon: WHO Press. 1988.
4. Kim Y, Chang BU, Park HM, Kim CK, Tokonami S. National radon
sur-vey in Korea. Radiat Prot Dosimetry 2011; 146: 6-10.
5. Catelinois O, Rogel A, Laurier D, Billon S, Hemon D, Verger P, Tirma rche M. Lung cancer attributable to indoor radon exposure in France:
impact of the risk models and uncertainty analysis. Environ Health Per-spect 2006; 114: 1361-6.
6. Hänninen O, Knol AB, Jantunen M, Lim TA, Conrad A, Rappolder M, Carrer P, Fanetti AC, Kim R, Buekers J, et al.; EBoDE Working Group.
Environmental burden of disease in Europe: assessing nine risk factors in six countries. Environ Health Perspect 2014; 122: 439-46.
7. Peterson E, Aker A, Kim J, Li Y, Brand K, Copes R. Lung cancer risk from
radon in Ontario, Canada: how many lung cancers can we prevent? Can-cer Causes Control 2013; 24: 2013-20.
8. Veloso B, Nogueira JR, Cardoso MF. Lung cancer and indoor radon
ex-posure in the north of Portugal--an ecological study. Cancer Epidemiol 2012; 36: e26-32.
9. Committee on Health Risks of Exposure to Radon, Board on Radiation Effects Research, Commission on Life Sciences, National Research Coun cil. Health Effects of Exposure to Radon. Washington, DC: National
Acad-emy Press, 1999. (BEIR; 6)
10. Darby S, Hill D, Auvinen A, BarrosDios JM, Baysson H, Bochicchio F, Deo H, Falk R, Forastiere F, Hakama M, et al. Radon in homes and risk
of lung cancer: collaborative analysis of individual data from 13
Euro-pean case-control studies. BMJ 2005; 330: 223.
11. Lim SS, Vos T, Flaxman AD, Danaei G, Shibuya K, AdairRohani H, Ama nn M, Anderson HR, Andrews KG, Aryee M, et al. A comparative risk
assessment of burden of disease and injury attributable to 67 risk factors and risk factor clusters in 21 regions, 1990-2010: a systematic analysis for the Global Burden of Disease Study 2010. Lancet 2012; 380: 2224-60.
12. Jee SH, Samet JM, Ohrr H, Kim JH, Kim IS. Smoking and cancer risk in
Korean men and women. Cancer Causes Control 2004; 15: 341-8.
13. Murray CJ, Ezzati M, Lopez AD, Rodgers A, Vander Hoorn S.
Compara-tive quantification of health risks conceptual framework and method-ological issues. Popul Health Metr 2003; 1: 1.
14. United States Environmental Protection Agency. Assessment of risks
from radon in homes. Washington, DC: United States Environmental Protection Agency, 2003. Available at http://www.epa.gov/radon/risk_ assessment.html [accessed on 1 April 2014].
15. Turner MC, Krewski D, Chen Y, Pope CA 3rd, Gapstur S, Thun MJ.
Ra-don and lung cancer in the American Cancer Society cohort. Cancer Epi-demiol Biomarkers Prev 2011; 20: 438-48.
16. Menzler S, Piller G, Gruson M, Rosario AS, Wichmann HE, Kreienbrock L. Population attributable fraction for lung cancer due to residential
ra-don in Switzerland and Germany. Health Phys 2008; 95: 179-89.
17. Chen J, Moir D, Whyte J. Canadian population risk of radon induced
lung cancer: a re-assessment based on the recent cross-Canada radon survey. Radiat Prot Dosimetry 2012; 152: 9-13.
18. Organization for Economic Cooperation and Development. OECD
health statistics. 2013. Available at http://www.oecd-ilibrary.org/social-issues-migration-health/data/oecd-health-statistics_health-data-en [accessed on 1 April 2014].
19. Turner MC, Krewski D, Chen Y, Pope CA 3rd, Gapstur SM, Thun MJ.
Radon and COPD mortality in the American Cancer Society Cohort. Eur Respir J 2012; 39: 1113-9.
20. Turner MC, Krewski D, Chen Y, Pope CA 3rd, Gapstur SM, Thun MJ.
Radon and nonrespiratory mortality in the American Cancer Society co-hort. Am J Epidemiol 2012; 176: 808-14.
21. Neri A, Stewart SL, Angell W. Radon control activities for lung cancer
prevention in national comprehensive cancer control program plans, 2005-2011. Prev Chronic Dis 2013; 10: E132.
22. Korean Ministry of Environment. Guideline of indoor radon reduction.
Seoul: Korean Ministry of Environment, 2010. Available at http://www. me.go.kr/home/web/index.do?menuId=12 [accessed on 21 February 2014].