Regulation of chitinase-3-like-1 in T cell elicits Th1
and cytotoxic responses to inhibit lung metastasis
Do-Hyun Kim
1,2
, Hong-Jai Park
3
, Sangho Lim
1,2
, Ja-Hyun Koo
1,2
, Hong-Gyun Lee
1,2
, Jin Ouk Choi
1
, Ji Hoon Oh
4
,
Sang-Jun Ha
4
, Min-Jong Kang
5
, Chang-Min Lee
6
, Chun Geun Lee
6,7
, Jack A. Elias
6,8
& Je-Min Choi
1,2,9
Chitinase-3-like-1 (Chi3l1) is known to play a significant role in the pathogenesis of Type 2
inflammation and cancer. However, the function of Chi3l1 in T cell and its clinical implications
are largely unknown. Here we show that Chi3l1 expression was increased in activated T cells,
especially in Th2 cells. In addition, Chi3l1-de
ficient T cells are hyper-responsive to TcR
stimulation and are prone to differentiating into Th1 cells. Chi3l1-de
ficient Th1 cells show
increased expression of anti-tumor immunity genes and decreased Th1 negative regulators.
Deletion of Chi3l1 in T cells in mice show reduced melanoma lung metastasis with increased
IFN
γ and TNFα-producing T cells in the lung. Furthermore, silencing of Chi3l1 expression in
the lung using peptide-siRNA complex (dNP2-siChi3l1) ef
ficiently inhibit lung metastasis with
enhanced Th1 and CTL responses. Collectively, this study demonstrates Chi3l1 is a regulator
of Th1 and CTL which could be a therapeutic target to enhance anti-tumor immunity.
DOI: 10.1038/s41467-017-02731-6
OPEN
1Department of Life Science, College of Natural Sciences, Hanyang University, Seoul 04763, Korea.2Research Institute for Natural Sciences, Hanyang
University, Seoul 04763, Korea.3Department of Internal Medicine, Yale University School of Medicine, New Haven, CT 06510, USA.4Department of
Biochemistry, College of Life Science and Biotechnology, Yonsei University, Seoul 03722, Korea.5Section of Pulmonary, Critical Care and Sleep Medicine,
Yale University School of Medicine, New Haven, CT 06510, USA.6Department of Molecular Microbiology and Immunology, Brown University, Providence, RI
02912, USA.7Department of Internal Medicine, Hanyang University College of Medicine, Seoul 04763, Korea.8Division of Medical and Biological Sciences,
Warren Alpert Medical School, Brown University, Providence, RI 02903, USA.9Center for Neuroscience Imaging Research (CNIR), Institute for Basic Science
(IBS), Suwon 16419, Korea. Correspondence and requests for materials should be addressed to J.-M.C. (email:[email protected])
123456789
C
hitinase is a defensive enzyme in plant to cleaves chitin
and protects hosts against pathogens
1–3. Chitinase-like
proteins (CLPs) are evolutionarily conserved in mammals
but do not have the enzymatic activity to directly degrade
chitin
4,5. They have evolved to be important in the development
and progression of Th2 inflammation, parasitic infections, and
cancer
6–11.
Ym-1, also called chitinase 3-like 3 (Chi3l3), and Ym-2, also
called chitinase 3-like 4 (Chi3l4), are CLPs that are important
contributors to Th2 inflammation in allergies
7. A previous study
has demonstrated that Ym-1 and Ym-2 could increase the
number of
γδ T cells and IL-17 production in a nematode
infection model
9. This result demonstrates their evolutionarily
conserved roles as innate defense systems. Chitinase 3-like 1
(Chi3l1), also known as breast regression protein 39 (BRP-39),
has been more emphasized in cancer and lung inflammation due
to human homolog YKL-40, which is mainly expressed in breast
cancer cells and lung macrophages
6,10–12. In Streptococcus
pneumoniae infections, Chi3l1 regulates macrophage cell death to
promote bacterial clearance, indicating a function in innate
immunity against pathogens
13. Studies of transgenic mouse
models show that both BRP-39 and YKL-40 are critical regulators
of Th2 inflammation in the lung. OVA sensitization induces
Chi3l1 expression by macrophages, and induced asthmatic Th2
inflammation is markedly diminished in BRP-39-deficient
back-ground, while lung specific YKL-40 overexpression rescues the
Th2 inflammation
6. In addition, Chi3l1 deficiency significantly
ameliorates IL-13-induced
fibrosis and IL-18-mediated IL-13
production, suggesting an essential role of Chi3l1 in the
pathogenesis of Th2 inflammation
6,14.
Chi3l1 was recently found to be involved in pulmonary
metastasis
10,11. The expression of Chi3l1 was significantly
increased by melanoma tumor cell challenge and Chi3l1
defi-ciency reduced lung metastasis of melanoma or breast cancer
cells. Although studies have shown that Th2-driven inflammation
in the lung induces BRP-39 and it contributes to Th2
inflammation, fibrosis, and tumors, the direct function of Chi3I1
in adaptive immunity such as T cell responses is totally unknown.
Th2 polarization and IL-4 have been shown to promote tumor
growth and metastasis
15,16. Therefore, we hypothesized that
specific immune regulatory function of Chi3l1 that drive Th2
polarization while inhibiting Th1 activation may contribute to the
tumor development and progression. Here we demonstrated that
Chi3l1 expression was highly induced in activated T cells and Th2
cells. Chi3l1-deficient T cells were differentiated into T cells with
Th1-prone phenotypes with hyper-responsive to IFNγ signaling
and melanoma lung metastasis was significantly reduced in the
mice with both Chi3l1 total knock out and CD4
−Cre system. In
addition, in vivo siRNA silencing of Chi3l1 with a
cell-penetrating peptide dNP2 efficiently inhibited melanoma lung
metastasis by increasing both Th1 and cytotoxic T-lymphocyte
(CTL) responses. When viewed in combination, these studies
suggest that Chi3l1 plays an essential role in regulation of Th1
and CTL differentiation. These studies highlight that specific
intervention of Chi3l1 in T cells could be an effective therapy of
pulmonary metastasis.
Results
Chi3l1 negatively regulates T cell activation. Previous studies
have reported that CLPs are highly expressed in lung tissue,
especially macrophages
6,17. However, expression of CLPs in
lymphocytes, especially in T cells, has not been studied. We
performed comparative analysis of mRNA levels of Chi3l1,
Chitotriosidase, AMCase, and Ym-1 in splenic macrophages,
DCs, T cells, B cells, and NK cells (Supplementary Fig.
1
). These
chitinases and CLPs were highly expressed in macrophages
however the expression of Chi3l1 was most prominent among
these chitinases and CLPs in CD4 and CD8 T cells. In addition,
we examined chitinase and CLP expression in naïve and activated
CD4 and CD8 T cells. Both mRNA (Fig.
1
a, b) and protein
(Fig.
1
c, d) level of Chi3l1 was strongly induced time dependently
upon anti-CD3 and anti-CD28 stimulation. In addition, Chi3l1
expression was strongly induced in Th0 and Th2 cells compare to
the other effector T cell subsets (Fig.
1
e), suggesting a potential
role of Chi3l1 during T cell activation and differentiation. On the
other hand, no significant abnormalities were noted in immune
cells development between WT and Chi3l1 knock out (KO) mice
(Supplementary Fig.
2
). To investigate whether Chi3l1 is a
negative regulator of T cell activation, MACS-purified naïve CD4
and FACS-purified CD8 T cells from wild type (WT) and Chi3l1
KO mouse splenocytes were activated by CD3 and
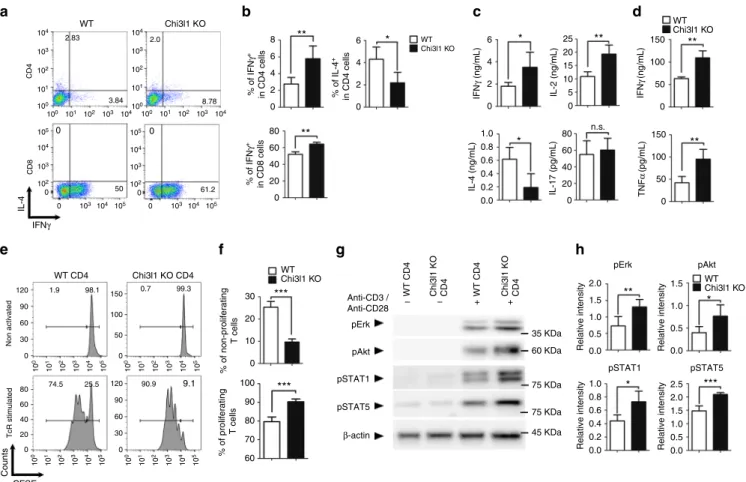
anti-CD28 antibodies for 3 days. Cytokine
flow cytometric analysis
demonstrated that Chi3l1 deficiency in both CD4 and CD8 T cells
significantly increased IFNγ production, while IL-4 production
decreased (Fig.
2
a, b). ELISA analysis of Chi3l1 KO CD4 T cells
showed increase of both IFNγ and IL-2, decrease of IL-4, and no
difference was seen in IL-17 (Fig.
2
c) suggesting Th1-like
char-acter. In addition, there was increased IFNγ and TNFα expression
in Chi3l1 KO CD8 T cells (Fig.
2
d), suggesting that Chi3l1
negatively regulates T cell activation, especially regulates Th1 or
CTL cytokine production. Because IL-2 and IFNγ are important
cytokines for T cell proliferation, we confirmed the proliferation
properties of Chi3l1 KO T cells compared to wild type.
CFSE-labeled Chi3l1 KO CD4 T cells showed a higher proportion of
divided cells in response to TcR stimuli compared to control
T cells (Fig.
2
e, f). In addition, phosphorylation of Akt, Erk,
STAT1, and STAT5 was increased in Chi3l1 KO T cells,
sug-gesting that Chi3l1 is an important factor for regulating T cell
proliferation (Fig.
2
g, h). Collectively, these results demonstrate
that Chi3l1 is expressed in T cells and regulate T cell activation
and proliferation for controlling effector functions.
Chi3l1 inhibits Th1 differentiation via IFN
γ-STAT1 axis.
Because Chi3l1 expression was the most significant in Th2 cells
and its deficiency in T cells led to increased IL-2 and IFNγ, but
decreased IL-4, we hypothesized that it regulates effector T cell
differentiation between Th1 and Th2. To investigate whether
Chi3l1 regulates Th1 and Th2 differentiation, MACS-sorted CD4
+
CD62L
highCD44
lowWT and Chi3l1 KO naïve CD4 T cells were
differentiated into Th1, 2, and Th17 cells under specific skewing
conditions. The proportion of IFNγ-producing cells significantly
increased not only in Th1 but also in Th2 and Th17 conditions
while IL-4 in Th2 was decreased and showed no difference in
Th17 (Fig.
3
a, b). Accumulated cytokines in supernatants showed
equivalent patterns (Fig.
3
c). T-bet, Runx3, and Eomes, which are
important transcription factors of Th1 differentiation, increased
in Chi3l1-deficient Th1 cells with increased IFNγ and GM-CSF.
JunB, which is important for IL-4-related Th2 differentiation, was
significantly reduced, and no differences were observed in
Th17-related factors (Fig.
3
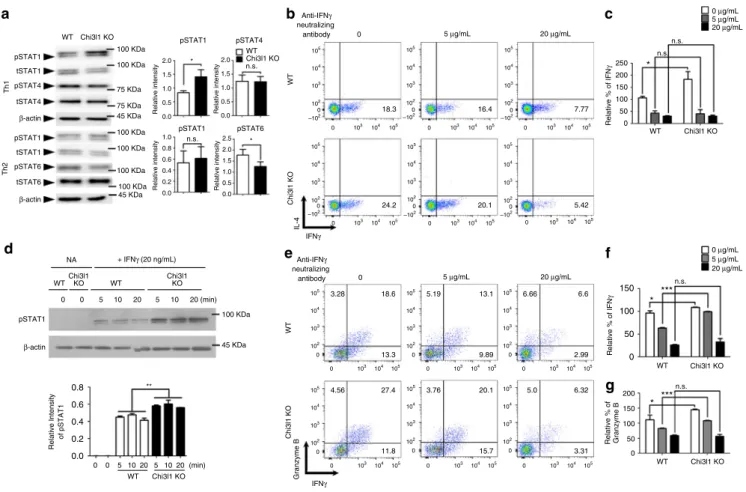
d). In Chi3l1-deficient Th1 cells, the level of
phosphorylated STAT1 was significantly increased, with no
dif-ference in the level of phosphorylated STAT4 suggesting Chi3l1
regulates IFNγ signaling not IL-12 (Fig.
4
a). On the other hand,
phosphorylated STAT6 level was significantly reduced in Th2,
collectively suggesting that Chi3l1 could be a negative regulator of
IFNγ signaling to commit T cells to more like Th2 cells. In
addition, the proportion of IFNγ-producing cells was significantly
decreased by IFNγ-neutralizing antibody in Chi3l1 KO Th1 cells
(Fig.
4
b, c). At 20
μg/mL neutralizing antibody, IFNγ-producing
cells were equivalent in WT and Chi3l1 KO Th1 cells. We also
treated recombinant IFNγ cytokine to WT and Chi3l1 KO naïve
CD4 T cells that Chi3l1 KO T cells showed significantly increased
pSTAT1 level compared to WT T cells (Fig.
4
d) suggests that
increased IFNγ production by Chi3l1 deficiency in T cells could
be dependent on increased IFNγ-STAT1 signaling. In addition,
we confirmed IFNγ dependency in CD8 T cells, and found that
IFNγ and Granzyme B producing activated Chi3l1 KO CD8
T cells were decreased by neutralizing IFNγ antibody treatment,
and the level was equivalent with that in WT T cells at 20
μg/mL
IFNγ neutralizing antibody (Fig.
4
e, f). Taken together, these
results demonstrate that Chi3l1 negatively regulates Th1 or CD8
effector T cell differentiation by inhibiting IFNγ-mediated STAT1
phosphorylation.
Chi3l1 suppresses Th1-related and tumoricidal genes. To
investigate how Chi3l1 regulates the IFNγ-mediated signaling
pathway, we isolated RNA from WT and Chi3l1 KO naïve CD4
T cells and differentiated Th1 cells. The transcriptomes of WT
and Chi3l1 KO, naïve, and Th1 cells were analyzed by RNA
sequencing. To determine the differences in gene expression
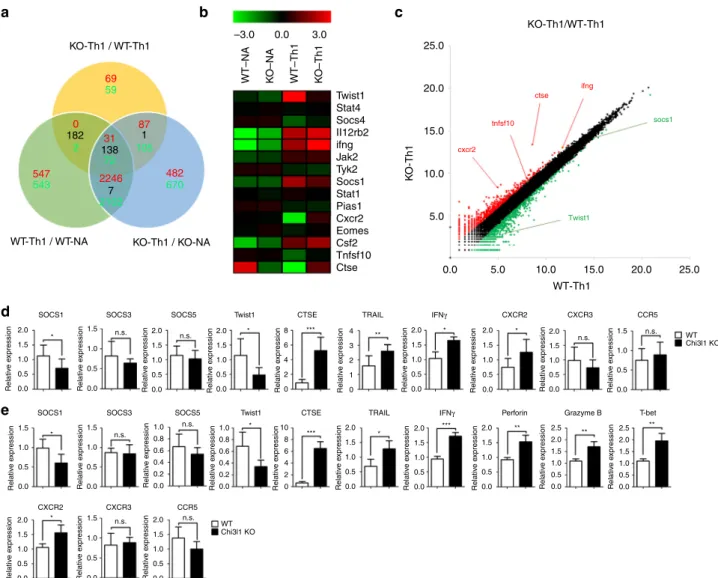
between WT and Chi3l1 KO Th1 cells, we classified genes that
were highly expressed in Th1 cells compared with naïve T cells.
We also classified genes that were differently expressed in Chi3l1
KO Th1 cells compared to WT Th1 cells (Fig.
5
a). We found 31
up-regulated genes and 72 down-regulated genes in Chi3l1 KO
Th1 cells compared to WT Th1 cells. A heatmap obtained by
clustering methods showed decreased twist1 and socs1, which are
IFNγ-regulatory genes, and increased ifng, ctse, cxcr2, and tnfsf10
(as known as TRAIL), which are tumoricidal molecules, in Chi3l1
KO Th1 cells (Fig.
5
b). A scatterplot summarized these patterns
(Fig.
5
c). To confirm the RNA-sequencing results, we performed
quantitative RT-PCR analysis of WT and Chi3l1 KO Th1 cells
(Fig.
5
d). Expression of SOCS1, a phosphatase that inhibits
phosphorylation of STAT1, was significantly decreased without
differences in SOCS3 and SOCS5 in Chi3l1-deficient Th1 cells
compared to WT Th1 cells. Twist1, a Th1 inhibitory molecule,
was also reduced, presumably explaining how Chi3l1 KO
Th1 cells produce more CTSE, TRAIL, IFNγ, and CXCR2. The
molecular expression patterns were the same in CD8 T cells
(Fig.
5
e). In addition, activated Chi3l1 KO CD8 T cells expressed
higher levels of T-bet, IFNγ, Perforin, and Granzyme B,
sug-gesting that Chi3l1 KO CD8 T cells induce high levels of effector
molecules related to CTL function. Taken together, these results
suggest Chi3l1 is a negative regulator of gene expressions
regarding Th1 and CTL functions.
Chi3l1 de
ficiency in T cells inhibits pulmonary metastasis. The
increase of effector functional molecules in Chi3l1-deficient
T cells prompted us to investigate whether Chi3l1-deficient Th1
and CTL contributed to anti-tumor immunity. To test our
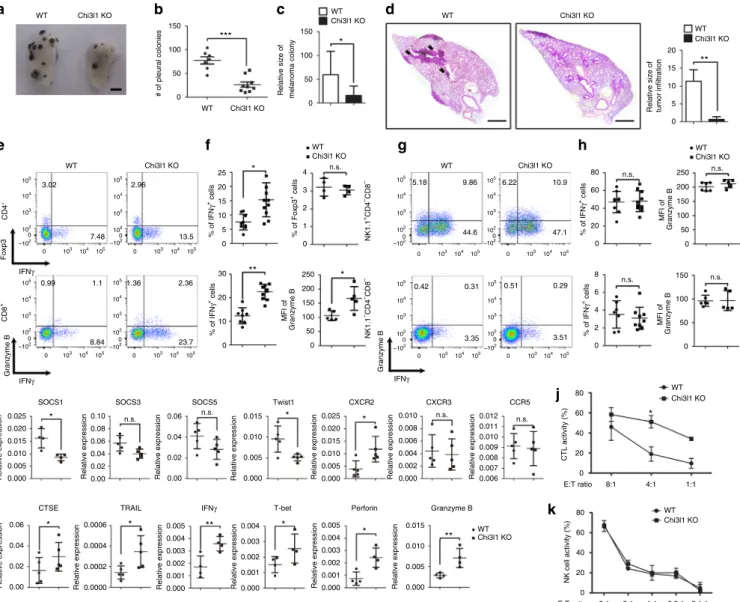
hypothesis, we utilized B16F10 melanoma lung metastasis model.
At 14 days from intravenous injection of 5 × 10
5B16F10
mela-noma cells into WT and Chi3l1 KO mice, metastatic melamela-noma
colonies were observed on the lung surface (Fig.
6
a). Melanoma
lung metastasis was significantly reduced in the Chi3l1 KO mice
compared to WT animals (Fig.
6
b). Histological analysis of
sectioned slides revealed that infiltrated tumors around blood
vessels were also significantly decreased in Chi3l1 KO mice
(Fig.
6
c). Increased infiltration of IFNγ-producing CD4 T cells
and CD8 T cells was significantly higher in the lungs of Chi3l1
KO mice than WT animals (Fig.
6
d, e). However no difference
was observed in the IFNγ-producing properties of NK cells or
non-lymphocytic populations (Fig.
6
f, g). Consistent with the
RNA-sequencing and RT-PCR results, Chi3l1 KO mice had
Fold change of Chi3l1 in CD4 T cells Fold change of Chi3l1 in CD8 T cells Chi3l1/ β -actin
a
3 2 *** *** *** Chi3l1 10 8 6 4 2 0.03 0.00 NA CD3/CD28 n.d. n.d. *** *** *** 0.06 Chitotriosidase AMCase Ym-1 Chi3l1 Chitotriosidase AMCase Ym-1 1 0.02 0.01 0.00 NA CD3/CD28b
d
c
e
Chi3l1 0 24 48 72 45 KDa 35 KDa (hrs) (hrs) 0.00 NA TH0 TH1 Th2 TH17 Treg 0.01 0.02 0.03 0.04 0.05 ** *** 0 24 48 72 Chi3l1 normalized to β -actin CD4 CD8 β-actin Anti-CD3 / Anti-CD28 Anti-CD3 / Anti-CD28 Chi3l1 0 24 48 72 (hrs) (hrs) 0 24 48 72 Chi3l1 normalized to β -actin β-actin Anti-CD3 / Anti-CD28 Anti-CD3 / Anti-CD28 45 KDa 35 KDa 1.5 ** 1.0 0.5 0.0 1.5 2.0 1.0 0.5 0.0Fig. 1 Chitinase and Chitinase-like protein expressions in T cells. a, b mRNA expression of chitinase (Chitotriosidase, AMCase) and chitinase-like protein
(Chi3l1, Ym-1) in mouse CD4 and CD8 T cells upon anti-CD3 and anti-CD28 stimulation for 3 days. Each gene expression level was normalized toβ-actin,
and represented as fold change to Non-activated (NA).c, d Chi3l1 protein level in CD4 and CD8 T cells stimulated by plate-bound anti-CD3 and anti-CD28
antibodies for indicated time point. Densitometric values of band intensity were calculated by normalization to the value ofβ-actin. e Chi3l1 mRNA
expression in naïve and effector T cell subsets. Chi3l1 mRNA expression level was normalized toβ-actin level. Data are mean ± SD of three sets of
increased mRNA for anti-tumor immunity molecules including
CTSE, TRAL, IFNγ, T-bet, Perforin, and Granzyme B, while the
expression of Th1-inhibitory molecules such as Twist1 and
SOCS1 was significantly reduced (Fig.
6
h). To confirm the
increased tumoricidal activity in Chi3l1 KO CD8 T cells, we
performed co-culturing experiments with pre-activated WT or
Chi3l1 KO CD8 T cells and B16F10 melanoma cells. Chi3l1 KO
CD8 T cells showed more potent tumor-killing activity than WT
CD8 T cells (Fig.
6
i). However, no significant difference in the
cytotoxicity of WT and Chi3l1 KO NK cells was observed
(Fig.
6
j). This result suggest reduction of melanoma lung
metastasis would be mainly dependent on altered T cell
respon-ses. To further confirm the question whether inhibition of
pulmonary metastasis is truly depending on altering T cell
functions, we generated CD4 specific Chi3l1 KO mice by crossing
CD4-Cre and Chi3l1
floxed mice (Fig.
7
a). At 14 days from
melanoma tumor cell injection, as consistent, we found
sig-nificantly decreased number of pleural colonies in the lung of
CD4-Chi3l1 KO mice (Fig.
7
b, c) with reduced tumor infiltration
around the vessel (Fig.
7
d). There are significantly increased IFNγ
and TNFα expressing both CD4 and CD8 T cells (Fig.
7
e, f), while
there are no differences in NK cells and non-lymphocytic
populations in CD4-Chi3l1 KO mice (Fig.
7
g, h). Very
con-sistently, there are elevated anti-tumor molecules such as
per-forin, granzyme B, CTSE and increased Th1 transcription factor
T-bet while decrease of Th1 inhibitory molecule like SOCS1 and
Twist1 in the lung of CD4-Chi3l1 KO mice (Fig.
7
i). Importantly
we further confirmed that there were significantly increased
tumor infiltrating lymphocyte (TIL) populations in the lung by
CD45 staining which contains IFNγ producing T cells with
increased Th1 and CTL related mRNA expression in tumor
region. Although there is no significance of statistical analysis due
to the limited number of samples, CD8/Treg ratio showed
increased pattern in CD4-Chi3l1 KO mice, which is clinically
critical value for successful immunotherapy
18,19(Supplementary
Fig.
3
). However, IFNγ producing T cells from spleen and
inguinal lymph node was not increased (Supplementary Fig.
4
),
suggesting elevated antigen specific T cell recruitment and
actions. Furthermore, we transferred WT or Chi3l1 KO Th1 and
activated CD8 T cells into RAG KO mice consistently shows that
Chi3l1 KO T cell transfer shows more significantly reduced lung
metastasis of melanoma cells compare to WT T cell transfer
(Supplementary Fig.
5
) suggesting the total KO and CD4-Chi3l1
KO mice phenotype of reduced lung metastasis would be due to
altered intrinsic T cell functions. Collectively, these results suggest
that Chi3l1 is a negative regulator of Th1 and CTL responses to
enhance pulmonary metastasis.
Targeted silencing of Chi3l1 by peptide-siRNA complex.
Pre-viously, we reported a novel cell-penetrating peptide (CPP),
dNP2, which delivers an immune regulatory protein into T cells
3.84 8.78 2.83 2.0 0 0 98.1 99.3 25.5 9.1 1.9 0.7 74.5 90.9 IFNγ IL-4 Non activated TcR stimulated CFSE Counts WT CD4 Chi3l1 KO CD4 WT CD4 CD8 Chi3l1 KO % of non-proliferating T cells % of proliferating T cells IFN γ (ng/mL) IL-4 (ng/mL)
a
b
c
d
e
f
g
h
Anti-CD3 / Anti-CD28 – – + + pAkt pAkt pErk pErk pSTAT1 β-actin pSTAT1 pSTAT5 45 KDa 75 KDa 75 KDa 35 KDa 60 KDa pSTAT5 Relative intensity Relative intensityRelative intensity Relative intensity
IFN γ (ng/mL) TNF α (pg/mL) 50 61.2 % of IL-4 + in CD4 cells IL-2 (ng/mL) IL-17 (pg/mL) 104 104 104 105 105 103 103 103 10 3 10 4 10 5 10 2 10 1 10 0 10 3 10 4 10 5 10 2 10 1 10 0 10 3 10 4 10 5 10 2 10 1 10 0 10 3 10 4 10 5 10 2 10 1 10 0 0 30 60 90 120 0 30 60 60 80 40 20 0 60 80 8 6 4 2 0 6 4 2 0 40 20 0 90 120 150 30 20 10 100 *** *** ** ** ** ** n.s. ** *** ** * 6 25 20 150 100 50 0 150 100 50 0 15 10 5 0 4 2 0 1.0 0.8 80 60 40 20 2.0 1.5 1.0 0.5 0.0 2.0 2.5 1.5 1.0 1.0 0.8 0.6 0.4 0.2 0.0 0.5 0.0 1.5 1.0 0.5 0.0 0 0.6 0.4 0.2 0.0 * * * * WT Chi3l1 KO WT Chi3l1 KO WT Chi3l1 KO WT Chi3l1 KO 90 80 70 60 0 100 50 0 102 102 0 0 104 104 105 105 103 103 102 0 0 101 100 100 101 102 103 104 104 103 102 101 100 100 101 102 103 104 % of IFN γ + in CD4 cells % of IFN γ + in CD8 cells WT CD4 Chi3l1 KO CD4 WT CD4 Chi3l1 KO CD4
Fig. 2 Chi3l1 KO T cells are hyper-responsive to TcR stimulation. a, b MACS-sorted WT and Chi3l1 KO naïve CD4 T cells were activated by plate-bound
anti-CD3 and anti-CD28 antibodies for 3 days. IFNγ and IL-4 expression level was analyzed by flow cytometry. c IFNγ, IL-2, IL-4, and IL-17 cytokine
production in the CD4 T cell culture supernatant was measured by ELISA.d IFNγ and TNFα cytokine production in the CD8 T cell culture supernatant was
measured by ELISA.e Proportion of proliferating CD4 T cells were analyzed by CFSE assay. f Percentages of proliferating and non-proliferating cells were
analyzed by gating on histogram.g Phosphorylated Erk, Akt, STAT1, STAT5 were analyzed by Western blotting. h Relative densitometric analysis of
Western blots was represented as normalized toβ-actin. Data are mean ± SD of three sets of independent experiments (n = 6). n.s., not significant;
and showed its therapeutic potential in autoimmune diseases
20,21We hypothesized that introducing siRNA against Chi3l1
(siChi3l1) via dNP2 peptide would be a novel strategy and could
enhance anti-tumor immunity to reject tumors. We utilized
chemically synthesized dNP2 peptide combined with HA2 for
helping endosomal escape
22for making noncovalent
peptide-siRNA complex based on N/P ratio, which refers the number of
amine group in dNP2-HA2 to the number of phosphate group in
siRNA (Fig.
8
a). 30 min incubation at room temperature of the
complex was analyzed by gel retardation assay that dNP2-HA2
start to form complexes with siChi3l1 from 1:10, and mainly at
1:25 N/P ratio (Fig.
8
b), thus we chose dNP2-siRNA complex
with 1:25 N/P ratio for further experiments. The dNP2-siChi3l1
complex size was measured by Nano particle size analyzer which
shows the size of the complex is increasing as the N/P ratio
(Fig.
8
c). The molecular complex of 1:25 indicates around 300
nm. To confirm the knockdown efficiency of the complexes, we
used Chi3l1-overexpressed HEK293T cells. The knockdown
effi-ciency of dNP2-siChi3l1 complex or Lipofectamine-mediated
siChi3l1 delivery was compared at the mRNA (Fig.
8
d) and
protein levels (Fig.
8
e). dNP2-mediated siChi3l1 delivery
sig-nificantly suppressed Chi3l1 expression dose dependently and the
level of suppression at 250 ng siRNA at 1:25 N/P ratio was
comparable to Lipo-siChi3l1 positive control. The siRNA
com-plex of dNP2-siChi3l1 and dNP2-siEGFP was intranasally
administered to C57BL/6 mice at day 0, and in vivo Chi3l1
knockdown efficiency was evaluated by RT-PCR. 2.5 μg of
siChi3l1 delivery by 70
μg of dNP2-HA2 peptide at 1:25 N/P ratio
showed significant reduction of Chi3l1 mRNA expression in the
lung at day 1. Maximum silencing of Chi3l1 expression was noted
at day 2 and the level of Chi3l1 started to restore from day 3
(Fig.
8
f). Chi3l1 protein was significantly reduced from day 2 and
was sustained until day 3 (Fig.
8
g, h). Both mRNA and protein
level of Chi3l1 in the lung was reduced by dNP2-siChi3l1 in dose
dependent manner (Supplementary Fig.
6
a, b), however there was
no significant effect observed by free siChi3l1 or free dNP2-HA2
peptide (Supplementary Fig.
6
c) suggesting dNP2-HA2 peptide
truly enables siChi3l1 delivery into lungs via intranasal route and
knockdown target gene expression. Next, we determined the
functional activity of dNP-siChi3l1 in Th1 differentiation.
FACS-sorted WT naïve CD4 T cells were differentiated into Th1 cells
with dNP2-siChi3l1 or dNP2-siEGFP for 5 days. IFNγ- and
TNFα-producing cells were analyzed by flow cytometry (Fig.
8
i,
j). From 100 ng to 250 ng, dNP2-siChi3l1 resulted in significantly
increased IFNγ-producing and TNFα-producing cells compared
to a dNP2-siEGFP-treated group. The increase of IFNγ mRNA
level by dNP2-siChi3l1 has correlation with significantly decrease
of Chi3l1 mRNA level in Th1 cells (Fig.
8
k). We confirmed there
was no effect of equivalent dose of free siChi3l1 treatment in Th1
differentiation (Supplementary Fig.
7
) suggesting critical role of
dNP2-HA2 for delivery of siRNA into T cells. These studies
collectively elicit that siRNA targeting Chi3l1 could be delivered
into T cells by dNP2-HA2 peptide and strengthened Th1
differ-entiation and enhanced effector cytokine production by activated
CD8 T cells which would be a novel strategy to modulate T cell
immunity.
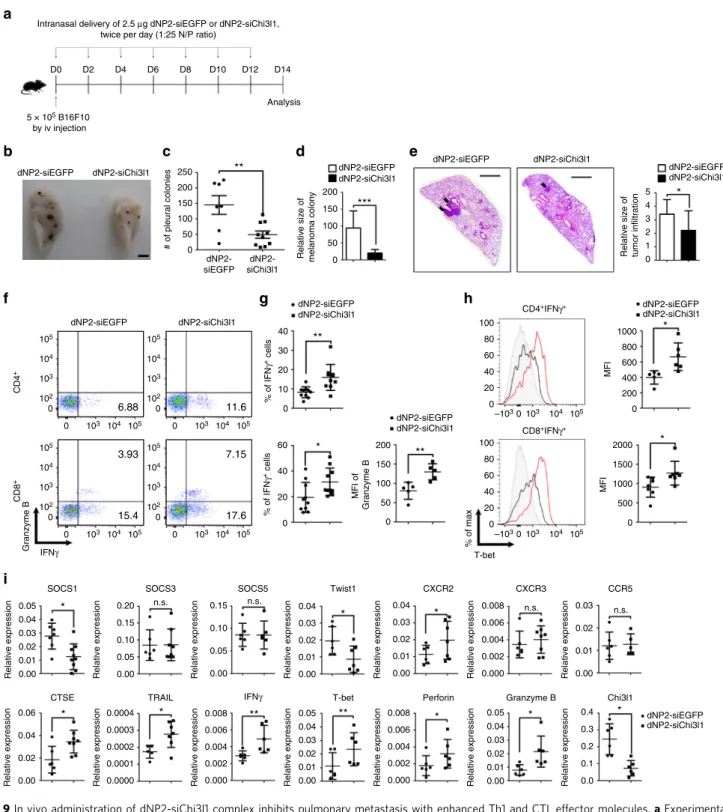
dNP2-siChi3l1 treatment suppresses pulmonary metastasis.
Finally, we investigated the in vivo efficiency of dNP2-siChi3l1
treatment in the regulation of melanoma lung metastasis. 14 days
after intravenous injection of 5 × 10
5B16F10 melanoma cells into
WT mice, lung tissues were harvested and analyzed. 2.5
μg
con-trol siEGFP and siChi3l1 complexed with 70
μg dNP2-HA
pep-tide at 1:25 N/P ratio were intranasally administered twice per day
for every other day from day 0 to day 14 (Fig.
9
a). Metastatic
melanoma colonies on the lung surface were observed (Fig.
9
b)
and counted. There was a significant reduction of number of
metastatic pleural colonies (Fig.
9
c) and relative size of melanoma
colony (Fig.
9
d) in the lung by dNP2-siChi3l1 treatment
WT 0.5 0.65 104 104 103 103 102 102 101 101 100 104 103 102 101 100 104 103 102 101 100 104 103 102 101 100 100 100 101 102 103 104 104 103 102 101 100 104 103 102 101 100 104 103 102 101 100 104 103 102 101 100 104 103 102 101 100 104 103 102 101 100 Th1 Th1 100 * * * * * 80 60 40 20 0 0
a
b
60 * 40 20 0c
IL-17 % of IFN γ + cells % of IFN γ + cells % of IFN γ + cells % of IL-4 + cells % of IL-17 + cells Relative expression Relative expression IFN γ (ng/mL) Relative expression IFNγ Chi3l1 KO 25.2 34.1 7.57 0.74 4.42 1.44 9.11 10.0 0.87 1.09 IL-4 IFNγ IL-4 IFNγ Th1 Th17 Th2 IL-4 (ng/mL) IFN γ (pg/mL) IFN γ (pg/mL) IL-17 (ng/mL) TNF α (pg/mL) Th2 Th17 Th2 Th17 Th1 Th2 Th17d
WT Chi3l1 KO WT Chi3l1 KO WT Chi3l1 KO 3 8 6 4 2 0 2 1 0 3 15 10 5 0 15 20 10 5 0 n.s. n.s. n.s. n.s. n.s. n.s. n.s. n.s. 2 1 0 * * * * * * * * * * 100 200 300 400 5 4 3 2 1 0T-bet Runx3 IFN γ GM-CSF Eomes ** ** 250 1.5 1.0 0.5 0.0 1.5 1.0 0.5 0.0 GATA3
IL-4 IL-5 IL-10
ROR γt IL-17 IL-21 GM-CSF BATF JunB 1.5 1.0 0.5 0.0 200 150 50 0 100 200 150 50 0 100
Fig. 3 Chi3l1 KO CD4 T cells are prone to Th1 differentiation. a, b MACS-sorted WT and Chi3l1 KO naive CD4 T cells were differentiated into Th1, Th2, and Th17 cells under specific cytokine-skewing condition, and Intracellular cytokine staining performed to analyze lineage-specific cytokine expression. c IFNγ,
TNFα, IL-4, and IL-17 production in culture supernatants were measured by ELISA. d Lineage specific mRNA levels were analyzed by quantitative RT-PCR.
Each gene expression level was normalized toβ-actin, and represented as relative expression to WT. Data are mean ± SD of eight sets of independent
compared to dNP2-siEGFP-treated group. Histological analysis of
sectioned slides revealed that infiltrated tumors around blood
vessels were significantly decreased in dNP2-siChi3l1 mice
(Fig.
9
e). In addition, increased infiltrated IFNγ-producing CD4
T cells and Granzyme B-producing CD8 T cells were noted in the
lungs by dNP2-siChi3l1 (Fig.
9
f, g). The protein level of
intra-cellular T-bet in both IFNγ-producing CD4 and CD8 T cells was
significantly higher by dNP2-siChi3l1 treatment than the mice
with dNP2-siEGFP treatment (Fig.
9
h). However, no difference
was noted in NK1.1 positive NK cells and NK1.1
-CD4
-CD8
−cells
on IFNγ or Granzyme B expression by dNP2-siChi3l1 treatment
(Supplementary Fig.
8
) suggesting peptide-siRNA complex
treatment specifically influences T cell functions. Consistent with
the RNA-sequencing data and RT-PCR results,
dNP2-siChi3l1-treated mice showed increased gene expression of anti-tumor
immunity molecules CTSE, TRAIL, IFNγ, T-bet, Perforin, and
Granzyme B, while the levels of Th1-inhibitory molecules such as
Twist1 and SOCS1 were significantly down-regulated (Fig.
9
i).
Free siChi3l1 treatment without dNP2-HA2 peptide does not
effect on melanoma lung metastasis and cytokine productions by
T cells (Supplementary Fig.
9
) suggesting dNP2-HA2 complex is
critical for inhibition of metastasis. Furthermore, when we started
to treat dNP2-siChi3l1 intranasally at 2 days after intravenous
tumor injection as a therapeutic scheme, it also still significantly
decreased the number of tumor colonies in the lung with
increased expression of IFNγ and TNFα expressing CD4 and
CD8 T cells suggesting it could inhibit tumor growth in the lung
as a therapeutic agent (Supplementary Fig.
10
). Collectively, these
data suggest that dNP2-siChi3l1 is an effective and a novel siRNA
complex agent significantly enhances anti-tumor immunity of
Th1 and CTL responses to inhibit tumor metastasis or growth in
the lung.
Discussion
Chitinase-like protein is an evolutionarily conserved protein in
mammals and does not show enzymatic activity
4,5, while
chit-inase is an enzymatic defense system against pathogens in lower
organisms
23,24. In mammals, Chi3l1, BRP-39, and YKL-40 are
expressed by cells including macrophages, chondrocytes, and
synovial cells and are involved in inflammation and tissue
remodeling
6,25. Biological and physiological studies have shown
that macrophage expression of Ym-1 is highly induced by IL-4
and STAT6, which are recognized as M2 macrophage markers,
and induced Ym-1 promotes Th2 cytokine production and airway
inflammation
7,8,17,26. In addition, Ym-1/2 induce
γδ
T-cell-mediated neutrophil migration and IL-17 production against
nematode infection in mice
9. Since no human homologs of Ym-1/
a
b
c
d
e
f
g
pSTAT1 β-actin Relative Intensity of pSTAT1 0 0 5 10 20 5 10 20 (min) (min) + IFNγ (20 ng/mL) NA WTChi3l1KO WT Chi3l1 KO WT Chi3l1KO 0 0 5 1020 5 1020Relative intensity Relative intensity
Relative % of IFN γ tSTAT4 pSTAT1 100 KDa Anti-IFNγ neutralizing antibody tSTAT1 pSTAT4 β-actin pSTAT1 tSTAT1 pSTAT6 tSTAT6 β-actin 18.3 16.4 7.77 0 5 μg/mL 20 μg/mL 24.2 20.1 5.42 IL-4 IFNγ Th1 WT Chi3l1 KO WT pSTAT1 pSTAT4 pSTAT1 pSTAT6 Chi3l1 KO Th2
Relative intensity Relative intensity
Anti-IFNγ neutralizing antibody 13.3 9.89 2.99 0 5 μg/mL 20 μg/mL 11.8 15.7 3.31 18.6 13.1 6.6 27.4 20.1 6.32 3.28 5.19 6.66 4.56 3.76 5.0 Granzyme B IFNγ WT Chi3l1 KO Relative % of IFN γ Relative % of Granzyme B 100 KDa 100 KDa 100 KDa 100 KDa 100 KDa 75 KDa 75 KDa 45 KDa 45 KDa 100 KDa 45 KDa 2.0 1.5 1.0 0.5 0.0 1.0 0.8 0.6 0.4 0.2 0.0 2.0 WT Chi3l1 KO * * 1.5 n.s. n.s. 1.0 0.5 0.0 2.5 2.0 1.5 1.0 0.5 0.0 0.8 ** 0.6 0.4 0.2 0.0 105 105 104 104 103 103 102 –102 0 0 105 105 104 104 103 103 102 –102 0 0 105 105 104 104 103 103 102 –102 0 0 105 105 104 104 103 103 102 –102 0 0 105 105 104 104 103 103 102 –102 0 0 105 105 104 104 103 103 102 –102 0 0 105 105 104 104 103 103 102 0 0 105 105 104 104 103 103 102 0 0 105 105 104 104 103 103 102 0 0 105 105 104 104 103 103 102 0 0 105 105 104 104 103 103 102 0 0 105 105 104 104 103 103 102 0 0 200 150 100 50 0 250 * n.s. n.s. 200 150 100 50 0 WT Chi3l1 KO WT Chi3l1 KO WT Chi3l1 KO 150 ***n.s. * *** n.s. * 100 50 0 0 μg/mL 20 μg/mL 5 μg/mL 0 μg/mL 20 μg/mL 5 μg/mL
Fig. 4 Increased Th1 and CTL response in Chi3l1 KO T cells are IFNγ dependent. a Phosphorylation of STAT1, STAT4, STAT6 were analyzed by Western
blotting. Relative densitometric analysis of Western blotting normalized to total STAT.b WT and Chi3l1 KO naive CD4 T cells were differentiated into
Th1 cells with the indicated concentrations of IFNγ neutralizing antibodies and assessed for IFNγ and IL-4 expression by intracellular cytokine staining. c
Proportion of IFNγ producing cells were represented by relative % of IFNγ to WT Th1. d FACS-sorted WT and Chi3l1 KO naïve CD4 T cells were treated
with IFNγ and pSTAT1 level was analyzed by Western blotting. Densitometric values of band intensity was calculated by normalization to the value
ofβ-actin. e Intracellular level of IFNγ and Granzyme B in CD8 T cells. f Proportion of IFNγ producing cells were represented as relative % of IFNγ to WT
CD8 T cells without anti-IFNγ neutralizing antibody. g Proportion of Granzyme B expressing cells were represented as relative % of Granzyme B to WT
CD8 T cells without anti-IFNγ neutralizing antibody. Data are mean ± SD of three sets of independent experiments (n = 6). n.s., not significant; *p < 0.05, ***p < 0.001
2 are identified, the application of these Ym-1/2 findings in actual
human diseases could be significantly limited. On the other hand,
Chi3l1, highly homologous to Ym-1/2, is expressed both in
human and rodent species. Importantly, the dysregulated
expression of Chi3l1 is also significantly associated with many of
human diseases including asthma and various tumors. In recent
studies using transgenic or KO mice of Chi3l1 in various animal
models of lung diseases showed an essential role of Chi3l1 in the
pathogenesis of inflammation and tissue remodeling
6,10,11,27,28.
Chi3l1 expression is highly increased in Th2 inflammatory
con-ditions induced by OVA/Alum and house dust mite (HDM), and
IL-13 transgenic mice
6. Chi3l1 KO mice show reduced Th2
inflammation, and overexpression of YKL-40 reverses this
phe-notype
6,29. In addition, IL-13 production by T cells and Th2
inflammation in lung-specific overexpression of IL-18
30are
sig-nificantly reduced by Chi3l1 KO, however, IFNγ production by
T cells and Perforin, Granzyme B levels are significantly increased
by Chi3l1 deficiency
14. Although these studies identified Chi3l1
as a significant immune modulator, the immune regulatory
function of Chi3l1 especially in T cells has not been characterized.
Here, we demonstrate that Chi3l1 is expressed in activated T cells
and Th2 cells, then regulates Th1 and Th2 differentiation through
increased IFNγ signaling. The genetic and chemical ablation of
Chi3l1 in T cells significantly enhances Th1 and CTL responses
and inhibits tumor growth and lung metastasis. Our studies also
suggest that Chi3l1 regulation of T cell response is a critical event
in the pathogenesis of inflammatory and tissue remodeling and
tumor growth and progression in which the expression of Chi3l1
is dysregulated.
Previous studies revealed that IL-13Rα2 mediates the
Chi3l1 signaling and various effector function of Chi3l1 as a
putative receptor
31. Exogenous Chi3l1 physically interacts with
IL-13Rα2, and recombinant Chi3l1 treatment enhances Erk/Akt
phosphorylation
and
β-catenin nuclear translocation in
THP1 cells. TMEM219 is reported to be another component of
the Chi3l1-13Rα2 complex that physically binds to
IL-13Rα2
32. TMEM219 deficiency dampens the function of the
Chi3l1-IL-13Rα2 axis. However, we did not observe any effect of
recombinant mouse Chi3l1 (rmChi3l1) treatment on Th1 or Th2
differentiation in vitro, while treatment of rmChi3l1 significantly
a
b
e
d
Relativ e e xpression Relativ e e xpression Relativ e e xpression Relativ e e xpression Relativ e e xpression Relativ e e xpression Relativ e e xpression Relativ e e xpression Relativ e e xpression Relativ e e xpression Relativ e e xpression Relativ e e xpression Relativ e e xpression Relativ e e xpression Relativ e e xpression Relativ e e xpression Relativ e e xpression Relativ e e xpression Relativ e e xpression Relativ e e xpression Relativ e e xpression Relativ e e xpression Relativ e e xpression CTSE CXCR2 CXCR3 CCR5SOCS1 SOCS3 SOCS5 Twist1
SOCS1 SOCS3 SOCS5
CXCR2 CXCR3 CCR5 T-bet Perforin Grazyme B Twist1 CTSE TRAIL TRAIL IFNγ IFNγ
c
KO-Th1 / WT-Th1WT–NA KO–NA WT–Th1 KO–Th1
K O-Th1 WT-Th1 / WT-NA 2.0 * * *** ** * * ** *** *** * * * * ** ** 1.5 1.0 0.5 0.0 2.0 1.5 1.0 0.5 0.0 2.0 1.5 1.0 0.5 0.0 1.5 1.0 0.5 0.0 1.5 1.0 0.5 0.0 1.5 1.0 0.8 0.6 0.4 0.2 0.0 1.0 10 8 6 4 2 0 0.8 0.6 0.4 0.2 0.0 1.0 0.5 0.0 2.0 8 6 4 4 3 2 1 0 2 0 n.s. n.s. n.s. n.s. n.s. n.s. 1.5 1.0 0.5 0.0 2.0 1.5 1.0 0.5 0.0 2.0 1.5 1.0 0.5 0.0 2.0 1.5 1.0 0.5 0.0 2.0 1.5 1.0 0.5 0.0 1.5 1.0 0.5 0.0 2.0 1.5 1.0 0.5 0.0 2.0 1.5 1.0 0.5 0.0 2.0 1.5 1.0 0.5 0.0 2.0 2.5 1.5 1.0 0.5 0.0 2.0 2.5 1.5 1.0 0.5 0.0 1.5 1.0 0.5 0.0 KO-Th1 / KO-NA 182 138 1 7 69 2246 0 31 87 482 547 59 2 543 2102 72 105 670 –3.0 0.0 3.0 Twist1 25.0 KO-Th1/WT-Th1 cxcr2 tnfsf10 ctse ifng socs1 Twist1 25.0 WT-Th1 20.0 20.0 15.0 15.0 10.0 10.0 5.0 5.0 0.0 Stat4 Socs4 II12rb2 ifng Jak2 Tyk2 Socs1 Stat1 Pias1 Cxcr2 Eomes Csf2 Ctse Tnfsf10 n.s. n.s. WT Chi3l1 KO WT Chi3l1 KO
Fig. 5 RNA transcriptomes of Chi3l1 KO T cells. a 100-bp pair-ended RNA-sequencing in naïve, Th1-skewed WT, and Chi3l1 KO CD4 T cells. The number of
up-regulated genes were indicated as red, and down-regulated genes were indicated as green in each comparative analysis.b Heatmap analysis of genes of
interest.c Scatterplot indicates either of over than two-fold up-regulated and down-regulated genes in WT Th1 versus Chi3l1 KO Th1 comparison. d
Expression of genes of interest related to cytotoxicity and the IFNγ signaling pathway in Th1 cells were confirmed by quantitative RT-PCR. Each gene
expression level was normalized toβ-actin, and represented as relative expression to WT. e Quantitative RT-PCR was performed in activated CD8 T cells.
Each gene expression level was normalized toβ-actin, and represented as relative to WT. Data are mean ± SD of ten sets of independent experiments (n =
reduces pro-inflammatory cytokine production in LPS-stimulated
peritoneal macrophages (Supplementary Fig.
11
). In addition,
IL-13Rα2 mRNA was not detected in T cells with a significant
phenotype onto dNP2-siChi3l1 treatment, suggesting an
alter-native biological mechanism of Chi3l1 in regulation of T cell
differentiation and activity. Recently Chi3l1 was reported as
localized in the cytosol and the nucleus, which could promote
monocyte-derived DC maturation
33. We also speculate a
possi-bility that intracellular Chi3l1 could be able to regulate T cell
functions through more direct interaction with the molecules
working at the levels of cytosol or nucleus. Based on
RNA-sequencing analysis in our study, Twist1 is proposed as a target
molecule regulated by Chi3l1. Twist1 is a member of the basic
helix-loop-helix family and has been studied as a negative
reg-ulator of Th1 differentiation by suppression of IFNγ production
and T-bet and Runx3 functions
34,35. In addition, Twist1 induces
SOCS1, which inhibits STAT1 phosphorylation to regulate the
IFNγ signaling pathway
34. Thus, it is reasonable to speculate that
the decreased expression of Twist1 in the Chi3l1-deficient
Th1 cells could be responsible for the increased IFNγ signaling
and related effector functions of T cells. In turn, increased IFNγ
signaling in Chi3l1 KO T cells shows more potent tumor-killing
activity with increased tumoricidal expression of molecules such
as CTSE, TRAIL, and Granzyme B. Previously, IFNγ has been
shown to increase the expression of ctse
36and trail
37, which
contribute to tumor clearance in mice
37–39. In addition, IFNγ also
WT
a
b
e
% of IFN γ + cells # of pleural colonies % of IFN γ + cells % of Foxp3 + cells MFI of Granzyme Bc
Chi3l1 KO WT Chi3l1 KO WT Chi3l1 KO WT Chi3l1 KOd
g
k
f
% of IFN γ + cells % of IFN γ + cells Granzyme B NK1.1 –CD4 –CD8 – CTL activity (%) NK cell activity (%) NK1.1 +CD4 –CD8 – IFNγ E:T ratio E:T ratio Granzyme B IFNγ 44.6 47.1 9.86 10.9 5.18 6.22 Foxp3 CD4 + 7.48 3.02 13.5 8.84 1.1 0.99 23.7 2.36 1.36 2.96 CD8 + IFNγRelative size of melanoma colony
h
i
j
Relative expression Relative expression
Relative expression
Relative expression Relative expression Relative expression
Relative expression
Relative expression
Relative expression
IFNγ T-bet Perforin Twist1
Relative expression Relative expression
SOCS1
Relative expression
SOCS3
Relative expression
SOCS5 CXCR2 CXCR3 CCR5
CTSE TRAIL Granzyme B
MFI of Granzyme B MFI of Granzyme B 3.35 3.51 0.31 0.29 0.42 0.51 150 *** * 100 50 0 25 4 80 n.s. n.s. n.s. n.s. 250 200 150 100 50 0 250 200 150 100 50 0 60 40 20 0 80 60 40 20 0 80 60 40 20 0 5:1 2:1 1:1 0.5:1 0.1:1 8:1 4:1 1:1 n.s. * * * ** 3 2 1 0 20 15 10 5 0 30 20 10 0.025 0.10 0.08 0.06 0.04 0.02 0.00 0.06 0.04 0.02 0.00 0.0006 0.005 0.004 0.003 0.002 0.001 0.000 0.005 0.015 0.010 0.005 0.000 0.004 0.003 0.002 0.001 0.000 0.004 0.003 0.002 0.001 0.000 0.0004 0.0002 0.0000 0.06 0.04 0.02 0.00 * * * * * ** ** 0.020 0.015 0.010 0.005 0.000 0.025 0.020 0.015 0.010 0.005 0.000 0.010 0.012 0.011 0.010 0.009 0.008 0.007 0.006 0.008 0.006 0.004 0.002 0.000 0.015 0.010 0.005 0.000 0 150 100 50 0 WT WT Chi3l1 KO Chi3l1 KO
Relative size of tumor infiltration
** 20 15 10 5 0 WT Chi3l1 KO WT Chi3l1 KO WT Chi3l1 KO 105 105 104 104 103 103 102 –1002 0 105 105 104 104 103 103 102 –1002 0 105 105 104 104 103 103 102 –102 0 0 105 105 104 104 103 103 102 –1002 0 105 105 104 104 103 103 102 –1002 0 105 105 104 104 103 103 102 –1002 0 105 105 104 104 103 103 102 –102 0 0 105 105 104 104 103 103 102 –1002 0 WT Chi3l1 KO WT Chi3l1 KO WT Chi3l1 KO 150 8 6 4 2 0 100 50 0 n.s. n.s. * * n.s. n.s.
Fig. 6 Chi3l1 KO mice have reduced pulmonary metastasis with increased IFNγ-producing CD4 and CD8 T cells in the lung. a Representative lung image
from B16F10 melanoma injected WT and Chi3l1 KO mice. Scale bar, 2 mmb Number of pleural colonies in each lung was counted. Data are mean± SEM of
three sets of independent experiments and each dot in graphs represent an individual mouse.c Relative total tumor area in the lung was measured by
Image J software 1.48 v.d Histology of lung sections by H&E staining, and infiltrated tumor region was measured by Image J software 1.48 v. Scale bar, 200 m.e, f IFNγ producing CD4 T cells, Foxp3 + regulatory T cells, IFNγ producing CD8 T cells, and Granzyme B expression in IFNγ+CD8 T cells in the lung was analyzed by intracellular cytokine staining. % of IFNγ+, % of Foxp3+, and MFI of Granzyme B was represented as scattered graph.g, h IFNγ producing NK
cells IFNγ producing non-lymphocytic population, and Granzyme B expression in IFNγ+NK cells and non-lymphocytic population in the lung was analyzed.
% of IFNγ+, and MFI of Granzyme B was represented as scattered graph.i mRNA expression of genes related to cytotoxicity and Th1 effector functions was
analyzed by quantitative RT-PCR. Each gene expression level was normalized toβ-actin. j Cytotoxicity of WT and Chi3l1 KO CD8 T cells against B16F10
target cells at indicated E:T ratios.k NK cell activity was represented as tumor killing activity of WT and Chi3l1 KO NK cells against to B16F10 target cells at
indicated E:T ratios. Data are mean± SD of three sets of independent experiments and each dot in graphs represent an individual mouse. n.s., not
was reported to induce the expression of T-bet, which promotes
Perforin and Granzyme B expression in CD8 T cells
40,41.
How-ever, we did not observe significant functional differences in
Chi3l1 KO NK cells compared to WT NK cells in tumor-killing
activity or effector molecule expression in vitro and in vivo. As
presumably mRNA expression of Twist1 was significantly lower
in NK cells than T cells, no difference was noted in the expression
of Twist1, T-bet, IFNγ, Granzyme B, and Perforin between WT
and Chi3l1 KO NK cells (Supplementary Fig.
12
). These studies
further suggest that T cells are potentially major drivers of IFNγ
and other cytotoxic gene expression associated with anti-tumor
activity in the absence of Chi3l1. The exact molecular mechanism
of Chi31l in the expression of Twist1 and other genes need to be
further defined in the future studies.
Chi3l1 was discovered in mouse breast cancer cells and has
been
studied
regarding
tumors
and
inflammatory
dis-eases
6,10,11,27,28. Chi3l1 is elevated in patients with a variety of
tumors, and recent studies have suggested that Chi3l1 promotes
cancers by enhancing cell proliferation, angiogenesis, etc
28,42–44.
In addition, recent studies have shown that Chi3l1 that is induced
by the Semaphorin7A-β1 integrin signaling pathway contributes
to establishment of a metastatic microenvironment in the lung
10,
and RIG-like Helicase activation reduces Chi3l1 expression,
which results in suppression of tumor progression in the lung
11.
More recently, it was reported that Chi3l1 by
fibroblast enhances
migration and growth of breast cancer, and knockdown of Chi3l1
by shRNA increases T cell population and IFNy, TNFα
expres-sion
45. Here, we added a novel regulatory function for intrinsic
Chi3l1 in anti-tumor T cell immunity in pulmonary metastasis
through functional regulation of Th1 cells and CTL activity. Thus,
these
findings further suggest that Chi3l1 is an important
ther-apeutic target for treating tumors with dysregulated expression of
Chi3l1. Recently, IL-4 and Th2 inflammation was shown to
promote B16F10 melanoma metastasis
15. Since Chi3l1 deficiency
WT +/+ +/– –/– WT CD4-Cre Chi3l1-loxp 450 bp 100 bp 600 bp % of IFN γ + cells # of pleural colonies % of IFN γ + cells dCT of CTSE dCT of Granzyme B dCT of Perforin dCT of IFN γ dCT of Twist1 dCT of T-bet
dCT of SOCS1 dCT of SOCS3 dCT of SOCS5
dCT of CXCR2 dCT of CXCR3 dCT of CCR5 dCT of TRAIL % of TNF α + cells % of TNF α + cells % of TNF α + cells % of TNF α + cells CD4-Chi3l1 KO WT CD4-Chi3l1 KO WT CD4-Chi3l1 KO WT CD4-Chi3l1 KO % of IFN γ + cells % of IFN γ + cells % of TNF α + IFN γ + cells % of TNF α + IFN γ + cells % of TNF α + IFN γ + cells % of TNF α + IFN γ + cells TNF α NK1.1 –CD4 –CD8 – NK1.1 +CD4 –CD8 – IFNγ TNF α IFNγ 44.9 42.5 1.77 1.51 1.12 0.62 CD4 + 3.21 8.1 7.66 0.48 6.75 5.11 3.68 10.7 6.62 14.7 25.3 27.5 CD8 + 4.09 3.29 1.77 1.66 11.5 12.2 *** 50 40 30 20 10 0 60 40 20 0 50 40 30 20 10 0 15 10 5 0 105 104 103 0 105 104 103 0 105 104 103 0 105 105 104 104 103 103 0 0 105 104 103 0 105 104 103 0 105 104 103 0 105 104 103 0 0 103 104 105 105 104 103 0 0 103 104 105 105 104 103 0 105 104 103 0 105 104 103 0 105 104 103 0 15 10 25 20 5 0 5 4 3 2 1 0 15 10 20 5 0 8 6 4 2 0 4 3 2 1 0 2.0 1.5 1.0 0.5 0.0 15 10 5 –5 0 300 200 100 0 WT CD4-Chi3l1 KO CD4-Chi3l1 KOWT 0.06 0.04 0.02 0.00 0.15 0.10 0.05 0.00 0.010 0.008 0.006 0.004 0.002 0.000 0.10 0.08 0.06 0.04 0.02 0.00 n.s. n.s. n.s. n.s. n.s. n.s. n.s. n.s. n.s. n.s. * ** ** ** ** ** ** * * * * * * * ** 0.0006 0.0004 0.0002 0.0000 0.005 0.004 0.003 0.002 0.001 0.000 0.015 0.010 0.005 0.000 0.005 0.004 0.003 0.002 0.001 0.000 0.005 0.004 0.003 0.002 0.001 0.000 0.15 0.10 0.05 0.00 0.15 0.10 0.25 0.20 0.05 0.00 0.03 0.02 0.01 0.00 8 6 4 2 0 0.010 0.020 0.000 0.005 0.015
a
b
c
d
e
f
i
g
h
Fig. 7 Chi3l1 deletion in T cell inhibits pulmonary metastasis with increase of Th1 and CTL. a Genotyping PCR to confirm CD4 specific deletion of Chi3l1 in
the mice.b Representative lung image from B16F10 melanoma injected WT and CD4-Chi3l1 KO mice. Scale bar, 2 mm c Number of pleural colonies in each
lung was counted. Data are mean± SEM of three sets of independent experiments and each dot in graphs represent an individual mouse. d Histology of
lung sections by H&E staining. Scale bar, 200 m (e, f) IFNγ and/or TNFα producing CD4 T cells and CD8 T cells in the lung was analyzed by intracellular cytokine staining. % of IFNγ+, % of TNFα+, and % of TNFα+IFNγ+was represented as scattered graph.g, h IFNγ and/or TNFα producing NK cells, and
non-lymphocytic populations (NK1.1-CD4-CD8-) in the lung was analyzed by intracellular cytokine staining. % of IFNγ+, % of TNFα+, and % of TNFα+IFNγ+was
represented as scattered graph.i mRNA expression of genes related to cytotoxicity and Th1 effector functions was analyzed by quantitative RT-PCR. Each
gene expression level was normalized toβ-actin. Data are mean ± SD of three sets of independent experiments and each dot in graphs represent an
reduced IL-4 production in Th2 cells while increasing IFNγ
expression in Th1 and CD8 T cells, targeting Chi3l1 could
pro-vide prominent anti-tumor effect by driving Th1 response while
suppressing the activity of tumor-promoting Th2 cells. In
addi-tion, dNP2-siChi3l1 treatment did not inhibit proliferation of
melanoma cells (Supplementary Fig.
13
), suggesting that its
in vivo inhibitory effects on lung metastasis were mainly due to
the enhanced anti-tumor immunity, not by inducing direct tumor
cell death or suppressing proliferation of tumor cells.
Recently, cancer immunotherapy has been highlighted and
clinically validated for many cancers which enhances
tumor-killing T cell functions including immune checkpoint blockade
such as anti-PD-1 and anti-CTLA-4 antibodies, engineered T cell
therapy utilizing chimeric antigen receptors (CAR), and cancer
vaccines, etc
46–50. Although cancer immunotherapy has been
emerging as an important addition to conventional therapies, still
there have been reported side effects or limitations of current
approaches to have autoimmune responses in significant
popu-lations of patients or less effective due to individual variabilities of
tumor antigens
47,49,51. Although we do not know whether Chi3l1
is implicated in the regulation of immune checkpoint molecules
such as PD-1 in the T cells, it is intriguing to speculate that Chi3l1
could complement the immunotherapy against the tumors that
do not respond to current immunotherapy or other approaches.
Based on Chi3l1 KO mouse phenotypes in the B16F10 melanoma
lung metastasis model, we developed a novel tumor treatment
agent based on siRNA and cell-penetrating peptide (CPP)
com-plexes. Previously, we identified and reported novel
human-Intranasal delivery of 2.5 μg siRNA / 70 μg peptide (1:25 N/P ratio) Intranasal delivery of 2.5 μg siRNA / 70 μg peptide (1:25 N/P ratio) Relativ e intensity of Chi3l1 protein Chi3l1 dNP2-siEGFP pDNA Lipo-siChi3l1 dNP2-siChi3l1 – – – + – – + + – + – 100 + – 250 + – 500(ng) pDNA Lipo-siChi3l1 dNP2-siChi3l1 – – – + – – + + – + – 100 + – 250 + – 500(ng) – – – + + + + + + – – – – – dNP2-siChi3l1 β-actin NP ratio dNP2-HA2 peptide dNP2-siChi3l1 1:10 1:25 1:1 Chi3l1 siRNA 1:1 1:10 1:25 – N/P ratio 1:11:101:25 Relativ e e xpression of Chi3l1 mRNA Relativ e e xpression of Chi3l1 Siz e of dNP2-siRNA (nm) Chi3l1 (ng/mL) 150 100 50 0 15000 10000 5000 0 400 300 200 100 0 *** n.s. n.s. n.s. ***** ** ** ** * * * * 2.5 2.0 1.5 1.0 0.5 0.0 dNP2-siEGFP dNP2-siChi3I1 dNP2-siEGFP dNP2-siChi3I1
Day 1 Day 2 Day 3 Day 0 Day 1 Day 2 Day 3
2.0 1.5 1.0 0.5 0.0 ** * 0 3.19 8.19 30.3 0 0 2.94 2.74 6.56 26.6 8.67 28.4 4.64 6.37 6.72 55.2 11.4 47.6 0 3.06 10 21 0 0 3.05 3.54 11.9 23.6 11.3 23.5 4.6 4.29 16.3 39.7 14.4 31.1 TNF α IFNγ Relativ e e x pression of Chi3l1 Relativ e e x pression of IFN γ % of TNF α + IFN γ + cells % of TNF α + IFN γ + cells NA PBS 100 ng 250 ng 100 ng 250 ng dNP2-siChi3l1 dNP2-siEGFP Th1 CD8 T cell – 100 – – – – – 250 – – + + + + + –100 250 (ng) dNP2-siEGFP Anti-CD3/28 dNP2-siChi3l1 – – – – – – 100 250 – – + + + + + – + + + –100 250 (ng) 100 250(ng) dNP2-siEGFP Th1 skewing dNP2-siChi3l1 Th1 skewing dNP2-siChi3l1 – + + + 100 250(ng) Th1skewing dNP2-siChi3l1 60 40 20 0 4 3 2 1 0 50 40 30 20 10 0 n.s. n.s.*** *** ** ** ** ** ** ** * * * 1.5 1.0 0.5 0.0 105 105 104 104 103 102 103 0 105 104 103 102 0 105 104 103 102 0 105 104 103 102 0 105 104 103 102 0 105 104 103 102 0 105 104 103 102 0 105 104 103 102 0 105 104 103 102 0 105 104 103 102 0 105 104 103 102 0 105 104 103 102 –102 –102 –102 –102 –102 –102 0 0 0 103104105 0 103104105 0 103104105 0 103104105 0 103104105 105 104 103 0 0 103104105 0 103104105 0 103104105 0 103104105 0 103104105
Free siRNAFree peptide
Day 0
Day 1 Day 2 Day 3 Day 0
a
b
c
d
e
f
g
h
i
j
k
Fig. 8 Targeted inhibition of Chi3l1 by dNP2-siChi3l1 complex enhances effector cytokine production in Th1 and CD8 T cells. a Schematic diagram of the
complex formation of dNP2-HA2 peptide and Chi3l1 siRNA (siChi3l1) at indicated N/P ratios.b Gel retardation assay of dNP2-siChi3l1 complex. c The size
of free siRNA, free peptide, and dNP2-siRNA complexes were measured by Nano particle size analyzer.d Dose dependent reduction of Chi3l1 mRNA
expression by dNP2-siChi3l1 complex at 1:25 N/P ratio.e Chi3l1 protein level in culture supernatants were measured by ELISA. f Chi3l1 mRNA in the lung
after intranasal administration of dNP2-siEGFP or dNP2-siChi3l1 complex at 1:25 N/P ratio. Chi3l1 mRNA normalized toβ-actin, and presented as relative to expression at day 0.g Chi3l1 protein level in the lung was analyzed by Western blotting. Chi3l1 protein relative to expression at day 0. h Densitometric values of band intensity was calculated by normalization to the value ofβ-actin, then the value was represented as relative to the value at day 0. Statistical
significance of dNP2-siChi3l1 treated group was analyzed to dNP2-siEGFP treated group on each day. i FACS-sorted WT naïve CD4 T cells were
differentiated into Th1 cells and WT naïve CD8 T cells were activated by plate-bound anti-CD3 and anti-CD28 antibodies with IL-2 for 5 days with
indicated concentrations of dNP2-siEGFP or dNP2-siChi3l1 complexes. IFNγ and TNFα expression were analyzed by flow cytometry. j % of TNFα+IFNγ+
cells were represented as bar graph.k Chi3l1 and IFNγ mRNA expression in dNP2-siChi3l1 treated Th1 cells. Each gene expression level was normalized to
β-actin, and represented as fold change to those of WT Th1 cell. Data are presented as mean ± SD of three sets of independent experiments (n = 6). n.s., not significant; *p < 0.05, **p < 0.01, ***p < 0.001 (two-tailed Student’s t-test)
derived CPPs such as LPIN3
52, 2pIL-1αNLS
53and their
appli-cation potentials
54. Recently, we identified another
human-derived CPP, dNP2 that efficiently escapes blood vessels and
localizes into resident cells in tissues differently from other CPPs
such as TAT or Hph-1
20. In addition, we showed it could be
efficiently delivered into lymphocytes including T, B, and NK
cells which are hardly transfected cells
21. Here we utilized dNP2
peptide for effective siRNA delivery targeting Chi3l1 in tumor
dNP2-siEGFP D0
5 × 10⁵ B16F10
by iv injection
Analysis Intranasal delivery of 2.5 μg dNP2-siEGFP or dNP2-siChi3l1,
twice per day (1:25 N/P ratio)
D2 D4 D6 D8 D10 D12 D14 % of IFN γ + cells % of IFN γ + cells dNP2-siChi3l1 dNP2-siEGFP dNP2-siChi3l1 dNP2-siEGFP MFI of Gr anzyme B CD4+IFNγ+ CD8+IFNγ+ MFI MFI T-bet dNP2-siChi3l1
Relative expression Relative expression Relative expression Relative expression Relative expression
Relative expression
Chi3l1
IFNγ T-bet Perforin Granzyme B
Twist1 CXCR2 CTSE TRAIL SOCS1 Granzyme B IFNγ CD4 + CD8 + 15.4 17.6 3.93 7.15 6.88 11.6 # of pleural colonies Relativ e siz e of melanoma colon y % of max Relativ e siz e of tumor infiltr ation Relative expression CXCR3 Relative expression CCR5 Relative expression
Relative expression Relative expression Relative expression
Relative expression SOCS3 SOCS5 Relative expression ** *** 200 150 100 50 0 0.20 0.15 0.10 0.05 0.00 0.15 0.10 0.05 0.00 0.05 0.04 0.03 0.02 0.01 0.00 0.05 0.04 0.03 0.02 0.01 0.00 0.0004 0.0003 0.0002 0.0001 0.0000 0.05 0.04 0.03 0.02 0.01 0.00 0.04 0.03 0.02 0.01 0.00 0.04 0.03 0.02 0.01 0.00 0.008 0.006 0.004 0.002 0.000 0.008 0.006 0.004 0.002 0.000 0.06 0.04 0.02 0.00 0.008 0.006 0.004 0.002 0.000 0.03 0.02 0.01 0.00 0.4 0.3 0.2 0.1 0.0 2000 1500 1000 500 0 60 40 20 0 40 30 20 10 0 250 200 150 100 50 0 5 4 3 2 1 0 dNP2-siEGFP dNP2-siChi3l1 dNP2-siEGFP dNP2-siChi3l1 dNP2-siEGFP dNP2-siChi3l1 dNP2-siEGFP dNP2-siChi3l1 dNP2-siEGFP * * n.s. n.s. * * * ** dNP2-siChi3l1 dNP2-siEGFP dNP2-siChi3l1 1000 800 600 400 200 0 100 80 60 40 20 0 100 80 60 40 20 0 200 150 100 50 0 * ** * * n.s. n.s. 105 105 104 104 103 102 103 0 105 104 103 0 105 104 103 0 105 104 103 0 0 105 104 102 103 0 105 104 102 103 0 105 104 102 103 0 105 104 103 –1030 105 104 103 –1030 dNP2-siChi3l1 dNP2-siEGFP
a
b
c
d
e
f
g
h
i
* * * ** ** *Fig. 9 In vivo administration of dNP2-siChi3l1 complex inhibits pulmonary metastasis with enhanced Th1 and CTL effector molecules. a Experimental
scheme of dNP2-siRNA complex treatment in pulmonary melanoma metastasis model.b Representative lung image of dNP2-siEGFP and
dNP2-siChi3l1-treated mice. Scale bar, 2 mmc Number of pleural colonies in each lung was counted. Data are mean± SEM of three sets of independent experiments and
each dot in graphs represent an individual mouse.d Relative total tumor area in the lung was measured by Image J software 1.48 v. e Histology of lung
sections by H&E staining, and infiltrated tumor region was measured by Image J software 1.48 v. Scale bar, 200 m f, g IFNγ producing CD4 and CD8 T cells,
and Granzyme B expression level in IFNγ+CD8 T cells in the lung was analyzed by intracellular staining. % of IFNγ+, and MFI of Granzyme B was
represented as scattered graph.h Intracellular T-bet expression level in CD4+IFNγ+and CD8+IFNγ+population. MFI was represented as scattered graph.i mRNA expression of genes related to cytotoxicity and Th1 effector functions was analyzed by quantitative RT-PCR. Each gene expression level was
normalized toβ-actin. Data are mean ± SD of three sets of independent experiments and each dot in graphs represent an individual mouse. n.s., not