저작자표시-비영리-동일조건변경허락 2.0 대한민국 이용자는 아래의 조건을 따르는 경우에 한하여 자유롭게 l 이 저작물을 복제, 배포, 전송, 전시, 공연 및 방송할 수 있습니다. l 이차적 저작물을 작성할 수 있습니다. 다음과 같은 조건을 따라야 합니다: l 귀하는, 이 저작물의 재이용이나 배포의 경우, 이 저작물에 적용된 이용허락조건 을 명확하게 나타내어야 합니다. l 저작권자로부터 별도의 허가를 받으면 이러한 조건들은 적용되지 않습니다. 저작권법에 따른 이용자의 권리는 위의 내용에 의하여 영향을 받지 않습니다. 이것은 이용허락규약(Legal Code)을 이해하기 쉽게 요약한 것입니다. Disclaimer 저작자표시. 귀하는 원저작자를 표시하여야 합니다. 비영리. 귀하는 이 저작물을 영리 목적으로 이용할 수 없습니다. 동일조건변경허락. 귀하가 이 저작물을 개작, 변형 또는 가공했을 경우 에는, 이 저작물과 동일한 이용허락조건하에서만 배포할 수 있습니다.
경제학박사 학위논문
A Comparative Study on
Energy Use and Greenhouse Gas
Emissions in Conventional and
Organic Agriculture
관행농과 유기농의 에너지 사용과
온실가스배출에 관한 비교연구
2013년 2월
서울대학교 대학원
농경제사회학부 지역정보전공
이 기 송
Study for Doctoral Thesis of Economics
A Comparative Study on
Energy Use and Greenhouse Gas
Emissions in Conventional and
Organic Agriculture
Advisor : Prof. Young Chan Choe
February 2013
Kisong Lee
Department of Agricultural Economics
and Rural Development
Graduate School
Seoul National University
Abstracts
A Comparative Study on Energy Use and
Greenhouse Gas Emissions in Conventional and
Organic Agriculture
Kisong Lee
Regional Information
Department of Agricultural Economics
and Rural Development
Graduate School
Seoul National University
How to enhance the efficiency of energy use and to abate greenhouse gas emissions (GHGE) in agriculture has become very decisive in the mitigation of climate change. Organic farming has been recognized as the most reasonable alternative in agriculture to overcome this climate crisis. Studies on comparisons of energy use and greenhouse gas emissions (GHGE) between conventional and organic farming have been carried out vigorously in the previous decades. However, controversies exist over the problems in comparative studies on energy use and greenhouse gas emissions.
Taking these contexts into consideration, the objectives of this study are (i) to identify the structural variables to determine the differences of energy efficiency (EE) and greenhouse gas emissions (GHGE) between conventional and organic farming systems through meta-analysis of previous studies; (ii) to examine which input categories and farming practices cause the differences of energy efficiency (EE) and greenhouse gas emissions (GHGE) between conventional farming systems (CFS) and organic farming systems (OFS) by applying field studies on soybean production in Korea; and
thereby, (iii) to explore alternative solutions to decrease environmental impacts in agriculture.
First, the results of meta-analysis can be summarized as follows.
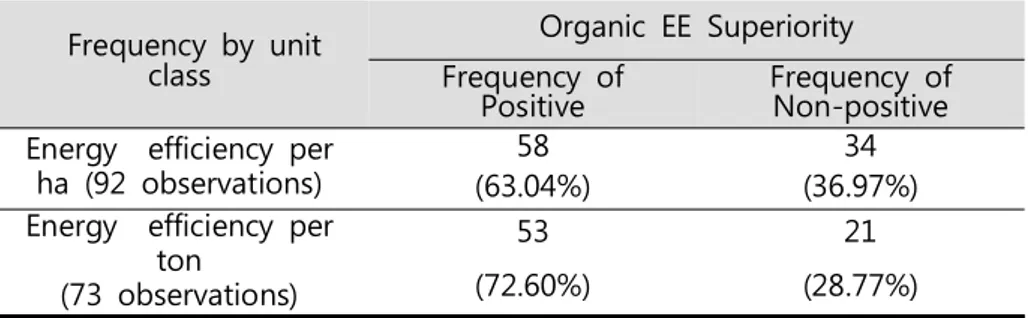
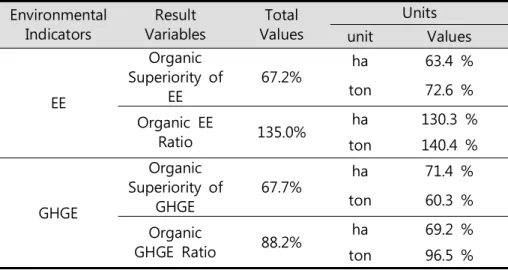
1. The results of the analysis obtained from 165 observations of 68 previous studies on the use of energy illustrate that 67.3% of their observations is positive in the organic superiority of EE - which means organic EE is higher than its counterpart.
2. In comparisons of EE ratio (%), - organic EE versus conventional EE -, the total mean value of EE ratio is 128.5%. This concludes that the EE of organic farming averages approximately 30% higher than that of conventional farming.
3. The results of the analysis on 195 observations of 66 previous studies on GHGE demonstrate that 67.7% of their observation is positive in the organic superiority of GHGE - which means organic GHGE is lower than its counterpart. The organic superiority of GHGE per ha basis is positive by 71.4%, and per ton basis is positive by 60.3%.
4. The GHGE ratio(%) shows 88.2%, which means that GHGE of organic farming is around 12% lower on the average than that of conventional farming. The GHGE ratio average per ha basis is 69.2%, which indicates that the GHGE of organic farming system (OFS) is considerably lower than that of conventional farming system (CFS), and the GHGE per ton basis is 96.5% on the average, which indicates that there is no difference between both systems per ton product unit.
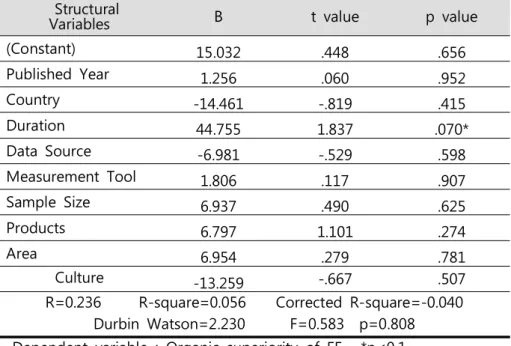
5. As for the structural variables to determine the organic superiority of EE and GHGE, the duration of the data collection is estimated as the significantly influential variable to drive organic superiority of EE. The researcher’s selection on the energy coefficient values of input materials also appears as a very significant factor to affect the difference of EE between conventional farming systems (CFS) and
organic farming systems (OFS). On the other hand, the variables of sample size, unit class, and farm product types appear to have a positive relationship with the organic superiority of GHGE.
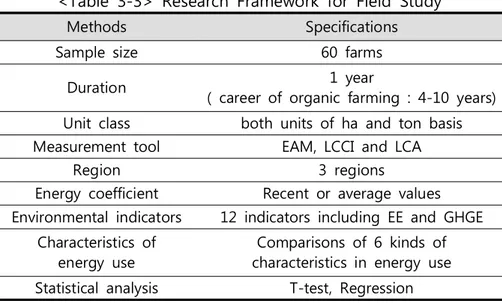
Second, the results of the field study on soybean production systems in Korea show considerable disparities with the European and American experiences.
1. The EE (0.98) of organic soybean farms is noticeably poorer than that of conventional farms (1.56). The energy consumption of OFS is higher than that of CFS, since the yields of OFS are apparently lower than that of CFS.
2. Seeds and mulch film in OFS and pesticides in CFS cause significant differences between both systems. Mulching and seeding used in OFS as well as weeding and spraying in CFS show significant variations between both systems.
3. Analysis of the input variables to drive the EE shows that fuel, fertilizers, mulch film, and labor are the influential input variables. As for the variables regarding farming practices to determine the EE, cultivation, mulching, threshing and grading are significantly related with EE.
4. The GHGE of organic soybean farms (1562.3 kg CO2eq/ha) is relatively lower than that of conventional farms
(2003.2 kg CO2eq/ha). However, with respect to the product
unit basis, the GHGE of organic soybean farms (1629.8kg CO2eq/ton) is inversely just a little higher than that of
conventional farms (1473.1 kg CO2eq/ton).
5. In comparison of the GHGE by input categories between CFS and OFS, seeds and mulch film in OFS and pesticides in CFS led to significant differences between both systems.
6. Analysis of the input variables to drive the outcome of GHGE in both farm systems indicates fertilizers as a variable which is strongly influential.
7. Comparisons of LCIA (Life Cycle Impacts Assessment) between both soybean production systems show that 9 categories except ARD, EP and EU among 12 environmental
impacts appear higher in CFS than in OFS.
8. In soybean production in Korea, fertilizers and manure are responsible for 37% of the total energy consumption in both systems. And they are the absolute contributors to GHGE which amount to 67.8% of total GHGE in both systems. This result indicates that although the use of synthetic fertilizers is reduced, the heavy use of animal manure can contribute greatly to the emission of nitrous oxide, which leads to the increase of GHGE. The substitution of manure in the place of synthetic fertilizers banned under organic agriculture regulations is not a recommendable alternative for organic farming. Therefore, reasonable strategies to mitigate climate change through energy consumption and GHGE reduction should be conducted not within, but beyond the scope of the nitrogen cycle.
Finally, most previous studies did not present detailed statistical data except for the descriptive statistics of performance variables. This has led to limitation in explaining definitely the relationship of performance variables and structural variables. Therefore, for the progress of future EE and GHGE studies, presentation of more detailed data through the appropriate statistical analyses is required.
In addition, more researches are needed in Asian countries including Korea, where studies on energy use and GHGE have not been pursued actively to date.
Key Words : Energy use, Energy efficiency , Greenhouse
gas emissions, Organic farming, Global warming. Climate
change. Meta-analysis
Student ID ; 85514-806
E-mail : lgeesong@gmail.com
Table of Contents
I. Introduction ··· 1
1.1 Problem Statement ··· 1
1.2 Study Objectives ··· 3
II. A Meta-Analysis of Structural Variables in
Environmental Performances :
Comparisons of
Energy Use and Greenhouse Gas Emissions in
Conventional and Organic Farming Systems
··· 4
2.1. Introduction ··· 4
2.2 Review of Literature ··· 6
2.2.1 Indicators for Environmental Performance ··· 7
2.2.2 Study Characteristics ··· 17
2.2.3 Farm Characteristics ··· 27
2.2.4 Selection of Energy Coefficients for EE Studies ··· 33
2.2.5 Other Controversies on Comparative Studies of EE and GHGE ··· 35
2.2.6 Meta-analyses on Environmental Performances ··· 37
2.3 Methods and Data ··· 38
2.3.1 Research Framework of Meta-analysis ··· 40
2.3.2 Result Variables of Meta-analysis ··· 41
2.3.3 Structural Variables and Hypotheses ··· 43
2.3.4 Models of Statistical Analysis for Meta-analysis ··· 50
2.3.5 Procedure of Meta-analysis ··· 52
2.3.6 Data Collection ··· 52
2.4 Results of Meta-analysis ··· 54
2.4.1 General Characteristics of Structural Variables ··· 56
2.4.2 Results of Meta-analysis on the Integrated EE & GHGE Studies ··· 58
2.4.3 Results of Meta-analysis on the EE Studies ··· 63
2.4.4 Results of Meta-analysis on the GHGE Studies ··· 73
2.4.5 Relationship of Energy Coefficients and EE Ratio ·· 82
2.5 Sub-conclusions and Implications ··· 85
2.5.1 Structural Variables Influencing the Organic Superiority in EE and GHGE Studies ··· 85
2.5.2 Implications for Future Research ··· 90
III. An Empirical Field Study :
Comparisons of Energy
Use and Greenhouse Gas Emissions in Conventional
and Organic Soybean Productions of Korea
··· 95
3.1 Introduction ··· 95
3.2 Review of Literature ··· 96
3.3 Methods and Data ··· 99
3.3.1 Research Framework of Field Study ··· 99
3.3.2 Models of Statistical Analysis for Field Study ··· 99
3.3.3 Calculation of EE and GHGE ··· 101
3.3.4 Data Collection ··· 107
3.4 Results of Energy Use ··· 111
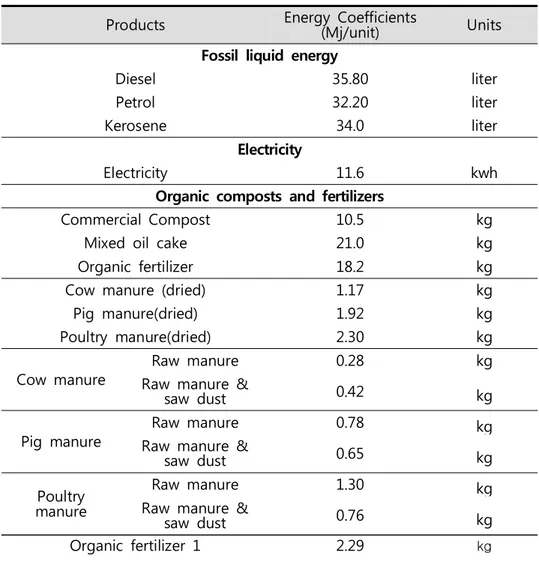
3.4.1 Energy Coefficients ··· 111
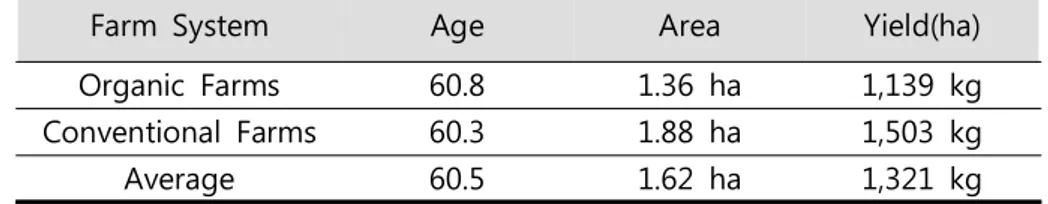
3.4.2 General Characteristics of Farms and Energy Use ··· 132
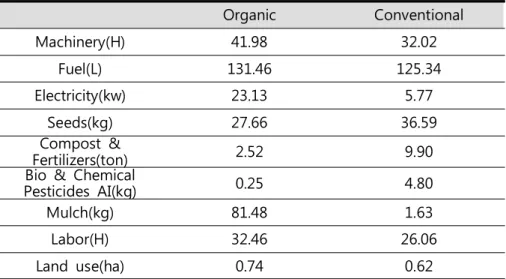
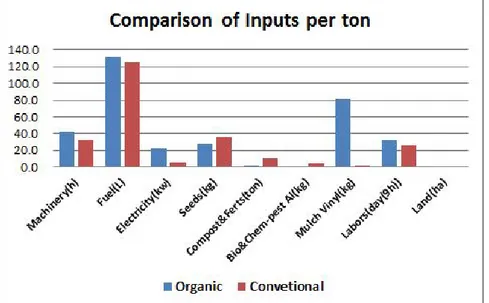
3.4.3 Comparison of Input Materials ··· 133
3.4.4 Comparison of Energy Inputs ··· 139
3.4.5 Comparison of Energy Use in Both Systems ··· 146
3.4.6 Correlations of General Characteristics and EE ··· 149
3.4.7 Comparison on the Characteristics of Energy Use ··· 150
3.4.8 Driving Factors Determining the EE ··· 156
3.5 Results of GHG Emissions ··· 163
3.5.1 GHG Conversion Factors ··· 163
3.5.3 Comparisons of GHGE between CFS and OFS ··· 184
3.5.4 Relationship with Other Variables and the GHGE ··· 200
3.6 Comprehensive Findings from the Results of Field
Study ··· 204
3.7 LCA in Field Study ··· 206
3.7.1 Methods ··· 206
3.7.2 LCIA (Life Cycle Impacts Assessment) ··· 207
3.8 Implications of Field Study ··· 214
IV. Implications and Measurements to Mitigate
Climate Change ··· 215
4.1 Environmental Performances and Food Security 215
4.2 Problem of Nitrogen-based Production Systems. 217
4.3 EE and GHGE in Livestock ··· 218
4.4 Food Consumption and Environmental
Performances ··· 220
4.5 New Trials for Carbon-oriented Farming ··· 223
4.6 Priority of Financial Support ··· 224
4.7 Expansion of Research on Environmental Impacts
··· 225
V. Conclusions ··· 227
5.1 Summary and Conclusions ··· 227
5.2 Limitations and Recommendations ··· 230
References ··· 233
Appendix ··· 251
List of Tables
Table 2-1 Comparisons of Research Frameworks between Independent Study and Meta-analysis ··· 39 Table 2-2 Result Variables in the Meta-analysis ··· 48 Table 2-3 The Categories of Structural Variables in the
Meta-analysis ··· 49 Table 2-4 Statistical Analysis Models for Meta-analysis ··· 51 Table 2-5 The Number of Analyzed Studies ··· 53 Table 2-6 Frequency Distributions of Structural Variables
within Groups ··· 56 Table 2-7 Organic Superiority by Result Variables ··· 58 Table 2-8 Relationship of Structural Variables and Organic
EE & GHGE Superiority by Binary Result Variables 60 Table 2-9 Relationship of Structural Variables and Organic
EE & GHGE Superiority by Continuous Result
Variables ··· 63 Table 2-10 Results of Organic Superiority of EE by Binary
Result Variable ··· 65 Table 2-11 Results of Organic Superiority of EE by
Continuous Result Variable ··· 67 Table 2-12 Frequency of Positive Results in Organic
Superiority of EE ··· 68 Table 2-13 EE Ratio(%) of OFS vs CFS within Groups of
Structural Variables ··· 70 Table 2-14 Comparison of Organic EE Superiority by Unit
Class ··· 72 Table 2-15 Comparison of EE Ratio(%) by Unit Class ··· 72 Table 2-16 Results of Organic GHGE Superiority by Binary
Result Variable ··· 74 Table 2-17 Results of Organic GHGE Superiority by
Table 2-18 Frequency of Organic GHGE Superiority within
Groups of Structural Variables ··· 77
Table 2-19 Frequency of Organic GHGE Superiority by Unit Class ··· 78
Table 2-20 Comparison of GHGE Ratio(%) by Unit Class ··· 79
Table 2-21 The Ratio(%) of GHGE by Structural Variables · 81 Table 2-22 Relationship with Energy Coefficients and EE Ratio(%) ··· 83
Table 2-23 Summary of Organic Superiority and Organic Ratio in EE and GHGE Studies ··· 88
Table 2-24 Summary of Findings by Meta-analysis ··· 89
Table 3-1 Frequency Distributions by Data Sources of Previous Studies ··· 96
Table 3-2 Organic Superiority and Mean Ratio of EE and GHGE by Data Sources ··· 98
Table 3-3 Research Framework for Field Study ··· 99
Table 3-4 Statistical Analysis Models for Field Study ··· 101
Table 3-5 Classification of Energy in Agriculture ··· 105
Table 3-6 Various Indicators on the Energy Use ··· 106
Table 3-7 Numbers of Selected Sample Farms ··· 110
Table 3-8 Embodied Energy of Machinery ··· 113
Table 3-9 Energy Coefficients of Machinery used in Soybean Production Systems ··· 114
Table 3-10 Energy Coefficients of Fertilizers and Manure used in Soybean Production ··· 118
Table 3-11 AI of Chemical and Organic Pesticides used in Surveyed Farms ··· 122
Table 3-12 Energy Coefficients of Inputs Applied in Previous Studies ··· 126
Table 3-13 Energy Coefficients of Inputs applied in This Study ··· 130
Table 3-14 Classification and Frequency of Surveyed Farms ··· 132
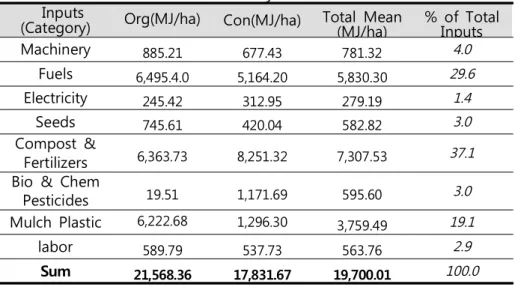
Table 3-15 Comparisons of Ages, Farm Areas and Yields between CFS and OFS ··· 133 Table 3-16 Inputs Per ha in Both Systems ··· 134 Table 3-17 Comparison of Inputs by Categories Per ha ···· 135 Table 3-18 Inputs Required for 1 ton Soybean Production ··· 136 Table 3-19 Comparison of Inputs by Farming Practices Per
ha ··· 138 Table 3-20 Comparison of Energy Inputs by Categories ··· 139 Table 3-21 Energy Inputs by Categories in both Systems · 141 Table 3-22 Comparison of Energy Inputs by Categories and
Farming Practices ··· 142 Table 3-23 Comparison of Energy Inputs by Farming
Practices ··· 145 Table 3-24 Energy Inputs by Farming Practices in Both
Systems ··· 145 Table 3-25 Comparisons of Energy Input and Output ··· 146 Table 3-26 Comparisons of EE Per ha and ton ··· 148 Table 3-27 EE within Groups by Socioeconomic
Characteristics of Farmers ··· 149 Table 3-28 Socioeconomic Characteristics of Farmers and EE ··· 150 Table 3-29 Comparisons of Various Indicators of Energy Use
··· 151 Table 3-30 Regression Analysis of Energy Inputs and Yields ··· 155 Table 3-31 Regression Analysis of Yields and EE ··· 155 Table 3-32 Regression Analysis of Energy Inputs and EE · 156 Table 3-33 Relations of Inputs Categories and EE ··· 157 Table 3-34 Relations of Inputs Categories and EE in CFS 158 Table 3-35 Relations of Inputs Categories and EE in OFS 159 Table 3-36 Relations of Farming Practices and EE ··· 160 Table 3-37 Relations of Farming Practices and EE in CFS 161
Table 3-38 Relations of Farming Practices and EE in OFS 162 Table 3-39 GHG Conversion Factors of Machinery used in
Soybean Production ··· 166 Table 3-40 GHG Conversion Factors of Fertilizers and Manure
Used in Soybean Production ··· 170 Table 3-41 GHG Conversion Factors applied in Previous
Literature ··· 171 Table 3-42 GHG Conversion Factors Applied in This Study
··· 179 Table 3-43 GHGE within Groups by the Socioeconomic
Characteristics (ha) ··· 181 Table 3-44 Relations with Socioeconomic Characteristics and
GHGE (ha) ··· 182 Table 3-45 GHGE within Groups by Socioeconomic
Characteristics (ton) ··· 182 Table 3-46 Relations with Socioeconomic Characteristics and
GHGE (ton) ··· 183 Table 3-47 Comparisons of GHGE Per ha and ton Between
CFS and OFS ··· 184 Table 3-48 Comparisons of GHGE by Input Categories ··· 186 Table 3-49 Total Average of GHGE by Input Categories in
Both Systems ··· 188 Table 3-50 Comparisons of GHGE by Farming Practices 190 Table 3-51 Total Average of GHGE by Farming Practices in
Both Systems ··· 192 Table 3-52 Energy Input Categories to Determine the GHGE ··· 194 Table 3-53 Energy Input Categories to Determine the GHGE in
CFS ··· 195 Table 3-54 Energy Input Categories to Determine the GHGE in
OFS ··· 196 Table 3-55 Farming Practices to Determine the GHGE ··· 197 Table 3-56 Farming Practices to Determine the GHGE in CFS
··· 198
Table 3-57 Farming Practices to Determine the GHGE in OFS ··· 199
Table 3-58 Relations of Energy Inputs and GHGE Per ha 200
Table 3-59 Relations of Energy Inputs and GHGE Per ton ··· 201
Table 3-60 Relations of Yields and GHGE ··· 201
Table 3-61 Relations of Renewable Energy (%) and GHGE 202
Table 3-62 Relations of Direct Energy (%) and GHGE ··· 203
Table 3-63 Comparisons of EE and GHGE between Farm Systems ··· 204
Table 3-64 Significant Results in Comparisons of EE and GHGE ··· 205
Table 3-65 LCIA by Categories in CFS and OFS ··· 209
Table 3-66 Comparisons of GWP by Input Categories ··· 210
Table 3-67 Comparisons of GWP by Kinds of GHG ··· 211
Table 4-1 Comparisons of Energy Input Required for Unit ton by Farm Product Types ··· 221
List of Figures
Figure 2-1 Framework of Energy Flows and GHGE in Farm Production System ··· 39 Figure 2-2 Research Framework of Meta-analysis ··· 40 Figure 2-3 Published Studies by Year ··· 54 Figure 2-4 Frequency Distributions EE and GHGE Researches
by Countries ··· 55 Figure 2-5 Organic EE Superiority and EE Ratio by Unit Class
··· 73 Figure 2-6 Organic GHGE Superiority and GHGE Ratio by Unit
Class ··· 79 Figure 2-7 Development of Research Model for EE and GHGE
Studies in Agriculture ··· 91 Figure 3-1 Energy Flows and GHGE in Soybean Production
Systems ··· 102 Figure 3-2 Locations of the Selected Sample Farms ··· 109 Figure 3-3 Comparison of Inputs by Categories Per ha ··· 135 Figure 3-4 Inputs Required for 1 ton Soybean Production 137 Figure 3-5 Comparison of Energy Inputs by Categories
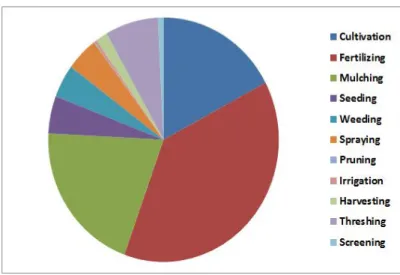
between CFS and OFS ··· 140 Figure 3-6 Proportion of Energy Inputs by Categories ··· 142 Figure 3-7 Comparison of Energy Inputs by Farming
Practices between CFS and OFS ··· 143 Figure 3-8 Proportion of Energy Inputs by Farming Practices
··· 146 Figure 3-9 Comparisons of Energy Input and Energy Output
··· 147 Figure 3-10 Comparisons of EE Per ha and ton in Both
Systems ··· 148 Figure 3-11 Comparisons of Net Energy ··· 152 Figure 3-12 Comparisons of Energy Productivity ··· 153
Figure 3-13 Comparisons of SE, RE Ratio and DE Ratio ··· 154 Figure 3-14 Comparisons of GHGE Per ha and ton in Both
Systems ··· 185 Figure 3-15 Comparisons of GHGE by Inputs Categories in
Both Systems ··· 187 Figure 3-16 Proportions of GHGE by Inputs Categories ··· 189 Figure 3-17 Comparisons of GHGE by Farming Practices in
Both Systems ··· 191 Figure 3-18 Proportions of GHGE by Farming Practices ··· 193 Figure 3-19 Comparisons of LCIA in Conventional and
Organic Soybean Production ··· 209 Figure 3-20 Comparisons of GWP between CFS and OFS ··· 210 Figure 3-21 Proportions of GWP by Input Categories in Both
Systems ··· 211 Figure 3-22 Comparisons of GWP by Kinds of GHG ··· 212 Figure 3-23 Comparisons of GWP by Phases of Life Cycle 213 Figure 4-1 Comparisons of GHGE by Farm Product Types 219 Figure 4-2 Integrative Strategy for Mitigation of Climate
List of Acronyms
EE : Energy Efficiency GHG : Greenhouse Gas
GHGE : Greenhouse Gas Emissions CFS : Conventional Farming Systems OFS : Organic Farming Systems GWP : Global Warming Potential CO2eq : CO2 equivalent
LCA : Life Cycle Assesment SOC : Soil Organic Carbon
I. Introduction
1.1 Problem Statement
Climate change has become one of the most complicated issues the world has faced in the 21st century. This is a critical issue that may have the heaviest impact on the agricultural sector than any other sector. Agriculture is affected by climate change but at the same time also contributes to it. Agriculture must, therefore, both adapt to climate changes and offer options for mitigation of them (Niggli et al., 2008). Agriculture accounts for about 13 to 33% of the global GHG emissions. As the share of agriculture in global GDP is just about 4%, this suggests that agriculture is very GHG emission-intensive.
Climate change mitigation is urgent, and adaptation to climate change is crucial, particularly in agriculture, where food security is at stake. It is evident that new national and global socioeconomic policies need to be worked out to meet this huge challenge. Among these challenges there is surely an urge to develop more ecological agriculture practices (Pimentel et al., 2005).
In general, it is recognized that organic agriculture, along with other low input agricultural practices, results in less energy demand compared to intensive agriculture and this will be able to represent a means to improve energy savings and GHGE abatement if adopted on a large scale. On the other hand, there have been recent controversial debates on whether organic farming is really the most effective
alternative to save fossil energy and to mitigate the GHGE in the agricultural sector or not. Since agriculture is affected by various kinds of geographical, meteorological, and natural conditions, it can be asserted that the results of studies on energy use and GHGE in agriculture may be diverse according to the methodology of the research, the ways of measurement and statistical analysis. Given the growing importance of organic production in view of food security and an alternative for reducing the GHGE in the agricultural sector, there is a pressing need to understand the relative environmental impacts of organic and conventional farming methods (Venkat, 2011).
Faced with the situation of globally required energy savings and GHG mitigations, the Korean government announced in 2011 that they will reduce 35% of the current levels of GHGE from BAU in the agricultural sector by 2020. However in Korea, there has not been much academic research which can provide reliable data needed to develop the pertinent policies in agriculture.
Therefore, through the systematic analysis of previous studies on the use of energy and GHGE of conventional and organic farming systems, to identify structural variables which determine the results of energy use and GHGE of researches are urgently needed. Furthermore, in the context of intensive and small holder farming systems such can be seen in Korean agriculture, empirical comparative study on the energy use and GHGE of conventional and organic farming systems are also required.
2.2 Study Objectives
This study intends to explore the driving factors which cause differences in energy use and GHGE between CFS and OFS, and to search for ways in which can improve the efficiency of energy use and mitigate GHGE in the agricultural sector.
The specific objectives of this studies are as the follows: 1. To explore the influential structural variables which affect
the differences of EE and GHGE between conventional and organic farming systems through meta-analysis of previous studies.
2. To search for the essential input variables which determine the EE and GHGE between conventional and organic farms by empirical field studies.
3. To suggest reasonable alternatives which can mitigate energy use and GHGE in the agricultural sector.
For these objectives, chapter 2 shows the meta-analysis of previous studies on the comparisons of EE and GHGE between conventional and organic farming systems. Chapter 3 describes the empirical field study carried out on the comparisons of EE and GHGE between conventional and organic soybean productions in Korea and Chapter 4 concretely represents the alternative solutions to mitigate environmental impacts in agriculture based on research findings of chapter 2 and 3.
II. A Meta-Analysis of Structural Variables
in Environmental Performances
:
Comparisons of Energy Use and Greenhouse Gas
Emissions in Conventional and Organic Farming
Systems
2.1 Introduction
Improvements in measurable environmental performance resulting from the conversion to organic farming systems will be able to encourage transforming from conventional to organic farming systems as an alternative to mitigate climate change. However, with the review of extant studies, the results are likely to come under scrutiny. Not all studies have demonstrated definite superiority of organic farming systems.
Comparing organic and conventional farming systems is not an easy task as different approaches to farming are used. Where organic farming aims towards as much as possible at self-sustainability, conventional farming relies much more on external inputs (Gomier et al., 2008). Results from energy assessments are often difficult to compare because of the variety of methodologies and accounting procedures employed (e.g., Stolze et al., 2000; Hansen et al., 2001; Hass et al., 2001).
Disputes on the appropriateness of research methodology applied to the studies on the comparison of energy use and GHGE has continued to generate interest in the environmental assessment of agriculture. It sometimes has
been asserted that the extant literature has employed inadequate sample size, improper collection of data, inadequate measurement, irrational use of unit class, different types of culture, inappropriate selection of energy coefficients and analysis methods, in establishing a relationship between farming inputs and the environmental performance of farms. A trial study to examine validations of the above-mentioned assertions in the execution of energy use and GHGE studies and to improve reliability of results should be conducted by the comprehensive analysis of previous studies. There is a need for a systematic analysis to understand the structural characteristics of precedent EU and GHGE studies and how they affect their outcomes. Such findings will not only help as critical analysis of the results of previous studies, but also as a guide for future research.
Therefore, the objectives of this meta-analysis are to identify the influential structural variables which determine the differences of environmental impacts between conventional and organic farming systems by the analysis of previous literature, and thereby to suggest research model of EU and GHGE studies of CFS and OFS for future. Reliable data obtained from well-organized studies can assist policy-makers in developing effective strategies to mitigate climate impacts in agriculture.
For these objectives, the structural factors along which environmental performances differ are examined, and attempts to identify a pattern which discriminates between studies that result in positive environmental performances and those that do not are carried out in this meta-analysis.
2.2 Review of Literature
For the last decades, comparative studies on environmental performances of CFS and OFS have been performed vigorously in Europe and North America. With the accumulation of these researches, review studies on previous literature were carried out to understand the comprehensive and categorical insights on the characteristics of energy use and GHGE between conventional and organic farming systems. However, most cases of review studies were conducted only by calculating and summarizing the comparison of mean value and percentage of energy use and GHGE (Lynch et al., 2011; Gomier et al., 2008; Lynch et al., 2012; Hill, 2009; Niggli et al., 2009; Ziesemer(FAO), 2007; Azeez et al., 2008). They had derived holistic trends of conventional and organic energy use and GHGE based on farm types or environmental indicators.
In addition, to predict the results of conversion from CFS to OFS or to explore the mitigation strategies of environmental impacts by transforming into organic farming, recently, simulation studies on the comparison of energy use or GHGE have occasionally been conducted on the level of farms or nations. Simulation studies on the farm level were conducted experimentally in experimental farms (Cooper et al., 2011). Simulation studies on the national level were carried out using national data base or previous literature on the study of energy use and GHGE. These national levels of simulation studies were performed in the United Kingdom
(Tzilivakis et al., 2004), Denmark (Hansen et al., 2001), Germany (Halberg et al., 2008), France (Acosta-Alba et al., 2012) and Canada (Pelletier et al., 2008; Point et al., 2012).
However, these simulation studies can show considerably different results according to the methodological approaches used such as data source, sample size, statistical analysis and selection of data in the previous studies. These reasons require to identify the structural factors which determine the differences of EE and GHG between CFS and OFS by a systematic analysis of previous studies. This is because findings from a systematic analysis of previous studies can provide reliable information to establish research model for simulation studies in the future.
In the sphere of methodological approach of studies on environmental assessment between CFS and OFS, there are various kinds of potential structural factors which may be likely to affect the differences of study results. I have reviewed the extant literature on the comparisons of EE and GHGE studies according to the categories of potential structural factors.
2.2.1 Indicators for Environmental Performances 2.2.1.1 Selection of Environmental Indicators
A number of indicators are employed in the assessment of environmental performance in agriculture. OECD provides three categories of environmental indicators for agriculture. First, the core indicators include land use, soil quality, water use, biodiversity, nutrient use, pesticide use and risks, greenhouse gas, energy balance, efficiency of resource use
and farm management. Second, the regional indicators include land conservation and agricultural landscape. Third, the context indicators include agricultural production, farm land cover etc (OECD, 2001; Kim and Kim, 2004). IRENA (Indicator Reporting on the Integration of Environmental Concerns into Agriculture Policy) by EU evaluated the usefulness of 35 environmental indicators for agriculture (CEC, 2006).
In spite of many environmental indicators available, only a few indicators have been used so far to compare environmental performances of the conventional and organic farming systems. Energy use and GHGE are the most frequently used indicators and are also employed in this study to compare with previous researches.
To avoid, or better to reduce, bias and/or flaws in the analysis, there has been assertions that sound comparisons should embrace a more complex approach where environmental, social and economic criteria are considered at the same time and at different scales (Wolf and Allen, 1995; Gomiero et al., 1997; Dalgaard et al., 2003; Laborte et al., 2007). In reality, Golam and Gopal (2004) have conducted a comparative study on the sustainability of ecological and conventional farming based on 12 environmental, social and economic indicators in Bangladesh.
The following several environmental indicators are mainly used for comparative studies on conventional and organic farming.
Through the review of previous empirical studies on energy consumptions of conventional and organic farming systems, Gomier et al. identified that in most cases, there were lower energy consumption for organic farming for both unit of land (GJ/ha), from 10% up to 70%, and per yield (GJ/t), from 15% to 45%. The main reasons for higher efficiency in the case of organic farming were: (1) lack of input of synthetic N-fertilizers and other mineral fertilizers, (2) lower use of highly energy-consumptive foodstuffs (concentrates), and (3) the ban on synthetic pesticides and herbicides (Gomier et al., 2008).
Through the review of about 130 studies to compare farm-level energy use and global warming potential of organic and conventional production sectors, Lynch et al. concluded that the evidence strongly favors organic farming with respect to the whole-farm energy use and EE both on a per hectare and per farm product basis, with the possible exception of poultry and fruit sectors (Lynch et al., 2011).
B. GHGE
Greenhouse gas emission is evaluated as a highly critical indicator due to its direct impact on global warming and climate change, because of the role played by CO2 and other
GHGs (in particular CH4 and N2O), as emissions from
agriculture, it is important to analyze whether organic agriculture offers possibilities to reduce GHG emissions (Gomier et al., 2008). On accounting only on the CO2
emission, this can be considered as small in proportion. However, on summing up CH4 and N2O emissions as CO2
equivalents, even though the amounts of the CH4 and N2O
emissions are comparably low, due to the high Global Warming Potential (GWP) of these trace gases, their climate relevance are much higher. This is because in agriculture, not only energy use is directly put into the process of production but also changes in soil ecology releases carbon into the atmosphere.
A report by ITC and FiBL (ITC-FIBL, 2007), summing up a number of farm level studies from Northern Europe, reported a reduction of GWP per kg of products ranging from 6% to 30% depending on the products used for organic farming, with peaks reaching 41%. Only in 4 out of 16 studies did GWP increase, ranging from 2 to 53% (Stolze et al., 2000).
C. Soil Carbon Sequestration - SOC (Soil Organic Carbon) The distinctive discrepancy among environmental indicators of conventional and organic farming systems appears in soil carbon sequestration. Relative global warming potential of organic agriculture compared to conventional agriculture with and without consideration of CO2 sequestration is
considerably variable (Küstermann et al., 2007). It is also noted that the main mitigation potential lies in the capacity of agricultural soils to sequester CO2 through the process of
building up organic matter (Muller et al., 2012).
Many authors have proposed organic management systems as a means of promoting SOC gains. The consensus of the data suggests organic systems at least do not deplete SOC when compared with conventional production. Mondelaers et al. (2009) concluded that organic farms have ‘on average’ a
higher SOC content. Smith et al. (2008) and Gomiero et al. (2008) proposed the adoption of organic farming as one of a suite of practices to improve soil conservation and SOC sequestration. The important role of properly managed agriculture as an accumulator of carbon has been addressed by many authors (e.g., Janzen, 2004; Pretty et al., 2002; Holland, 2004). This carbon can be stored in the soil by increasing carbon sinks in the soil’s organic matter and above-ground biomass.
Several researchers have also suggested through the comparative studies on carbon sequestration done by conventional and organic farming systems that organic farming has considerable potential to reduce the GHGE (Haas and Kepke, 1994; Küstermann et al., 2008; Leifeld et al., 2009; Mader et al., 2002; Fliessbach, et al., 2007; Teasdale et al., 2007; Hepperly et al., 2006; Pimentel et al., 2005; Berner et al., 2008; Ruhling et al., 2005). All the results obtained from the experimental farms for around 10 to 20 years of trials show that soil carbon gain in organic farm soil increased to 40-1200%, while its loss in conventional farm soil appeared to be 80-120% for the same period.
When losses and gains of soil carbon stocks (mineralization or sequestration) are considered in the calculations, the global warming potential is considerably reduced for organic agriculture as shown in recent studies - Scheyern experimental farm (decrease of 80%), Bavarian survey of 18 commercial farms (26% (Küstermann et al., 2007)), and Station experiments in Michigan (64% (Robertson et al., 2000)).
D. Biodiversity
Many authors reported the positive role of organic agriculture for preserving biodiversity both in soils and landscapes. The diversity of landscapes, farming activities, fields, and agro-biodiversity are greatly enhanced in organic agriculture (Niggli, et al., 2008), organic agriculture systems built on a foundation of conserving and improving diversity by using diverse crops, rotations and mixed farm strategies.
Several major reviews have focused on the question whether there is a difference in biodiversity contribution between organic and conventional farming. In the review of the Soil Association (2000), the authors concluded a higher abundance of wild and rare plants, more arthropods, harmless butterflies and spiders, and more birds up and around the field. With respect to species richness’s, they found more wild and rare plant species and more spider species ( in Mondelaers et al., 2009). Another review on this topic is from Hole et al. (2005). They screened 76 studies and reported a clear positive effect of the organic management practices on biodiversity. They found 66 cases where organic agriculture had a positive effect, against 8 with a negative and 25 with a mixed or had no effect.
A meta-analysis of 63 paired studies on the biodiversity of conventional and organic farming systems is conducted by Bengtsson et al. (2005). Their main conclusions are generally a positive effect of organic farming on species richness, with an average of 30% more species compared to conventional fields, and a positive effect averaging 50% higher abundance within species. They clearly warn of the significant
heterogeneity between studies, for example 16% of the studies indicating a negative effect of organic farming on species richness. Belfrage et al. (2006) also found higher numbers of both bird diversity and bird abundance on organic farms than on conventional farms. They, however, remarked that the largest difference in bird abundance and diversity was found when comparing small and large farms, with high values correlated to small farms.
Many factors are involved in characterizing the pattern of biodiversity in a specific agricultural area. Therefore, long-term, system-level studies of the biodiversity response to organic/conventional farming are needed to assess the relation between management practices and biodiversity (Hole et al., 2005).
E. Organic Matters
Desirable organic agriculture has been demonstrated to be effective in preserving soil organic matter and preventing soil erosion. Increasing soil organic matter greatly improves soil quality which plays a key role in guaranteeing sustainable crop production and food security (Reganold et al., 1995).
A number of studies on the organic matters of conventional and organic farming systems have been done. The results of meta-analysis performed by Mondelaers et al. show that the organic matter content on organically managed fields on average exceeds the conventional value with 5.4 percent points, but no significant difference in organic matter contents between organic and conventional parcels has appeared (Mondelaers et al., 2009).
Besides the surveyed indicators above, eutrophication and acidification have often been used as environmental indicators in the comparison of environmental assessment between conventional and organic farms. In most cases of previous studies, eutrophication and acidification are clearly more favorable to organic farms than conventional farms (Haas et al., 2001; Hokazono et al., 2009). In the study of Haas et al. the results showed that eutrophication and acidification in organic fields are much lower than that in conventional fields by 25% of intensive conventional fields and 45% of extensive conventional fields. However, there are some conflicting results. Hokazono et al. found out in another research that both of eutrophication and acidification are higher in organic farms than in conventional farms (Hokazono et al., 2012).
In comparisons of environmental performances between CFS and OFS, the selection of indicators for environmental assesment can influence the results of comparison. Those who are favorable to organic system in environmental performances assert the importance of the ignored benefits of organic farming compared to conventional farming in contrast to the environmental indicators.
2.2.1.2 Selection of Unit Class
In review of European farming systems by Stolze et al. (2000), trends toward lower CO2 emissions in organic
agriculture were shown. But they could not conclude that overall CO2 emissions are lower per unit of product in
30% higher yields in conventional intensive farming in Europe can compensate the lower CO2 emissions per unit of
products in organic agriculture (Stolze et al., 2000). There has been considerable debates in the literature about the most appropriate measure, whether on per land unit basis or on product basis. In the comparative results, this is still a significant issue that has yet to be resolved.
Due to yield differences in intensive conventional production zones (i.e., Europe), per product comparison does not commonly favor organic, especially when examining GHG emissions (Lynch et al., 2011). Brentrup (2003) suggests using a product-related functional unit (i.e. based on mass) rather than an area-related functional unit in assessing differences in land use efficiency. The choice of the functional unit is highly dependent on the aim of the study.
On the other hand, in countries where production exceeds domestic consumption, it may be that efficiency assessed on per unit land area is closer to the model of food production and consumption which will remain within the carrying capacity of the planet. Macrae et al. (2010) also asserted that organic farming systems demonstrate greater EE and reduced GHGE compared with conventional operations, usually attributable to the absence of synthetic fertilizers, particularly nitrogen, and synthetic pesticides. However, results suggest that the efficiency of organic systems can improve with research on optimizing yields/inputs, as comparisons of efficiency/output are not as robustly positive as those of efficiency/area (Macrae et al., 2010).
unit class in environmental assessment of conventional and organic farming influences the results. When energy use and GHGE are compared, they are needed to be commonly compared on the basis of two kinds of units- the area basis(ha) and product basis (ton, kg or liter).
A. The Unit Class in EE
Most of the studies strongly favor organic farming with respect to whole-farm energy use and EE on a per hectare basis. However, on a per farm product basis, organic farming is lightly favorable than conventional farming with the possible exception of poultry and fruit sectors. In most cases, poultry and fruits are favorable in conventional farming on a per product basis (Lynch et al., 2011).
B. The Unit Class in GHGE.
For GHGE, results per ha favor more consistently in organic farming rather than GHGE per unit product (Lynch et al., 2011). The global warming potential of organic farming systems is considerably smaller than that of conventional or integrated systems when calculation is done based on per land area. This difference declines, however, when calculated based on per product unit, as conventional yields are higher than organic yields in temperate climates (Badgley et al., 2007).
In general, the emissions of product per ton basis is considered a more relevant indicator to assess the environmental impacts of the farming system. The production of organic farming is associated with lower CO2 emissions per
ha but tends toward higher CO2 emissions per ton due to
lower productivity. Estimates of the CO2 emissions per ton of
crop give different results depending on the assumption of yield levels (Gomier et al., 2008). However, under dry conditions or water constraints, organic agriculture may outperform conventional agriculture, both per crop area and per harvested crop (Stolze et al., 2000).
2.2.2 Study Characteristics
2.2.2.1 Published Year of Studies
A. History of the Comparative Study on Energy Use.
A comparative study trial of energy use in organic and conventional farms was published for the first time by Klepper et al. (1977). Then more detailed and systematic comparisons of energy performance of organic and conventional farming systems were initiated by Pimentel and colleagues in the early 1980s (Pimentel et al., 1983).
Since then, these studies have been conducted occasionally in the 1990s (Berardi, 1978; Nguyen and Haynes, 1994; Refsgaard et al., 1997). From early 2000s on, a number of studies that compare the EE of organic and conventional farming systems have been conducted.
B. History of the Comparative Studies on GHGE
Studies on GHGE in agriculture has begun from early 1990's mostly in the field of animal husbandry (Howden et al.. 1994; Jarvis et al,, 1994; Marland et al., 1995).
The first study on the comparison of GHGE on a pair of conventional and organic dairy farms was surveyed in 1996
and published in 2000 by Cederberg et al. (Cerderberg et al., 2000). From the last decade on, these GHGE studies have been actively accumulated. GHGE assessment from organic and conventional agriculture has been carried out in different countries with a variety of crops and livestock.
2.2.2.2 Data Sources A. Field Survey
When establishing the comparative researches on energy use and GHGE, field surveys were mainly conducted. Data from field surveys of farms can provide greater access, empirical and additional detail, and supplementary variables for triangulation of results. However, data from field surveys can prove insufficient due to the lack of objectiveness in data or information and great variations according to the geographical & biophysical conditions between comparing both systems. It can also be difficult to conduct a consistent analysis across farms without uniform data definitions (Kohli et al., 2003).
Around half of the extant of EE and GHGE studies belong to these field surveys.
B. Experimental Trials
On account of the limitations of field surveys, from the early stages of energy use and GHGE studies, experimental research trials on the comparison of energy use and GHGE started in advanced countries. Data from experimental farms can overcome several of the above imitations by providing greater accurate data with minimized bias as all other factors
can be controlled except for farm management systems. Thereby, much more reliable and objective data can be obtained from the replicated experiments and long-term period trials. When data is accurate, they exhibit fewer errors in variable bias. Thus, from an estimation perspective, it is always desirable to have data that is precise as possible.
However, this method has limitations as its results may be vary considerably according to the kinds and amounts of inputs between conventional and organic plots. And sometimes, there can be a lack of applicability on account of no consideration of economical aspects on farming inputs in the experimental data source.
There are two kinds of experimental trials. One type are conducted trials in the experimental plots of research institutes or universities (Nemecek et al., 2011; Ku¨stermann et al.,2007; Cavigelli et al., 2009; Robertson, et al., 2000; Syva¨salo,et al., 2006; Gelfand et al., 2010; Pimentel et al., 2005; Reganold et al., 2001; Zentner et al., 2011; Moreno e al., 2011; Nguyen et al., 1995; Hoeppner et al., 2005; Deike et al., 2008; Stalenga et al., 2008; Chirindaa et al., 2010).
Another type are experimental trials which are conducted experimentally by the use of intentional inputs and farming practices not of farmers, but of researchers at farm field (Flessa et al., 2002; Martin et al., 2012; Hokazono et al., 2012; Ramos et al,, 2004; Klimeková et al., 2007; Sartori et al., 2005; Iepema et al., 2001).
C. Secondary Database
by secondary statistical data. As a result, its validation depends on the choice of data base. For instance, the results rely on the selection of period for the average product yields or kinds of inputs put into the farms.
Data gathered from secondary sources is easier to obtain and is generally objective. Secondary sources can provide access to a greater number of farms’ data and thus, improve the generalization of results. On the other hand, secondary or public data sources may be limited in detail, and may not match the exact needs of the researcher.
Among the studies of secondary data source, there are studies conducted by research centers or institute based data (De Backer et al., 2009), company based data (Heller et al., 2011), regional based data (De Backer et al., 2009) and national based data (Veysset et al., 2011; Basset-Mens et al., 2007; Williams et al.., 2006; Hirschfeld et al.., 2008; Fritsche & Eberle, 2007; Tayler, 2000; Meisterling et al.., 2009; Coppola et al.., 2008; Dalgarrd et al.., 1996). Finally, there are studies that compared the differences of national conventional average data and data from organic field surveys (Wood et al., 2011; Pimentel, 2006; Ortega et al., 2005; Petersen et al., 2006).
2.2.2.3 Duration of Data Collections
Organic systems often have lower nutrient inputs and rely on nutrients previously added to soils before conversion to organic agriculture. It may take decades until yields decline to levels reflecting true organic practices. Thus, there is a risk of energy outputs from organic systems being
overestimated (Bertilson et al., 2008). According to them, the short term duration of surveyed data can cause more favorable results than as they actually are.
A. Single Year Survey
In general, data from field surveys and secondary data collections are undertaken cross-sectionally for one year or one crop season.
B. Multi-year Survey
On contrary, rarely farms with crop rotation or most of experimental farms are surveyed longitudinally for the period of over two years. Most experimental farms of research centers have been surveyed for longer term periods which are around 10 to 30 years (Nemecek et al., 2011; Ku¨stermann et al,, 2007; Cavigelli et al., 2009; Robertson, et al., 2000; Gelfand et al., 2011; Pimentel et al., 2005; Reganold et al., 2001; Zentner et al., 2011; Moreno e al., 2011; Nguyen et al., 1994; Hoeppner et al., 2005; Stalenga et al., 2008).
Furthermore, there was little secondary data collections obtained from the database of longer research period (Meisterling et al., 2009).
2.2.2.4 Measurement Tools for the Evaluation of Environmental Indicators
As the study for the assessment of environmental indicators in agriculture developed, various methods for measurement have been proposed and used to address the
question of the environmental impacts of agriculture.
Recently, Van der Werf et al. compared and analyzed 12 indicator-based approaches to assess environmental impacts at farm level and to propose a set of guidelines for the evaluation of such methods. They wanted to find the most optimal method among the 12 tools for the evaluation of environmental impacts at farm level that can be used for better evaluation and to estimate more definitely which indicators among 26 environmental indicators that were selected showed better performance (Van der Werf, et al., 2012). Halberg et al. (2005) conducted a comparative study on the efficacy of six kinds of measurement tools to assess the environmental impacts on livestock production. The results indicate that LCA method explains the environmental impacts in agricultural production, the most effectively and comprehensively.
Although various measurement tools for the assessment of environmental impacts in agriculture have been developed, only several measuring methods have been applied to estimate the environmental impacts in the comparisons of conventional and organic agriculture. All of the representative methods use a set of indicators including energy use and/or GHGE to evaluate the environmental impact of agriculture at farm level.
A. EAM (Energy Analysis Method)
Previously, this method has been used most widely and generally when the LCA method was applied in agriculture. It has been easily available as a method to be employed for the
assessment of energy use from the beginning. Even though the formal name for this method was not given until now, the author named this general method as ‘Energy Analysis Method (EAM)’ in this study. The EAM also accounts for indirect (embodied) energy which was used in manufacturing input materials before the farm production stage and direct energy used during agricultural production. However, since this method is not standardized internationally, the results may show considerable variations according to the conditions and limitations of studies.
Many studies on agriculture have aimed at incorporating a limited range of indirect effects, particularly in terms of energy. Typically, only obvious inputs such as fertilizers, pesticides, irrigation and machinery are included in such studies. However, it has been demonstrated in a number of comparative studies that the omission of higher production stages in process analyses, causes a systematic error that is due to the truncation of the production system by a finite boundary (Wood et al., 2006).
B. LCA (Life Cycle Assessment)
Life Cycle Assessment (LCA) is an internationally standardized tool. Among environmental assessment approaches, LCA is a method to assess impacts associated with a product by quantifying and evaluating the resources consumed and emissions to the environment at all stages of its life cycle, from the extraction of resources, through the production of materials, product parts and the product itself, and the use of the product to its reuse, recycling or final
disposal (Guinee, et al., 2000). It is a valuable tool for environmental evaluation of farming systems (Van den Worf, et al., 2002). However, since LCA was initially developed for industrial products, it is pointed out that it does present some difficulties when applied in agriculture.
For the first time, Audsley et al. (1997) tried to carry out the application of LCA to agricultural production. Comparative studies on energy use and GHGE by LCA have been started by Cederberg et al. (2000), Haas et al. (2001). Since then, LCA studies have been applied very vigorously especially in comparative studies of GHGE. Until now, several dozens of LCA studies have been performed in the comparative studies on energy use and GHGE.
C. Emergy
The emergy methodology has been described fully by Odum (1988). Emergy methodology converts all forms of energy, materials, and human services into equivalents of one form of energy (solar energy). The units of solar energy are solar emjoules (sej) (Ortega et al., 2005).
Traditional energy analysis provides the short-term feasibility of a process but all forms of energy do not have the same ‘‘quality’’. To measure such differences, a method based on solar emergy, defined as the solar (equivalent) energy is required to generate the flow or storage, which has been proposed (Odum, 1988).
Emergy evaluation deals at best with systems at the interface between the ‘‘natural’’ and the ‘‘human’’ spheres (Bastianoni and Marchettini, 1996) and it is able to account
for all the inputs on a common basis, avoiding difficulties and subjectivity that could take place with other methods (Bakshi, 2002). This tool was applied in the comparison of conventional and organic farming in Italy (Castellini et al,, 2006), Denmark (Coppola, F. et al., 2008) and Brazil (Ortega et al., 2005).
D. LCCI (Life Cycle Climate Impact)
This method had been generally employed in estimating the amount of GHGE in agricultural production before LCA method was adopted to agriculture. Even though a general formal name has not yet been given for this method, the author named it the ‘Life Cycle Climate Impact’ (LCCI).
It is generally understood that the LCCI method was most probably derived from the global warming potential (GWP). The LCCI usually stands for the amount of CO2 and other
greenhouse gases, emitted over the life cycle of manufacturing materials and crops production. This method is quantified using such indicators as the GWP, which represents the quantities of GHG that contribute to global warming and climate change. A specific time horizon is considered, usually 100 years (IPCC, 2009). In LCCI, the amount of GHGE is calculated by multiplying the input materials with their GHG conversion factors and by adding the direct emissions generated during the production process in the field. This LCCI method can also be referred as a kind of LCA, even though it is not analyzed by LCA software programs. Different from LCA method, LCCI includes the amount of GHGE generated in the process of manufacturing
and maintaining the machinery used in farming systems, besides all the GHG emitted through the whole life cycle of farming systems as well as LCA.
Most of carbon calculation programs at the farm level have been developed and operated upon the basis of this method1).
2.2.2.5 Sample Size
The results of studies may vary according to the number of sample farms that are included in the analysis. A small sample size increases standard errors and thus makes it more difficult to isolate the effects of organic farming system from random noise. Furthermore, a small number of data may not be sufficient for establishing a trend for EE and GHGE, especially, when there are lag effects generated by conversion from CFS to OFS. The sample size is a function of both the number of sample farms examined and the number of replications in farming trials.
Most field surveys do not have many sample sizes due to the limits of period and cost of research. Some studies gathered data from only one pair of conventional and organic counterpart farms on EE studies (Ramos et al., 2004; Sarcinelli et al., 2004; Castellini et al., 2006; Loake, 2001; Cederberg et al., 2000; Gro¨nroos et al., 2006; Sartori et al., 2005; Risoud, 1999; Van der Sorf, et al., 2007), and on GHGE studies (Flessa et al., 2001; Cederberg et al., 2000; Hokazono et al., 2009; Basset-Mens et al., 2006; Christel Cederberg et
1) Representative carbon calculator program is presented by Climate Friendly Food - available from :
al., 2000; Ku¨stermann et al., 2007; Van der Werf et al., 2007). The sample size of a few studies reached 100 to 500 farms at maximum.
National or big research projects were sometimes performed with large sample size- 511 sample farms (Williams et al., 2010), 241 sample farms (Guzmán et al., 2008), 149 sample farms (Turhan et al., 2008), 180 sample farms (Moreno et al., 2011), 312 sample farms (Alonso et al., 2010). Sample sizes of experimental farms depend on the numbers of experimental plots, replications and duration. National data is usually based on very large sized samples. And in most cases, the pairs of conventional and organic farms are constant in number in small sample-sized field surveys, but generally unbalanced in large-sized studies.
2.2.3 Farm Characteristics 2.2.3.1 Country under Study A. On the national level
Studies on the comparison of energy use began in the US, and then were performed most vigorously in Europe before spreading to other continents except Africa. There is no research on this theme in Africa. In Asia, these studies were conducted scarcely in several countries including Turkey, Japan, China and Korea. In Korea, only one comparative study on energy use of rice was performed (Gil et al., 2008) and there has been no empirical study on GHGE in comparison of conventional and organic farming systems until the present.