Impact of the Gain-saturation Characteristic of
Erbium-doped Fiber Amplifiers on Suppression of
Atmospheric-turbulence-induced Optical Scintillation in a
Terrestrial Free-space Optical Communication System
Yoo Seok Jeong and Chul Han Kim**School of Electrical and Computer Engineering, University of Seoul, Seoul 02504, Korea (Received February 1, 2021 : revised February 19, 2021 : accepted February 24, 2021)
We have evaluated the suppression effect of atmospheric-turbulence-induced optical scintillation in terrestrial free-space optical (FSO) communication systems using a gain-saturated erbium-doped fiber amplifier (EDFA). The variation of EDFA output signal power has been measured with differ-ent amounts of gain saturation and modulation indices of the optical input signal. From the measured results, we have found that the peak-to-peak power variation was decreased drastically below 2 kHz of modulation frequency, in both 3-dB and 6-dB gain compression cases. Then, the power spectral density (PSD) of optical scintillation has been calculated with Butterworth-type transfer function. In the cal-culation, different levels of atmospheric-turbulence-induced optical scintillation have been taken into account with different values of the Butterworth cut-off frequency. Finally, the suppression effect of optical scintillation has been estimated with the measured frequency response of the EDFA and the cal-culated PSD of the optical scintillation. From our estimated results, the atmospheric-turbulence-induced optical scintillation could be suppressed efficiently, as long as the EDFA were operated in a deeply gain-saturated region.
Keywords : Erbium-doped fiber amplifier, Free-space optical communication, Optical scintillation OCIS codes : (060.2320) Fiber optics amplifiers and oscillators; (060.2605) Free-space optical
communication
*Corresponding author: [email protected], ORCID 0000-0001-5356-5011 Color versions of one or more of the figures in this paper are available online.
This is an Open Access article distributed under the terms of the Creative Commons Attribution Non-Commercial License (http://creativecommons. org/licenses/by-nc/4.0/) which permits unrestricted non-commercial use, distribution, and reproduction in any medium, provided the original work is properly cited.
Copyright © 2021 Current Optics and Photonics
I. INTRODUCTION
Free-space optical (FSO) communication systems can provide license-free, cost-effective multigigabit data links without deploying fiber-optic infrastructure [1, 2]. There-fore, many research groups have investigated and demon-strated FSO systems for the efficient implementation of high-capacity communication links [3–6]. In particular, both the Loon project of Google [5] and the Aquila project of Facebook [6] have adopted FSO communication links between balloons or unmanned aerial vehicles (UAVs) for the cost-effective implementation of broadband wireless internet services. However, in a terrestrial FSO
communi-cation link, atmospheric turbulence could induce optical scintillation, which in turn could induce a received-power fluctuation on the receiver side in a communication link [7]. The optical scintillation induced by atmospheric turbulence would degrade the system’s performance; thus it should be suppressed properly, to maintain reliable FSO commu-nication links. Previously, various approaches have been proposed and implemented to mitigate the effect of optical scintillation, such as aperture averaging [8, 9], space diver-sity [10], adaptive optics [11], a gain-saturated optical am-plifier [12], etc. Among them, using a gain-saturated optical amplifier would be a simple and straightforward scheme to mitigate the optical-scintillation effect efficiently. In [12] it
-was reported that an optical receiver with a gain-saturated erbium-doped fiber amplifier (EDFA) could mitigate the ef-fect of optical-scintillation-induced received-power fluctua-tion better than one with a semiconductor optical amplifier (SOA). Thanks to its low cost and small size, the gain-satu-rated SOA might be a proper solution for commercial FSO communication systems. However, a gain-saturated EDFA could provide better performance, with a lower noise figure and slower response to signal fluctuation, compared to an SOA [12]. It has been also well known that the EDFA has a high-pass response in input-output signal transfer, since the EDFA has a long spontaneous-emission lifetime [13]. Owing to this low-frequency compression of the EDFA, a gain-saturated EDFA could efficiently mitigate the effect of atmospheric-turbulence-induced optical scintillation, which could be modeled with a Butterworth-type transfer function in terrestrial FSO systems [14]. In this paper, we have in-vestigated the impact of the EDFA’s gain saturation on the suppression of optical-scintillation effects in terrestrial FSO communication systems. The frequency response of the EDFA was measured at first, with different modulation in-dices of optical input signal, and different amounts of gain compression. Then, the power spectral density (PSD) of the optical scintillation in the terrestrial FSO link was calculat-ed with a Butterworth-type transfer function. The different levels of optical scintillation were taken into account with different values of the Butterworth cut-off frequency [14]. Finally, we estimated and compared the suppression of the effect of atmospheric-turbulence-induced optical scintilla-tion using a gain-saturated EDFA with different modulascintilla-tion indices and small-signal gain compression.
II. RESULTS AND DISCUSSION
At first, we measured the frequency response of input-output signal transfer in an EDFA with the experimental setup shown in Fig. 1. A laser diode (LD) operating at a wavelength of 1553.328 nm (@ 193 THz) was used as the optical input signal. The output of the LD was modulated with a sinusoidal signal by using an acousto-optic modula-tor (AOM). The frequency of the sinusoidal wave ranged from 1 Hz to 10 kHz in our measurements. The
peak-modulation index of the optical input signal was adjusted by changing the driving voltage (0–1 V) of the AOM with different peak-to-peak levels of sinusoidal signal. Then the sinusoidally modulated optical input signal was launched into the EDFA, after passing through a variable optical at-tenuator (VOA), which was used to adjust the power level of the optical input signal. For example, the attenuation level of the VOA was decreased to obtain −8 dBm of opti-cal input power into the EDFA, to operate the EDFA under 6-dB small-signal gain compression. After amplifying the optical input signal, the characteristics of the EDFA output signal were analyzed with an optical power meter (OPM) and an oscilloscope. For the oscilloscope measurement, a photodiode (PD) was used to convert the optical signal to an electrical signal; the PD used in our experiment had a bandwidth of 14 MHz and a rise time of 25 ns, in the wave-length range of 900–2600 nm. For all measurements, the optical input signal power into the PD was set to be −10 dBm.
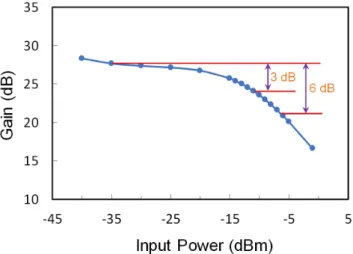
Figure 2 shows the measured optical gain of the EDFA used in our experiment. The small-signal gain was mea-sured to be 28.3 dB at an optical input power of −40 dBm. Decrease of the EDFA’s optical gain was observed by in-creasing the power level of the optical input signal, due to the gain-saturation characteristic. The 3-dB and 6-dB gain compression were obtained at optical input powers of about −14 dBm and −8 dBm respectively. By operating the EDFA at these gain-compression points, the fluctuation of the op-tical input signal could be decreased at the EDFA output. This is because the lower the optical signal input, the higher the optical gain of the EDFA, and vice versa. Thanks to this gain-saturated characteristic of the EDFA, the fluctuation of the optical input signal due to optical scintillation could be suppressed simply in FSO communication links [12].
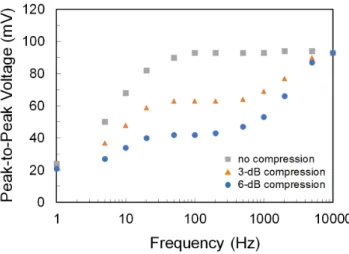
Figure 3 shows the peak-to-peak voltages of the EDFA output signal measured with the oscilloscope as a function of frequency, at three different gain compression points:
FIG. 2. Measured optical gain of the erbium-doped fiber amplifier (EDFA) as a function of the optical input signal power used in our experiment.
FIG. 1. Experimental setup for performance measurement of an erbium-doped fiber amplifier. Acronyms used are LD (laser diode), AOM (acousto-optic modulator), VOA (variable optical attenuator), EDFA (erbium-doped fiber amplifier), and OPM (optical power monitor).
0 dB (no compression), 3 dB, and 6 dB. In this measure-ment, the peak-modulation index (defined as the difference between maximum and minimum optical output power of
the AOM, normalized to the maximum) of the optical input signal was set to be 33%. As can be seen in Fig. 3, no dif-ference in peak-to-peak voltage of the output signal was observed for any of the three gain-compression conditions, when the frequency was higher than 10 kHz. By decreas-ing the frequency, the peak-to-peak voltages started to de-crease. At 100 Hz the peak-to-peak voltages were measured to be 93, 63, and 42 mV for gain compression of 0, 3, and 6 dB respectively. From the measurements, we have con-firmed that the EDFA has a high-pass frequency response in input-output sinusoidally modulated signal transfer [13]. In addition, the higher the small-signal gain compression, the smaller the variation in peak-to-peak voltage of the op-tical output signal. The voltage traces of the EDFA output signals measured with the oscilloscope are presented in Fig. 4. Figure 4(a) is the peak-to-peak voltage trace measured with no gain compression and a frequency of 10 kHz, while Figs. 4(b)–4(d) were the traces measured at 100 Hz with 0, 3, and 6 dB, respectively. From these measured traces of the optical output signal, we have confirmed that peak-to-peak voltage variation decreased when the EDFA was oper-ated in a deeply saturoper-ated region.
The amounts of suppression of peak-to-peak voltage FIG. 3. Measured peak-to-peak voltage of the erbium-doped
fiber amplifier (EDFA)’s output signal as a function of fre-quency, at three different gain-compression points: 0 dB (no compression, ■), 3 dB (▲), and 6 dB (●) of compression.
FIG. 4. Measured voltage traces of the EDFA’s output signal, measured with (a) no compression at a frequency of 10 kHz, (b) no compression at a frequency of 100 Hz, (c) 3-dB gain compression at a frequency of 100 Hz, and (d) 6-dB gain compression at a frequency of 100 Hz.
variation on a dB scale were calculated using the measured results (i.e. measured on a linear scale, as shown in Fig. 3) for different gain-compression conditions. Figure 5 shows the calculated suppression ratio as a function of frequency, with 6-dB gain compression and four different peak-modu-lation indices. The peak-to-peak voltage of the optical input signal at a frequency of 10 kHz was used as a reference val-ue for calculation of the suppression ratio on a dB scale in Fig. 5. No significant differences in suppression ratio were observed between the four different modulation indices. For the cases of peak-modulation indices of 55% and 70%, the suppression ratios of peak-to-peak voltage were almost equal in the entire frequency range of 1 Hz to 10 kHz. Only when the frequency was 1 Hz were the suppression ratios calculated to be -18 dB and -20.5 dB at indices of 55% and 70% respectively. For a peak-modulation index of 90%, the suppression ratio was slightly different from those for indi-ces of 55% and 70%, and almost the same as for an index of 33%. We believe that this is mainly because the AOM had a nonlinear output characteristic for high driving volt-age.
To investigate the suppression of atmospheric-turbu-lence-induced optical scintillation with a gain-saturated EDFA, we adopted a Butterworth-type transfer function for the approximation of the PSD of optical scintillation. The spectral model of the optical scintillation could be calcu-lated with the following Butterworth filter equation [14]:
|����|�= �
���������, (1)
where fc is the cut-off frequency and N is the order of the Butterworth filter. In [14] it was reported that the calculated PSD of optical scintillation with a first-order (N = 1) But-terworth transfer function was well matched with results es-timated from measured weather data. Under the combined
conditions of temperature θ (°C) and rainfall intensity R (mm/h), the cut-off frequency of the first-order Butterworth transfer function could be estimated from the measured weather data. Based on the results of [14], the cut-off fre-quency was varied from 14.6 Hz (for 10 ≤ θ < 20 and 6 <
R ≤ 9) to 137.6 Hz (for θ < 10 and 6 < R ≤ 9), according to
the weather conditions. Thus we calculated two different PSDs of optical scintillation with Eq. (1) and two Butter-worth cut-off frequencies, 14.6 Hz and 137.6 Hz, as shown in Fig. 6. The magnitude of PSD is presented on a dB scale as a function of frequency. As expected, the PSD of optical scintillation had a low-pass characteristic with the given cut-off frequencies [9, 14]. We used these two Butterworth cut-off frequencies as reference values to evaluate the im-pact of the EDFA’s gain characteristic on the suppression of atmospheric-turbulence-induced optical scintillation.
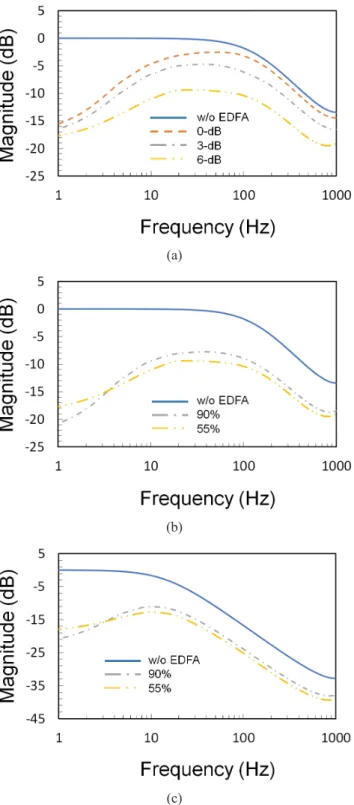
Finally, we estimated the combined PSD of the opti-cal scintillation using the EDFA’s measured high-pass frequency response from Fig. 5 and the calculated low-pass PSD of the atmospheric-turbulence-induced optical scintillation from Fig. 6. The combined PSD of the optical scintillation with the gain-saturated EDFA could be simply calculated using the low-pass PSD of the free-space chan-nel and the high-pass signal-transfer response of the EDFA in the optical receiver. Figure 7(a) shows the estimated PSD of the optical scintillation with a Butterworth cut-off frequency of 137.6 Hz, peak-modulation index of 55%, and three different gain-compression points. For comparison, the PSD without using an EDFA (as shown in Fig. 6) is also included. Even with the EDFA operated in the small-signal region (0-dB gain compression), the estimated PSD was reduced, especially at frequencies below 100 Hz. We found that the PSD of the optical scintillation could be reduced even above 100 Hz with high gain compression. The PSD of the optical scintillation was also estimated with a gain compression of 6 dB, Butterworth cut-off frequencies of 137.6 Hz (in Fig. 7(b)) and 14.6 Hz (in Fig. 7(c)), and two FIG. 5. Suppression ratio of peak-to-peak voltage variation
as a function of frequency. Four different peak-modulation indices (33% ●, 55% ▲, 70% ■, and 90% ◆) were used in the measurements.
FIG. 6. Calculated power spectral density of atmospheric-turbulence-induced optical scintillation as a function of frequency, for two Butterworth cut-off frequencies.
different peak-modulation indices of 55% and 90%. In both cases, no significant differences in the estimated PSD of the optical scintillation were observed for different peak-modu-lation indices and different Butterworth cut-off frequencies. From the results, we found that the amount of optical scin-tillation suppression was mainly determined by the amount of gain compression at the EDFA’s operating point.
III. SUMMARY
The impact of an EDFA’s gain-saturation characteris-tic on the suppression of atmospheric-turbulence-induced optical scintillation has been estimated for terrestrial FSO communication systems. Owing to the high-pass frequency response of the EDFA’s input-output signal transfer, the scintillation-induced received-power fluctuation could be suppressed efficiently. First, we confirmed that the EDFA had a high-pass frequency characteristic in input-output signal transfer for various peak-modulation indices of the optical input signal. We also found that peak-to-peak output power variation could be suppressed when the EDFA was operated in a deeply gain-saturated region. Then, the PSD of the optical scintillation was calculated for different peak-modulation indices of the optical input signal, and different amounts of EDFA gain compression. No significant dif-ferences in the suppression of optical-scintillation effects were observed with different peak-modulation indices of the optical input signal. Thus, we conclude that the amount of PSD suppression was mainly determined by the gain-compression level of the EDFA’s operating point.
ACKNOWLEDGMENT
This work has been supported by the Future Combat System Network Technology Research Center program of the Defense Acquisition Program Administration and Agen-cy for Defense Development (UD190033ED).
REFERENCES
1. H. Hemmati, Near-earth Laser Communications (CRC Press, Boca Raton, FL, USA, 2009), Chapter 3.
2. H. Henniger and O. Wilfert, “An introduction to free-space op-tical communication,” Radioengineering 19, 203–212 (2010). 3. F. Moll, J. Horwath, A. Shrestha, M. Brechtelsbauer, C. Fuchs,
L. A. M. Navajas, A. M. L. Souto, and D. D. Gonzalez, “Dem-onstration of high-rate laser communications from a fast air-borne platform,” IEEE J. Sel. Area Commun. 33, 1985–1995 (2015).
4. W. Fawaz, C. Abou-Rjeily, and C. Assi, “UAV-aided coopera-tion for FSO communicacoopera-tion systems,” IEEE Commun. Mag.
56, 70–75 (2018).
5. B. Moision, B. Erkmen, E. Keyes, T. Belt, O. Bowen, D. Brinkley, P. Csonka, M. Eglington, A. Kazmierski, N. Kim, J. Moody, T. Tu, and W. Vermeer, “Demonstration of free-space optical communication for long-range data links between
bal-FIG. 7. Estimated power spectral density of atmospheric-turbulence-induced optical scintillation as a function of frequency, with (a) a Butterworth cut-off frequency of 137.6 Hz, peak modulation index of 55%, and three gain-compression points; (b) a Butterworth cut-off frequency of 137.6 Hz, peak-modulation indices of 55% and 90%, and 6-dB gain compression; and (c) a Butterworth cut-off frequency of 14.6 Hz, peak-modulation indices of 55% and 90%, and 6-dB gain compression.
(a)
(b)
loons on Project Loon,” Proc. SPIE 100960, 100960Z (2017). 6. C. Chen, A. Grier, M. Malfa, E. Booen, H. Harding, C. Xia,
M. Hunwardsen, J. Demers, K. Kudinov, G. Mak, B. Smith, A. Sahasrabudhe, F. Patawaran, T. Wang, A. Wang, C. Zhao, D. Leang, J. Gin, M. Lewis, D. Nguyen, and K. Quirk, “High-speed optical links for UAV applications,” Proc. SPIE 10096, 1009615 (2017).
7. S. Bendersky, N. S. Kopeika, and N. Blaunstein, “Atmospheric optical turbulence over land in middle east coastal environ-ments: prediction modeling and measurements,” Appl. Opt.
43, 4070–4079 (2004).
8. L. C. Andrews, “Aperture-averaging factor for optical scintil-lations of plane and spherical waves in the atmosphere,” J. Opt. Soc. Am. A 9, 597–600 (1992).
9. H. Shen, L. Yu, and C. Fan, “Temporal spectrum of atmo-spheric scintillation and the effects of aperture averaging and time averaging,” Opt. Commun. 330, 160–164 (2014). 10. E. J. Lee and V. W. Chan, “Part 1: Optical communication
over the clear turbulent atmospheric channel using diversity,” IEEE J. Sel. Area Commun. 22, 1896–1906 (2004).
11. H. Liu, B. Huang, J. C. A. Zacarias, H. Wen, H. Chen, N. K. Fontaine, R. Ryf, J. E. Antonio-Lopez, R. A. Correa, and G. Li, “Turbulence-resistant FSO communication using a few-mode pre-amplified receiver,” Sci. Rep. 9, 16247 (2019). 12. M. Abtahi, P. Lemieux, W. Mathlouthi, and L. A. Rusch,
“Suppression of turbulence-induced scintillation in free-space optical communication systems using saturated optical ampli-fiers,” J. Lightwave Technol. 24, 4966–4973 (2006).
13. J. Freeman and J. Conradi, “Gain modulation response of erbium-doped fiber amplifiers,” IEEE Photonics Technol. Lett.
5, 224–226 (1993).
14. K.-H. Kim, T. Higashino, K. Tsukamoto, S. Komaki, K. Ka-zaura, and M. Matsumoto, “Spectral model of optical scintil-lation for terrestrial free-space optical communication link design,” Opt. Eng. 50, 035005 (2011).