Resolution analysis of Fourier Hologram using integral imaging
Ni Chen*, Jae-Hyeung Park, and Nam KimSchool of Electrical & Computer Engineering, Chungbuk National University [email protected]
ABSTRACT
We present an analysis on the quality factors of the Fourier hologram generated from multiple orthographic view images of three-dimensional object. In the analysis, we analyze both the maximum size of the reconstructed object and its spatial resolution. For the maximum size of the reconstruction, we found that the main factor is the orthographic projection angle interval. Too large projection angle interval causes overlapping in the reconstruction space domain. For the spatial resolution, there are three factors, i.e. the capturing lens array pitch which determines the spatial sampling rate of the original three-dimensional objects, the maximum orthographic projection angle, and the spatial frequency bandwidth of the object. The dominant factor is determined by the relationship between those three factors.
1. Introduction
Holography has been considered as a perfect technique for three-dimensional(3D) display. However, the complicated capture process of hologram has been problematic. Recently, hologram synthesis method using integral imaging has been reported [1]. In this method, coherent optical system is not required. Moreover, it is possible to obtain the multiple orthographic projection images from a single simple capture process. The manipulation of the 3D information of the objects is also easily achieved. In addition, the exact Fourier hologram can be generated in a straightforward way without any approximations. However, the resolution of the hologram generated by this method is limited. Experimental verification has been performed only for simple objects of low details. The exact theoretical analysis on the resolution of the hologram generated by this method has not been calculated yet.
In this paper, we present an analysis on the factors which affect the resolution of the reconstruction in the Fourier hologram generated from multiple orthographic view images of 3Dobject.
2. Fourier Hologram generation using multiple orthographic view images
In the method of generating integral Fourier hologram from multiple view images, the 3D objects are captured by a lens array under normal incoherent illumination system, and their multiple orthographic view images are generated from the captured image. Each orthographic view image is numerically overridden by the plane wave propagating at the direction of the corresponding view angle and integrated into a single complex value, which constitutes one pixel in the synthesized hologram. By repeating this process for all orthographic view images, we can generate the Fourier hologram of the 3D objects [4].
The relation between the 3D object O(x, z) and the Fourier hologram H (u) is [1]:
, 2 exp ) , ( ) (
∫∫
⎥ ⎦ ⎤ ⎢ ⎣ ⎡ ⋅ − = xu dxdz M b j z x O u H π (1)where M=-2ƒ/l, b=2/λl and u=Ms. And the projection angle θ=s/l, then u=-2ƒθ. Suppose the hologram size is 2Lu×2Lv, we can get Lu =2ƒθmax.
If the depth of the object is zero, the hologram is exact Fourier transform of the object, so we can reconstruct the object by using exact Fourier transform [2],
, ' 2 exp ) ( 1 ) ' ( ux du f j u H f x O = ∫∫ −
⎥⎦
⎤
⎢⎣
⎡
λ π λ (2)In case of the exact Fourier hologram, by using the sampling theory [2], the size of the reconstructed object is given by 2Lx´=λf/Δu, and the maximum frequency is given by ƒx´=Lu/λƒ.
Here we suppose the sampling interval of the hologram is Δu. From the previous description, we know that Δu=2ƒΔθ, where ∆θ is the projection angle interval. Therefore the reconstructed object size is,
2 . 2
Lx′= λθ
Δ (3) On the other hand, the maximum spatial frequency is given by max 2 max, λ θ λ = = ′ Luf x f (4)
We also know that the object is sampled by the lens array, and the sampling interval is the lens array pitch. Therefore from Eqs. (3) and (4), we can see that the spatial resolution of the reconstruction is dependent on both the maximum projection angle and the lens array pitch, and the size of the reconstruction is dependent on the angular interval between adjacent projection angles.
3. Overlapping in the reconstructed object
Figure 1 shows the spatial domain of the reconstructed object from the Fourier hologram. In order to avoid overlapping in the reconstruction space, the following condition should be satisfied.
, 4 θ λ Δ ≤ ′ x L (5) Therefore, ∆θ should be selected to a proper value such that the overlapping can be avoided.
x u f Δ λ u f Δ −λ −Lx' 0 Lx'
Fig.1. Spatial domain representation of the reconstruction when the hologram is sampled with ∆u
In the previous analysis we assumed the object depth is zero. Now suppose a3D object with depth z, we can get the complex field of the 3D object at the plane z=0 by performing Fresnel transform to the object. We have already known that the spatial bandwidth 2Bv is maintained by the Fresnel transform while the field size is changed to 2Lx=2Lxz+λz·2Bν [3], as shown in
Fig.2.
From this figure we can get that, if the depth Lxz is
smaller than Lx -λzBν, the maximum frequency is not
changed when we use the same ∆θ.
x x f fx' ' x xz L 2 2Lx
Fig. 1. Wigner distribution of an object transformed by distance z
So we can conclude that, to an object with size 2Lx,
and depth z, in order to avoid overlapping in the reconstruction, the interval of the projection angle ∆θ must be smaller than λ/4Lx.
4. Spatial resolution of the reconstructed object from Fourier hologram
Suppose the bandwidth of the object is Bx. The
sampling rate of each orthographic image is given by the lens array pitch, and the maximum spatial frequency of the reconstructed object is 2θmax/λ.
Therefore the spatial frequency distribution of the reconstructed object is given by Fig.3. Here ∆xp is the
lens array pitch.
x f 0 x B x B − p x Δ 1 p x Δ − 1 λ θmax 2 − 2θλmax
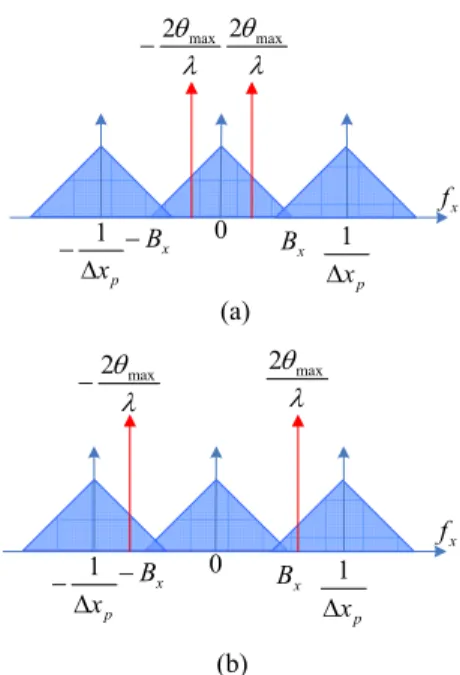
Fig. 3. Spatial frequency domain of the reconstruction According to the lens array pitch ∆xp, aliasing can occur. In practical case, the lens array pitch is not sufficiently small, we can assume that there is aliasing in the reconstruction. x f 0 x B x B − p x Δ 1 p x Δ − 1 λ θmax 2 − λ θmax 2 (a) x f 0 x B x B − p x Δ 1 p x Δ − 1 λ θmax 2 − 2θλmax (b)
Fig. 4 Reconstruction according to different θmax
When there is aliasing, we need to consider two cases according to the maximum projection angle θmax. If the
maximum projection angle is small as shown in Fig. 4(a), the reconstructed image is simply a low pass filtered version of the original object. If the maximum projection angle is large as shown in Fig. 4(b), the reconstructed image is affected by aliasing.
5. Conclusion
In this paper, we present an analysis on the size and the resolution of the reconstructed image from the integral Fourier holography which is generated from multiple orthographic view images of 3Dobject. The analysis shows the angular interval between adjacent projection angles determines the maximum image size, and both of the lens array pitch and the maximum projection angle affect the resolution.
Acknowledgement
"This work was supported by the grant of the Korean Ministry of Education, Science and Technology" (The Regional Core Research Program/Chungbuk BIT Research-Oriented University Consortium)
Reference
[1] J.- H. Park, Ni Chen, G. Baasantseren, M. Y. Shin, and N. Kim, “ Hologram generation from orthographic view images of three-dimensional object and its optimization,” Proc. SPIE 7329-0D, (2009)
[2] J. W. Goodman, Introduction to Fourier Optics, 2nd ed. (McGraw-Hill, New York, 1996), Chap. 9, p. 351-353. [3] A. Stern, and B. Javidi, “Improved-resolution digital holography using the generalized sampling theorem for locally band-limited fields,” J. Opt. Soc. Am. A 23,1227-1235 (2006)
[4] M.S. Kim, G. Baasantseren, N. Kim, J. H. Park, M.Y. Shin, and K.H. Yoo, “Fourier hologram generation of 3D objects using multiple orthographic view images captured by lens array,” Proc. SPIE 7233-04, (2009)