저작자표시-비영리-변경금지 2.0 대한민국 이용자는 아래의 조건을 따르는 경우에 한하여 자유롭게 l 이 저작물을 복제, 배포, 전송, 전시, 공연 및 방송할 수 있습니다. 다음과 같은 조건을 따라야 합니다: l 귀하는, 이 저작물의 재이용이나 배포의 경우, 이 저작물에 적용된 이용허락조건 을 명확하게 나타내어야 합니다. l 저작권자로부터 별도의 허가를 받으면 이러한 조건들은 적용되지 않습니다. 저작권법에 따른 이용자의 권리는 위의 내용에 의하여 영향을 받지 않습니다. 이것은 이용허락규약(Legal Code)을 이해하기 쉽게 요약한 것입니다. Disclaimer 저작자표시. 귀하는 원저작자를 표시하여야 합니다. 비영리. 귀하는 이 저작물을 영리 목적으로 이용할 수 없습니다. 변경금지. 귀하는 이 저작물을 개작, 변형 또는 가공할 수 없습니다.
A THESIS
FOR THE DEGREE OF MASTER OF ENGINEERING
Assessment of rainfall-runoff characteristics considering
temporal variability in Hancheon watershed of Jeju Island
KANAK KANTI KAR
Department of Civil and Ocean Engineering
GRADUATE SCHOOL
JEJU NATIONAL UNIVERSITY
2016. 02
Assessment of rainfall-runoff characteristics considering
temporal variability in Hancheon watershed of Jeju Island
Kanak Kanti Kar
(Supervised by Professor Sung-Kee Yang)
A thesis submitted in partial fulfillment of the requirement for the degree of Master of Engineering
2015. 12.
This thesis has been examined and approved.
Thesis Committee Member, Professor Nam-Hyeong Kim
Dept. of Civil & Ocean Engineering, Jeju National University
Thesis Committee Member, Professor Sang-Jin Kim
Dept. of Civil & Ocean Engineering, Jeju National University
Thesis Committee Member, Professor Sung-Kee Yang
Dept. of Civil & Ocean Engineering, Jeju National University
December, 2015
Department of Civil and Ocean Engineering
GRADUATE SCHOOL
JEJU NATIONAL UNIVERSITY
REPUBLIC OF KOREA
This thesis is dedicated to
My Beloved Father, Mother and Brother
Acknowledgements
First of all, I am grateful to the Almighty Lord Krishna for showering me with his
abundant blessing, strength and wisdom to achieve this work successfully.
This is my humble pride and pleasure to acknowledge my profound gratitude to respective
thesis advisor Professor Sung-Kee Yang, for the continuous supervision of my master’s study
and related research with his patience, motivation and immense knowledge. I always remember
his inspiring words, “Whatever and wherever experience you are gaining from the physical
phenomena of earth, once it will all help you to do better things in your life” and “Always try to
achieve your ambition with available resources throughout the surrounding”. His constant
scholarly guidance and cooperation gave me an extraordinary experience during my study and
research tenure.
I offer my heartiest honor to thesis committee members: Professor Nam-Hyeong Kim
and Professor Sang-Jin Kim, for their presence in my thesis presentation. Also, deeply thanks
for sharing knowledge throughout their class lecture. I feel privileged to have had the
opportunity to learn their academic course contents and useful experiences from research output.
I am deeply indebted to Dr. Woo-Yoel Jung, former Post-doctoral fellow who initiated my
life in Jeju Island and his active guidance, constant support and enthusiastic advice directly
contributed in my research.
I would like to express my heartfelt gratitude to R&D Center of Jeju National University
(JNU) for providing financial support and instrumental facilities in the research. I am very much
(Jwater), for her cordial help from the beginning of application in JNU and throughout the
research period.
I am very much thankful to Mr. Chang-Sun Lee and Mr. Yong-Seok Kim, for there
rigorous administrative and official help. My earnest gratefulness to Mr. Jun-Ho Lee for
showing me the efficient way of computer aided modeling on hydrological analysis. He always
takes care of work as a senior counselor in research center. The benevolent support in field
research and knowledge sharing with Mr. Bo-Seong Kang, Mr. Min-Chul Kim and Mr.
Myung-Su Kang had a great time to pass. Meantime, data collection into the deepwater stream,
measuring velocity and water temperature by different modern instrument, helped me a lot to
gather experience. Another field surveying was during heavy rainfall (typhoon) events that
allowed me to learn adjusted with the different working environment. I had a beautiful time with
all of my colleagues with whom discussing about study and life.
I would also like to acknowledge Dr. Rezaul Kabir Chowdhury (Assistant Professor,
UAE University, UAE), Mr. AFM Kamal Chowdhury (PhD Student, University of Newcastle,
Australia) and Mr. Fahad Khan Khadim (Graduate Researcher, Florida Atlantic University,
USA) for their constant mentoring, warm encouragement and valuable advice in my career.
I wish to express special thanks to my friends Mr. Nagamalleswara Rao Alluri, Mr.
Shahin, Mr. Mokter, Mr. Memoon, Mr. Ghayas, Ms. Witchaya Srisook and JISO members,
who has been cooperative and making my life joyful during my stay in Jeju.
I bow before my parents (Mr. Chitta Ranjan Kar and Ms. Krishna Rani Kar) who have
sacrificed today for the betterment of my tomorrow. Their love, patience and constant support
my younger brother’s (Mr. Utsha Kar) love and my friends who are always standing beside me
with their inspiration in all the ways. I am blessed to have them in my life.
Finally, I am greatly thankful to the entire Civil & Ocean Engineering department of Jeju
National University who has helped me directly and indirectly for the successful completion of
my thesis work.
Kanak Kanti Kar December, 2015
Table of Contents
Acknowledgements ... i
Table of Contents ... iv
List of Tables ... vii
List of Figures ... viii
Nomenclature ... ix
Summary ... x
Chapter I: Introduction ... 1
1.1 Estimation of surface rainfall-runoff ... 1
1. 2 Assessment of unit hydrograph parameters and runoff responses ... 2
1. 3 Spatial interpolation of rainfall by areal reduction factor (ARF) analysis ... 4
1.4 Development of L-moments approach by regional frequency analysis ... 5
1.5 Objectives and scope of thesis ... 7
1.6 Structure of this thesis ... 8
Chapter II: Study Area and Data Selection ... 9
2.1 Description of the watershed area and topography ... 9
2.1.1 Elevation and slope analysis ... 10
2.1.2 Land use classification... 12
2.1.3 Soil classification ... 13
2.1.4 Hydrological soil group (HSG) analysis ... 15
2.2 Rainfall data ... 16
2.2.1 Selection of rainfall station and available data ... 17
Chapter III: Methodology ... 21
3.1 Rainfall-runoff relation ... 21
3.1.1 National resources conservation service (NRCS) method ... 21
3.1.2 Curve number (CN) estimation ... 22
3.1.3 Runoff estimation by NRCS method ... 23
3.2 Unit hydrograph analysis ... 24
3.2.1 Storm events selection ... 24
3.2.2 Initial value selection of Clark parameters ... 25
3.2.3 Calibration of Clark parameters ... 25
3.2.4 Model performance ... 26
3.3 Areal reduction factors (ARF) fundamentals ... 26
3.4 L-moments based regional rainfall frequency analysis ... 28
3.4.1 L-moments method: theoretical background ... 28
3.4.2 Data screening by discordancy measure ... 29
3.4.3 Regional heterogeneity test ... 30
3.4.4 Goodness-of-fit measure ... 31
3.4.5 Estimation of regional rainfall frequency ... 31
3.5 Using tools for the study ... 32
Chapter IV: Results and Discussion ... 33
4.1 Application of NRCS CN method for runoff volume ... 33
4.1.1 Estimation of curve number (CN) ... 33
4.1.2 Five years rainfall-runoff analysis results ... 35
4.2 Estimation of direct runoff from storm events ... 36
4.2.3 HEC-HMS model validation ... 39
4.3 Estimation of areal reduction factor (ARF) ratio ... 41
4.4 Development of L-moments approach for rainfall frequency analysis ... 43
4.4.1 Stationary and independence test ... 43
4.4.2 Identification of homogeneous region by Cluster based analysis ... 44
4.4.3 Estimation of L-moments, homogeneity test and best fitted distribution... 46
4.4.4 Estimation of regional rainfall frequency and growth curves ... 48
4.4.5 Frequency analysis for five rainfall station ... 50
Chapter V: Conclusions and Future Work ... 52
5.1 Conclusions ... 52
5.2 Recommendation for the future work ... 53
References ... 54
List of Tables
Table 2.1 Watershed characteristics 10
Table 2.2 Elevation analysis result 11
Table 2.3 Slope analysis result 12
Table 2.4 Land use analysis result over the watershed 13
Table 2.5 Soil class and HSG analysis result in the watershed 14
Table 2.6 Hydrological soil group (HSG) classification 15
Table 2.7 List and type of the five rainfall stations’ utilized for analysis 18
Table 2.8 Thiessen polygon area and their percentage 20
Table 3.1 AMC classification for the NRCS method of rainfall abstraction 23
Table 3.2 Summary of selected five storm rainfall events 24
Table 4.1 CN values for land cover classification 33
Table 4.2 Runoff curve number in different antecedent moisture condition (AMC) of soil
34
Table 4.3 Rainfall-runoff depth and volume of five years annual rainfall 35
Table 4.4 Calibration of Clark parameters and difference between peak runoff hydrographs
37
Table 4.5 Statistical Analysis: ANOVA analysis for Clark parameters 39
Table 4.6 Summary of trend analysis of maximum hourly rainfall series using Mann-Kendall test
43
Table 4.7 Discordance, heterogeneity measure and best fitted distribution for three regions
48
Table 4.8 Simulation results of estimated regional frequency, RMSE and corresponding 90% error bounds values
49
Table 4.9 Results of the consecutive hour (6-, 12-, 24-hr) regional rainfall frequency for five station
List of Figures
Figure 2.1 Hancheon watershed in Jeju Island 9
Figure 2.2 Digital elevation model (DEM) and slope analysis of the watershed 11
Figure 2.3 Land use and soil class map 12
Figure 2.4 Hydrological soil group (HSG) category 16
Figure 2.5 Location of rainfall stations near Hancheon watershed in Jeju Island 17
Figure 2.6 Rainfall time series data availability over five rainfall stations 19
Figure 2.7 Thiessen polygon area for the Hancheon watershed 20
Figure 3.1 Variables of the NRCS method of rainfall abstractions 21
Figure 3.2 Using analysis tools during this study 32
Figure 4.1 NRCS curve number (CN) 34
Figure 4.2 Comparison between observed and simulated runoff hydrograph 37
Figure 4.3 Comparison after calibration between observed and simulated runoff 39
Figure 4.4 Validation of model considering typhoon Nakri (1-2 August, 2014) 40
Figure 4.5 Variation of ARF values for each station (considering 6-hr, 12-hr, 24-hr rainfall)
42
Figure 4.6 Autocorrelation function (ACF) analysis plot of five rain gauge stations (Dashed line indicating 95% confidence interval)
44
Figure 4.7 Dendrogram of clustered stations by Ward’s method 45
Figure 4.8 Location of three homogeneous regions in Hancheon watershed 45
Figure 4.9 Yearly variation of average L-moments ratio for three regions 47
Figure 4.10 Estimated regional growth curve for three homogeneous regions (within
90% error bound)
Nomenclature
AMC Antecedent Moisture Condition ARF Areal Reduction Factor
ANOVA Analysis of Variance ACF Auto-correlation Function AWS Automatic Weather Station
CN Curve Number
CV Covariance
DEM Digital Elevation Model
ESRI Environmental System Research Institute GEV Generalized Extreme Value
GIS Geographical Information System
HEC-HMS Hydrologic Engineering Center- Hydrologic Modeling System HSG Hydrological Soil Group
HSPF Hydrological Simulation Program - FORTRAN HSIMHYD Hydrologic Simulation Model
IDF Intensity-Duration-Frequency
IHMM Integrated Hydro Meteorological Model KMA Korean Meteorological Administration lmomRFA L-moments Regional Frequency Analysis NRCS Natural Resources Conservation Service NERC Natural Environmental Research Council NSE Nash-Sutcliffe Efficiency
RMSE Root Mean Square Error RFA Regional Frequency Analysis SWAT Soil and Water Assessment Tool SWMM Storm Water Management Model SCS Soil Conservation Service
TRSM Threshold Runoff Simulation Method USACE United States Army Corps of Engineers USDA U.S. Department of Agriculture
Summary
Increasing the average rainfall and number of heavy rainfall events created the demand of
rainfall-runoff characteristics estimation in Hancheon watershed of Jeju Island. This thesis paper
considered the NRCS CN (Natural Resources Conservation Service-curve number), unit
hydrograph method for understanding the runoff and developed L-moments method for rainfall
frequency analysis.
Firstly, the NRCS CN method application result of five years rainfall showed 18% to 44%
runoff variation from the total annual rainfall and the 2012 year received maximum
rainfall-runoff volume. After that, unit hydrograph method was applied for estimation of peak rainfall-runoff and
peak time. To analyze observed rainfall-runoff and time, four storm events from 2012 were
selected for calibration and typhoon Nakri of 2014 was used for validation. The HEC-hydrologic
modeling system (HMS) simulation results showed the peak runoff varies from 151 to 546
m3/sec and peak runoff time varies 8 to 27 hour. Meantime, a comprehensive relationship between Clark unit hydrograph parameters (time of concentration and storage coefficient) was
also derived. The optimized values of hydrograph parameter were statistically verified by the
analysis of variance (ANOVA) and the runoff comparisons were performed by r-square, root
mean square error (RMSE) and Nash-Sutcliffe efficiency (NSE) method. The statistical
performances of NSE, RMSE and r-square were found as 0.88, 37.52 and 0.76, respectively. The
analysis results provide a decision for selecting rainfall-runoff event.
Final analysis was on rainfall frequency estimation considering spatio-temporal variability.
As a result, L-moments based statistical analysis techniques were shown the dependable results.
maximum consecutive hour rainfall (6-, 12-, 24-hour). Then, independence and stationary test of
rainfall stations were analyzed using Mann-Kendal and autocorrelation function (ACF) analysis.
Hereafter, cluster analysis and discordancy measure showed that the Hancheon watershed is
belonging in three regions. Then, L-moments based heterogeneity measure identified that
Gumbel and generalized extreme value (GEV) distribution as robust distribution for the study
area. Afterwards, Monte Carlo simulation was applied to evaluate the accuracy of frequency
estimation and the root mean square error (RMSE). In contrast, the RMSE values for watershed
were seen as 0.014 to 0.237 for Gumbel and 0.115 to 0.301 for GEV distribution. The linear
regression analysis of the frequency r-square value showed a variation of 0.842 to 0.974.
In essence, the assessment of rainfall-runoff characteristics following the above methods
can be provided reliable and accurate results. Thus, these study findings are being suggested for
Chapter I: Introduction
1.1 Estimation of surface rainfall-runoff
Rainfall-runoff linkage is one of the most important relationships in hydrologic analysis.
Runoff needs to be estimated for assessment of water availability and functions, to underscore
the modalities for efficient utilization of water. Rainfall, on the other hand, is a primary input for
watershed level runoff computation. The estimation of rainfall-runoff plays a pivotal role in
water resource management and feasibility level planning for resources distribution, as well as
hydrologic and hydraulic design of structures. In term of importance, a prominent stream which
contains most its rain has been considered. There are some lumped (HEC-HMS, HSIMHYD,
IHMM, etc.) and distributed (SWAT, GIS, SWMM, HSPF, NRCS CN, etc.) models are available
for calculating watershed runoff after a rainfall event. Among of them, NRCS curve number (CN)
method using GIS tool have been chosen for watershed of Jeju Island due to the models
flexibility, efficiency, accuracy and parametric availability (SCS 1972).
The curve number (CN) is a combination of rainfall, land use and soil class. In hydrology,
CN is used to determine the infiltration of water into soil and the amount of water becomes
surface runoff. A high runoff means the area contains of high CN value in urban areas and a low
runoff means the low CN value in dry soil. In this study, geographical extent had confined within
the watershed. A watersheds runoff for daily rainfall events represents its overall response, and is
therefore, an effective way to determine its total water availability (runoff volume). Thus, the
approach has implicated for planning of several conservative measures in South Korea (Hawkins
1. 2 Assessment of unit hydrograph parameters and runoff responses
Estimation of peak flood runoff and its timing is a fundamental issue for developing the
design and controlling the functions of various flood protection and other hydrologic structures
(Pegram and Parak 2004). The assessment of peak runoff depends on rainfall-runoff intensity, as
well as the geomorphologic and climatic characteristics of a watershed. If the watershed area
contains long temporal soaked rain, soil becomes saturated with water, for which no excess
rainfall can enter it. Such cases are usually followed by the eventual draining out of excess
rainfall into adjacent streams, resulting large amount of flow. These spatio-temporal variation of
runoff largely constraints the pragmatic yet accurate estimation of peak flow, for which the
concept of unique unit hydrograph is predominantly used. Unit hydrograph method is accepted
procedure for transforming rainfall access to obtain runoff time distribution.
The very first unit hydrograph introduced by Sherman (1932), which considers the
physiographic factors of watershed to predict hydrograph. A similar effort has been made in this
study, which attempts to use the unit hydrograph concept to simulate a peak flood runoff of a
typical water-soaked watershed area, by analyzing the historical information on rainfall-runoff of
multiple storm rainfall events. A typical watershed named Hancheon watershed from Jeju Island
has been chosen in this regard. Over the years, Jeju Island has been hit by heavy rainfall events
as well as tropical storms and the study area also contains small patches with mountainous
characteristics.
A total number of five rational models for determining the unit hydrograph have been
inspected during this case study, the first of which was derived by Clark (1945). Clark unit
are assumed to have large length-width ratios and a relatively complex geomorphology (Sabol
1988). The model implies rainfall-runoff estimations using two major empirical parameters: time
of concentration (Tc) and storage coefficient (R). The relationship between Tc and R was
proposed by Johnstone et al. (1949), using major stream length and slope factor. The second
rational method, developed by Snyder (1938), relates the time from centroid of the rainfall to the
peak of unit hydrograph. The basic assumption of this method is that different watershed area
having similar geometrical characteristics will have identical values of peak flood runoff and
onset time. These regional parameters i.e. excess rainfall duration and area’s storage coefficients
are determined using the watershed lag time. The method also allows for un-gauged watersheds
of similar patterns rainfall. The third method is known as the soil conservation service (SCS
1964) triangular unit hydrograph method, which developed a dimensionless hydrograph assumed
by the relationship between accumulated total rainfall-runoff, infiltration and initial abstraction.
However, implication of this method for high water levels is relatively difficult and the various
antecedent moisture conditions (I, II and III) cannot handle rainfall-runoff problems accurately
(Capece et al. 1988). The fourth method was the kinematic wave method (Wooding 1965) which
investigated overland flow and created a stream hydrograph assuming gravity force. This is a
physics based approach similar to the conventional hydrograph concept. The method requires the
use of numerical methods in order to account for non-uniform rainfall and variable of watershed
characteristics. The last method is Mod-Clark method, which inspected a computer aided model
to incorporate grid cell data into detail hydrograph modeling (USACE 1995). This method is
popular in rainfall-runoff modeling as it can very closely represent the torrential rainfall patterns
To understand the storm rainfall-runoff characteristics of Hancheon watershed, several
significant recent articles had been studied. Kim et al. (2014) investigated the flood runoff
characteristics using surface image velocimetry method by disaster monitoring technology and
considering 2012 years’ storm rainfall events. The study gives an idea about observed runoff
data measurement by Kalesto meter. Another study inferred that the Hancheon stream watershed
runoff can be affected by the upstream reservoir operation (Moon et al. 2014). This study
estimated peak runoff ‘with’ and ‘without’ reservoir operation scenarios, by considering typhoon
Dianmu and typhoon Nari. Chung et al. (2011) developed threshold runoff simulation method
(TRSM) to overcome the limitation of SWAT application for Jeju Island based on 2008-2010
daily limit rainfall-runoffs. The study provides the calibration method techniques and NRCS
curve number (CN) idea for Hancheon watershed. Another study has been carried out based on
the process of unit hydrograph parameters’ estimation using stream water velocity, as developed
by Jung et al. (2014), where the time of concentration and storage coefficient were estimated
using Kraven II and Sabol formula respectively. The limitation of this study was unit
hydrographs parameters range which could not be derived. Therefore, this study will present the
parameters range along with peak runoff and time.
1. 3 Spatial interpolation of rainfall by areal reduction factor (ARF) analysis
Generally, design rainfall values are expressed from the fixed point rainfall, which is depth
at a specific location. These require knowledge about spatial variability over a specified area.
Concurrently, determine the amount of areal rainfall is also very important. Therefore, a spatial
rainfall interpolation (point rainfall convert to areal rainfall) can be solved by areal reduction
Areal reduction factor (ARF) is define as the factors when applied to point values for a
specific return period and duration provide the areal rainfall for the same durations and return
period (NERC 1975). The ARF concepts give spatial variability framework of various
hydrological processes. In mainland of South Korea, for dam design and operation, public safety
and other surface water projects has been ARF for extreme hydrological events. In spite of the
long term average rainfall and increasing extreme rainfall events, ARF estimation is also
essential for Jeju Island’s water control structures.
1.4 Development of L-moments approach by regional frequency analysis
In addition of gusty wind, typhoon wrought from heavy rainfall considered as a
fundamental component of water cycle which has a wide range of application in hydrological
engineering. The coastal part of East Asia is extensively and continuously hit by climatic disaster
that has a substantial affect on large extent to the social and economic condition of the country
(Jun 1989; Shabri et al. 2011; Chang 2012; Cai et al. 2014). As such, extreme
hydro-meteorological occurrences are currently the lead research topics for its potentially dangerous
phenomena (Bruce 1994; Obasi 1994). Attempts are therefore made to reliable estimation of
extreme rainfall occurrence and corresponding frequency information accuracy to control the
hydrologic systems design for Jeju Island.
A typical watershed of Jeju Island (Hancheon watershed), South Korea has been
considered as study area for developing regional frequency distribution using L-moments
approach. The study area usually experiences by several typhoon events per decade. Specially,
over past ten years (2005-2014), a number of typhoons (e.g. Typhoon Nari, Khanun, Dembin,
people were missing and 1.41 million USD property were looses. Due to short duration of data
records, complex geographic and hydro-meteorological characteristics, a study need on regional
frequency analysis (RFA) to improve the estimation process of extreme rainfall over the island.
RFA approaches were widely applied for various spatial conditions. The idea was continuously
developing and new approaches were further investigated by other researcher and hydrologists.
Many researchers published paper on regional frequency analysis and they used
L-moments approach to determine regions as similar category rainfall and viewed as a modification
of the probability moments (e.g. Bradley 1998; Parida et al. 1998; Fowler and Kilsby 2003;
Kumar et al. 2005; Noto et al. 2009; Saf 2009; Shahzadi et al. 2013; Devi and Choudhury 2013;
Liu et al. 2015). Previously, Um et al. (2010) studied on extreme rainfall in Jeju Island with
respect to influential parameters including: elevation, latitude, longitude and five distribution
models. They also proposed for the multiple non-linear forms, linear regression and established
an intensity-duration-frequency (IDF) relationship curve that increased the model accuracy as
18.31-86.27%. Up to now, the working methods explored and published on regionalization for
the estimation of rainfall includes: cluster analysis (Easterling 1989; Venkatesh and Jose 2007),
L-moments analysis (Hosking 1990), L-moments associated with cluster analysis (Guttman 1993;
Schaefer 1990; Satyanarayana and Srinivas 2008; Wallis et al. 2007), spatial correlation analysis
(Gadgil et al. 1993), homogeneity test (Wiltshire 1986) and regional frequency analysis
1.5 Objectives and scope of thesis
To assess the rainfall-runoff characteristics and develop technique for rainfall frequency of
Hancheon watershed, NRCS CN method, unit hydrograph method and L-moments approach has
been addressed. The runoff volume, runoff intensity and rainfall return period analysis are the
main objectives of this study. In addition, to design and prepare useful application from the
limited observed data and distinct geomorphologic condition, the specific study activities are
intent to:
Estimate rainfall-runoff volume by NRCS CN method using the semi distributed model. The watershed runoff for daily rainfall events represents its overall response and istherefore, NRCS CN method an effective way to determine yearly total amount of water
availability.
Preliminarily investigate the temporal variations of peak runoff and hence establish Clark unit hydrograph parameters (Tc, R) range.
Assess the statistical relationship by ARF techniques for the 6-, 12-, 24-hour design storm. Furthermore, graphical representation of ARF will provide an outline for Jeju Island.
Develop an economical frequency estimation procedure for the extreme rainfall characteristics by the Hosking and Wallis (1997) method. The specific aim is to carry outthe regional frequency analysis (RFA) method for 6-, 12-, 24-hour maximum consecutive
rainfall series using L-moments approach. This information is expected to provide a
suitable idea on the extreme rainfall probability distribution.
The results of this thesis may provide valuable suggestion for rainfall-runoff characteristics
1.6 Structure of this thesis
The thesis organized into five chapters as follows:
Chapter I gives a brief introduction about the surface rainfall-runoff, unit hydrograph,
spatial interpolation of rainfall by ARF, unit hydrograph and L-moments based frequency
estimation with comprehensive literature review on rainfall assessment principles.
Chapter II provides details about the selected study area and basic rainfall data
information. Also, the land use and soil class properties for further analysis are presented.
Chapter III describes the fundamentals of rainfall assessment techniques and equations
used are presented. Specifically rainfall-runoff estimation by NRCS CN, unit hydrograph by
Clark method, ARF ratio and L-moments approach for regional frequency analysis are obtained.
Chapter IV represents the results and related discussion on rainfall-runoff volume, peak
runoff and time along with the unit hydrographs parameters range, peak runoff, areal reduction
factor (ARF) ratios and rainfall design estimation by L-moments. Also, the study showed the
frequency analysis results for different returns periods in terms of regions.
Finally, Chapter V summarizes the salient features of this present study, provides
Chapter II: Study Area and Data Selection
2.1 Description of the watershed area and topography
The Hancheon watershed shows the dynamic and distinct hydrological characteristics with
an area of 37.39 sq. km, located in Jeju Island of South Korea (Figure 2.1). The watershed area
is bounded by the north at latitude 32ᵒ54′ to 33ᵒ31′ and east longitude bounded at 126ᵒ30′ to
126ᵒ33′. Although the study area covers 2.02% of the total area of Jeju Island, but the orographic
condition significantly influences the variability of the rainfall amounts. The major stream of
watershed is Hancheon stream, originated at Halla Mountain flows from south to north and
directly enter into the ocean. The stream is most important due to wideness and prototypical
significant which control the runoff after a continuous rainfall.
Figure 2.1 Hancheon watershed in Jeju Island.
The topography of study area has been generated in the form of a 30-meter resolution
environmental system research institute, ESRI). Topographical characteristics, average width of
stream and watershed shape calculated using 1/250,000 spatial digitize map of the Jeju Island.
After analyzing in GIS, the stream length, watershed average width and form factor are seen as
20.05 km, 1.86 km and 0.09. Table 2.1 carried out the basic topographical information of the
watershed.
Table 2.1 Watershed characteristics Area (sq. km) Stream length (km) Mean elevation (km) Average width (A/L), km Form factor (A/L2) 37.393 20.052 0.688 1.860 0.088
Considering the proto-typical significance of these study outputs, simplicity of the
calculation methods, temporal variability and the overall appropriateness in connection with
other uniform watershed, this study area is chosen.
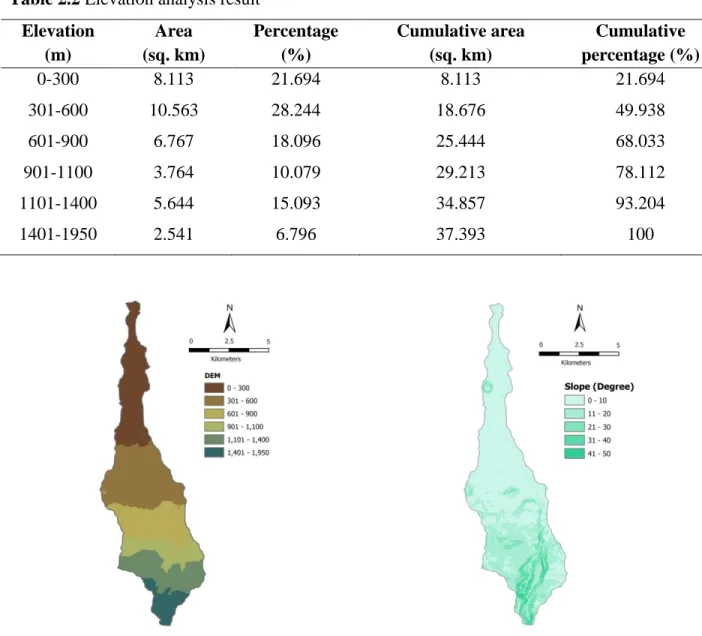
2.1.1 Elevation and slope analysis
Watershed elevation considered as vital factor that affecting rainfall infiltration, runoff
determination and evapo-transpiration of the area. Consequently, slope which effects on surface
water velocity, flow and erosion features. The Hancheon watershed has an elevation of 10 m to
1,950 m from the mean above sea level (Figure 2.2). The 0-600 m elevation with an area of
18.68 sq. km (50%) falls on urban area. Meantime, 601-900 m covers 18.1 % area, 901-1,100 m
elevation accounted in 10.1% area, 1,101-1,400 m elevation covers 15.09% area and 1,401-1,950
Table 2.2 Elevation analysis result Elevation (m) Area (sq. km) Percentage (%) Cumulative area (sq. km) Cumulative percentage (%) 0-300 8.113 21.694 8.113 21.694 301-600 10.563 28.244 18.676 49.938 601-900 6.767 18.096 25.444 68.033 901-1100 3.764 10.079 29.213 78.112 1101-1400 5.644 15.093 34.857 93.204 1401-1950 2.541 6.796 37.393 100
Figure 2.2 Digital elevation model (DEM) and slope analysis of the watershed.
On the other hand, slope is very effective parameter for the study due to its steep
characteristics. Average slope of Hancheon watershed is 10.8 degree. Slope analysis results
shows that 0 to 20 degree covers 87.72% area and rest of 12.28% area covering 20.01 to 50
Table 2.3 Slope analysis result Slope (degree) Area (sq. km) Percentage (%) Cumulative area (sq. km) Cumulative percentage (%) 0-10 21.871 58.489 21.871 58.489 10.01-20 10.931 29.233 32.802 87.722 20.01-30 2.680 7.166 35.482 94.888 30.01-40 1.495 3.999 36.977 98.887 40.01-50 0.416 1.113 37.393 100
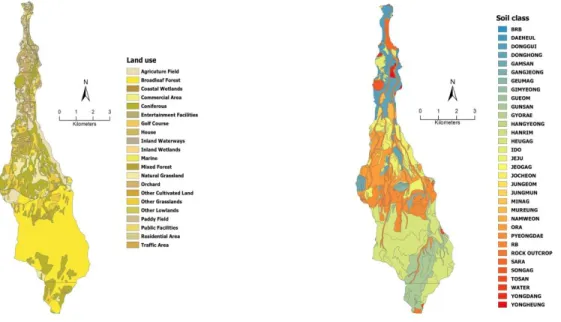
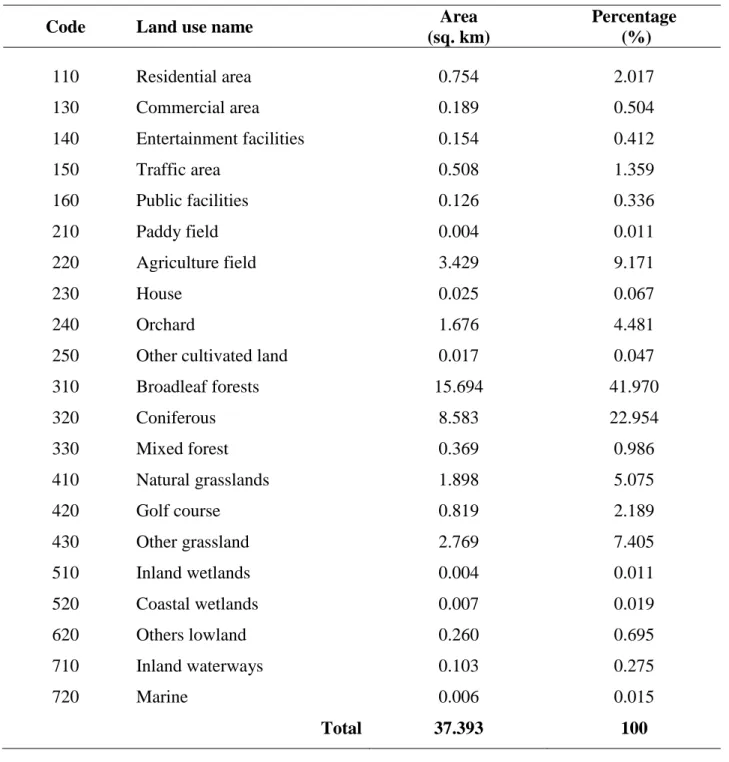
2.1.2 Land use classification
Land surface and its effective fineness are very important to estimate runoff of the study
area. The land use classification of watershed shows that an area of 24.28 sq. km situated in
forest and near to mountain that covers the 65% area. The northern part of the study area
identified as urban area which covers 14.19% of total watershed has significance for analysis
event rainfall and stream analysis.
Table 2.4 Land use analysis result over the watershed
Code Land use name Area
(sq. km) Percentage (%) 110 Residential area 0.754 2.017 130 Commercial area 0.189 0.504 140 Entertainment facilities 0.154 0.412 150 Traffic area 0.508 1.359 160 Public facilities 0.126 0.336 210 Paddy field 0.004 0.011 220 Agriculture field 3.429 9.171 230 House 0.025 0.067 240 Orchard 1.676 4.481
250 Other cultivated land 0.017 0.047
310 Broadleaf forests 15.694 41.970 320 Coniferous 8.583 22.954 330 Mixed forest 0.369 0.986 410 Natural grasslands 1.898 5.075 420 Golf course 0.819 2.189 430 Other grassland 2.769 7.405 510 Inland wetlands 0.004 0.011 520 Coastal wetlands 0.007 0.019 620 Others lowland 0.260 0.695 710 Inland waterways 0.103 0.275 720 Marine 0.006 0.015 Total 37.393 100 2.1.3 Soil classification
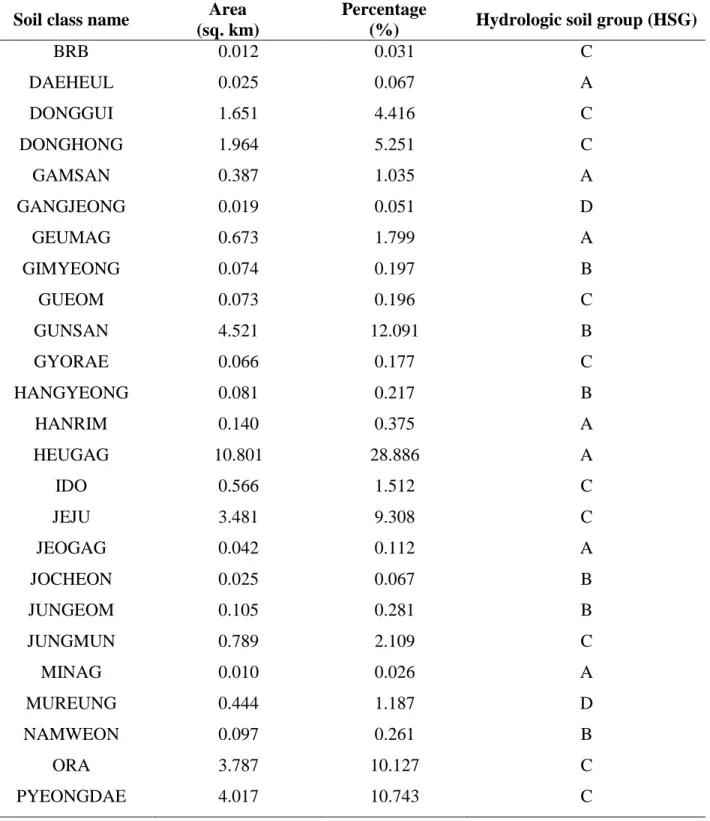
The effective of soil, infiltration characteristics, permeability and average clay content are
influenced the hydrology of any watershed. Based upon the soil classification analysis of
28.89%, 12.09%, 10% and 9% area. This soil class data were collected from Korean society of
agriculture engineering (1977) database.
Table 2.5 Soil class and HSG analysis result in the watershed
Soil class name Area
(sq. km)
Percentage
(%) Hydrologic soil group (HSG)
BRB 0.012 0.031 C DAEHEUL 0.025 0.067 A DONGGUI 1.651 4.416 C DONGHONG 1.964 5.251 C GAMSAN 0.387 1.035 A GANGJEONG 0.019 0.051 D GEUMAG 0.673 1.799 A GIMYEONG 0.074 0.197 B GUEOM 0.073 0.196 C GUNSAN 4.521 12.091 B GYORAE 0.066 0.177 C HANGYEONG 0.081 0.217 B HANRIM 0.140 0.375 A HEUGAG 10.801 28.886 A IDO 0.566 1.512 C JEJU 3.481 9.308 C JEOGAG 0.042 0.112 A JOCHEON 0.025 0.067 B JUNGEOM 0.105 0.281 B JUNGMUN 0.789 2.109 C MINAG 0.010 0.026 A MUREUNG 0.444 1.187 D NAMWEON 0.097 0.261 B ORA 3.787 10.127 C
Soil class name Area (sq. km)
Percentage
(%) Hydrologic soil group (HSG)
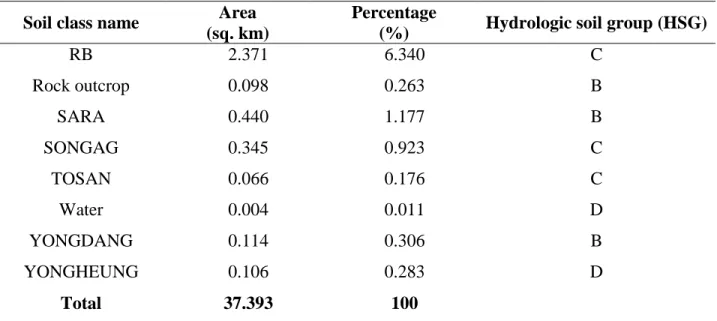
RB 2.371 6.340 C Rock outcrop 0.098 0.263 B SARA 0.440 1.177 B SONGAG 0.345 0.923 C TOSAN 0.066 0.176 C Water 0.004 0.011 D YONGDANG 0.114 0.306 B YONGHEUNG 0.106 0.283 D Total 37.393 100
2.1.4 Hydrological soil group (HSG) analysis
The analysis of hydrological soil group (HSG) of Hancheon watershed is classified into
four categories (A, B, C and D) based on the infiltration characteristics (Figure 2.4). Infiltration
characteristics influenced by the soil class and effective depth of soil. Group A having high
infiltration that indicates the low runoff potentiality of soil, group B shows the moderately low
runoff potential, group C having moderately high runoff potential and group D clarifies the high
runoff potential of soil. Classification of HSG category shows that group A, B, C and D values
are 12.08, 5.56, 19.19 and 0.573 sq. km (Table 2.6). Therefore, 51.31% of total area showed
moderately low infiltration. These soil classes have moderate rates of water transmission.
Table 2.6 Hydrological soil group (HSG) classification
HSG category Area (sq. km) Percentage (%)
A 12.077 32.298
B 5.556 14.859
C 19.186 51.310
D 0.573 1.532
Figure 2.4 Hydrological soil group (HSG) category. 2.2 Rainfall data
Generally, weather of Jeju Island shows seasonal variation due to monsoon climate. About
43% of the total annual rainfall occurs in summer (June to August) and autumn (September to
November). Every year, typhoon events are resulting from extreme consecutive hour rainfall and
tropical wind to cause of flash flood. Due to the spatial and temporal variability of rainfalls, the
Korean Meteorological Administration (KMA) of Jeju province collects hind casting
meteorological data across the Hancheon watershed by tipping bucket system. In this study, we
have used hourly rainfall data of five gauge station near the watershed which compiled by the
automatic weather station (AWS) of Jeju regional meteorological administration. The data record
length varies between 11 and 50 years. The annual average rainfall near coastal region shows
Figure 2.5 Location of rainfall stations near Hancheon watershed in Jeju Island.
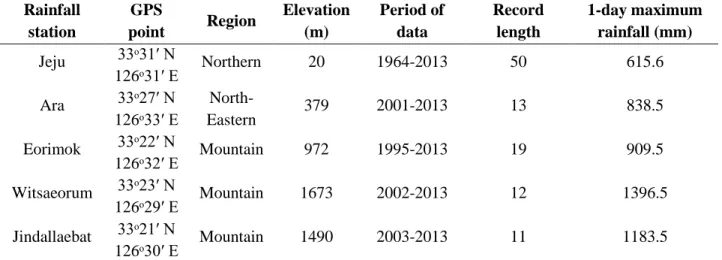
2.2.1 Selection of rainfall station and available data
The substantial differences in elevation and geographical location have created
considerable variation in daily rainfall patterns over different place of the island. Prior to the
availability of above mention high-quality data, there were found very few rainfall recording
stations in Hancheon watershed. Among five rainfall stations, Witsaeorum station (near to the
highest peak of the Jeju Island) receives the maximum daily rainfall of 1,396.5 mm (Table 2.7)
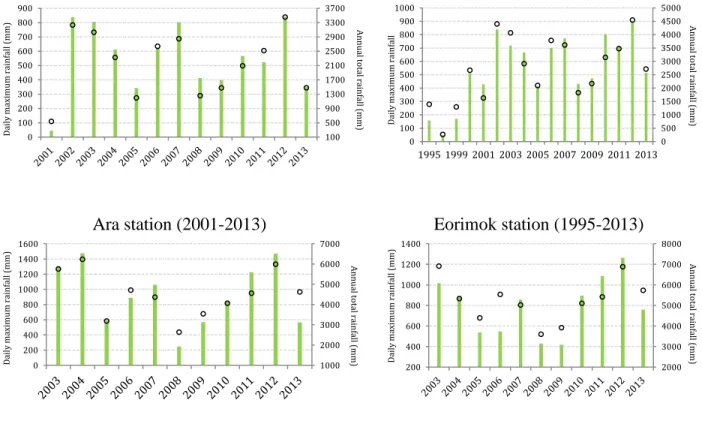
in a single calendar day since AWS began tracking rainfall data. Figure 2.6 showing the daily
maximum and annual total rainfall of each station which has the temporal and station-wise
annual rainfall shows 2,526.0 mm in 2012. Accordingly, in the case of Ara, Eorimok,
Witsaeorum and Jindallaebat rainfall station maximum daily rainfall are 838.5 mm, 909.5 mm,
1,396.5 mm and 1,183.5 mm for the year of 2012, total annual rainfall obtained as 3,461.5 mm,
4,459.0 mm, 6,514.5 mm and 7,317.0 mm. In comparison with the other rainfall years, highest
number of extreme rainfall events occurred in 2012. The potential reason could be the orographic
rainfall effects with mountainous topography.
Table 2.7 List and type of the five rainfall stations’ utilized for analysis
Rainfall station GPS point Region Elevation (m) Period of data Record length 1-day maximum rainfall (mm) Jeju 33ᵒ31′ N 126ᵒ31′ E Northern 20 1964-2013 50 615.6 Ara 33ᵒ27′ N 126ᵒ33′ E North-Eastern 379 2001-2013 13 838.5 Eorimok 33ᵒ22′ N 126ᵒ32′ E Mountain 972 1995-2013 19 909.5 Witsaeorum 33ᵒ23′ N 126ᵒ29′ E Mountain 1673 2002-2013 12 1396.5 Jindallaebat 33ᵒ21′ N 126ᵒ30′ E Mountain 1490 2003-2013 11 1183.5 Jeju station (1964-2013) 500 800 1100 1400 1700 2000 2300 2600 100 200 300 400 500 600 700
Annual total rainfall (mm) Daily maximum rainfall (mm)
A nn ua l tota l ra in fa ll ( m m ) D aily m axim um ra in fa ll (m m )
Ara station (2001-2013) Eorimok station (1995-2013)
Witsaeorum station (2003-2013) Jindallaebat station (2003-2013)
Figure 2.6 Rainfall time series data availability over five rainfall stations. 2.2.2 Thiessen polygon area analysis
To establish any basic water resources plan and adopt with watershed area, the rainfall
observatory station convert into the spatial rainfall is very useful tool. Thiessen polygon ratio
was developed around the rainfall stations to take account of the close proximity of average
rainfall at each station. The analysis results Ara station covering maximum 31% area wherever
Jeju, Eorimok, Witsaeorum and Jindallaebat shows 26%, 20%, 14% and 9% (Figure 2.7 and
Table 2.8). In Jeju Island, thiessen polygon ratio method shows the accurate spatial rainfall with
compare to other method, which clarify that regional rainfall increases with the elevation. This
analysis has done due to develop temporal runoff by NRCS CN method.
100 500 900 1300 1700 2100 2500 2900 3300 3700 0 100 200 300 400 500 600 700 800 900 A nn ua l to ta l r ain fa ll (m m ) Da ily m axim um r ain fa ll (m m ) 0 500 1000 1500 2000 2500 3000 3500 4000 4500 5000 0 100 200 300 400 500 600 700 800 900 1000 1995 1999 2001 2003 2005 2007 2009 2011 2013 Da ily m axim um r ain fa ll A nn ua l to ta l r ain fa ll (m m ) 1000 2000 3000 4000 5000 6000 7000 0 200 400 600 800 1000 1200 1400 1600 Da ily m axim um r ain fa ll (m m ) A nn ua l to ta l r ain fa ll (m m ) 2000 3000 4000 5000 6000 7000 8000 200 400 600 800 1000 1200 1400 Da ily m axim um r ain fa ll (m m ) A nn ua l to ta l r ain fa ll (m m )
Figure 2.7 Thiessen polygon area for the Hancheon watershed. Table 2.8 Thiessen polygon area and their percentage
Station name Area
(sq. km) Percentage (%) Jeju 9.725 26 Ara 11.590 31 Eorimok 7.478 20 Witsaeorum 5.235 14 Jindallaebat 3.365 9 Total 37.393 100
Chapter III: Methodology
3.1 Rainfall-runoff relation
3.1.1 National resources conservation service (NRCS) method
Rainfall-runoff relationship was firstly developed (1972) among a watershed region by the
U.S. Department of Agriculture (USDA) national resources conservation service (NRCS). For
rainfall event, the excess rainfall Pe is always less than or same to the rainfall depth P (Figure
3.1). If there have some initial abstraction of rainfall for which runoff will not occur, then the
potential rainfall is P-Ia.
Figure 3.1 Variables of the NRCS method of rainfall abstractions: P is total rainfall, Pe is rainfall excess, Ia denote the initial abstraction and Fa is continuing abstraction. (Source: Chow 1964)
The NRCS methods assumes that the ratios of two actual and potential quantities are equal,
which is,
From continuity, P = P + I + F (3.2)
From the combination of equation 3.1 and 3.2, we found the Pe values as,
Which consider as basic equation for the excess rainfall depth computation by the NRCS
method. For small watershed like Jeju Island, initial abstraction (Ia) is empirically assume as
0.4S, here S is the potential maximum retention.
3.1.2 Curve number (CN) estimation
Curve number (CN) is a function of land use, soil class (antecedent soil moisture) and
others factor affecting runoff in watershed after a rainfall event occurred. In terms of
dimensionless parameter CN defined as,
Here, CN = 100 for impervious water surface and CN < 100 for natural surface.
Consequently, another important analysis is antecedent moisture conditions (AMC) that
refers to presence of moisture content into the soil (Table 3.1). For practical application of AMC,
three categories were grouped by NRCS:
AMC-I: Low moisture (dry condition)
AMC-II: Average moisture condition (normal condition)
AMC-III: High moisture, sufficient rainfall occurred over the preceding few days (wet condition)
For AMC-I and AMC-III condition following equations can be computed using,
Table 3.1 AMC classification for the NRCS method of rainfall abstraction (Sources: Mays 2012) AMC type
Total five day antecedent rain (mm)
Dormant season Growing season
I Less than 13 Less than 35
II 13 to 28 35 to 53
III More than 28 More than 53
3.1.3 Runoff estimation by NRCS method
Five rainfall stations observed data, soil class and land use data has been used to determine
the rainfall-runoff characteristics. The conventional land use/land cover map and soil map of
watershed digitized by GIS and the attributed tables were linked accordingly. Afterwards, soil
and land cover data have been intersected in GIS to determine the CN. As the watershed is
positioned in the urban, semi urban and mountainous area of the Island, therefore a variation was
seen. Among of them, lower elevation area (urban area) is contained a high curve number,
indicating high runoff and low infiltration. Consequently, low curve number indicates the high
infiltration and low runoff.
The NRCS CN method (SCS 1972) developed a rainfall-runoff relation for watershed. As
defined by NRCS soil scientists, soils are classified into four hydrologic groups i.e. A, B, C and
D (SCS 1986), depending on infiltration, soil classification and other criteria. Land use
classifications are used in the preparation of hydrological soil-cover content, which in turn are
used in estimating runoff. Antecedent moisture condition (AMC) is an indicator that refers to the
moisture content present in the beginning of the rainfall-runoff event and can have a significant
according to AMC based on the equation 3.5 and 3.6.
3.2 Unit hydrograph analysis
This study employs to develop the consistency of surface runoff hydrograph according to
Clark unit hydrograph method. The following steps were carried out during the process.
3.2.1 Storm events selection
Viessman et al. (1989) described three characteristics of heavy rainfall events from a
well-defined unit hydrograph which are; the simple hydrograph structure with distinct peak, extended
duration of rainfall and uniform spatial distribution. Following the above criterion, five
independent heavy rainfall events (Table 3.2) from 2012 to 2014 have been clustered to be used
in model calibration and validation. A study was carried out by Yang et al. (2014) which also
considered heavy rainfall events for Hancheon watershed. In this study, without antecedent, the
rainfall average lag time was found as around 1.5 hr, which increased notably by more than 45%
following an antecedent rainfall event. The resulting temporal distribution of rainfall at five
stations and consequent runoff was then assembled in HEC-HMS 2.2.2 version program
(USACE 2000).
Table 3.2 Summary of selected five storm rainfall events
Storm events Data availability Average rainfall (mm)
Heavy rainfall 21-22 April, 2012 314.96
Typhoon Khanun 18-19 July, 2012 293.12
Typhoon Dembin 22-23August, 2012 961.89
Typhoon Sanba 16-17 September, 2012 659.38
3.2.2 Initial value selection of Clark parameters
In order to apply the Clark method in HEC-HMS model, it is necessary to estimate the
time-area relationship between runoff travel times and watersheds contributed area. Travel time
is the only independent variable in this case, which time is required from the most remote part of
watershed outlet. Generally, it is assumed that travel time is proportional to the stream length
from the watershed’s outlet point. A time-area relationship of watershed, which contributes
runoff to the watershed outlet as a function of time is measured from the onset of rainfall excess.
Initial time of concentration and storage coefficient has been computed with the following
empirical formula of Kirpich (1940) and Clark:
Here, L is the length of stream in km, S represents the land slope of watershed and α is
coefficient (value varies from 0.4 to 1.4).
3.2.3 Calibration of Clark parameters
Consequential results of the Clark’s two parameters (Tc and R) were examined by
sensitivity analysis. The sensitivity was performed based on trial-and-error method. Meantime,
the numerical values (Tc and R) were always assumed in between 0.1 to 3. The optimal values of
the parameters were also derived. Afterwards, an optimum pair (Tc, R) was used to compare
between observed and simulated peak runoff information. Meanwhile, the rainfall loss was also
following slight alterations of Tc and R (within 0.1 to 3), the values for Tc and R were
acknowledged. The effort was also made to reduce the uncertainty of parameters.
3.2.4 Model performance
The calibrated parameters of four selected storm rainfall events were projected by
trial-and-error approach. These parameter values were firstly adjusted by analysis of variance
(ANOVA) method (e.g. Gophen 2012). After calibration of parameters, Nash-Sutcliffe efficiency
(NSE) model (Nash and Sutcliffe 1970) and peak weighted root mean square error (RMSE)
(USACE HEC-HMS 1995, 1998) were used for testing the performance of runoff model results.
Here, n is ordinate number, i is varying from 1 to n, Qoi is i-th ordinate observed runoff, Qsi
is i-th ordinate simulated runoff and is average observed runoff of the hydrograph.
3.3 Areal reduction factors (ARF) fundamentals
ARF factor is defined as, point rainfall values when which applied for a particular duration
and return period provide areal rainfall for the same duration and return period. There are two
types of ARF, which are geographically fixed and storm centered relationship (Miller et al. 1973;
Srikanthan 1995). Geographically fixed ARFs are related to rainfall at any random point. The
method estimated from average frequency based quantile estimates using annual maxima rainfall
statistics but not from any individual storms so as to refer as statistical reduction factors. The
empirical equation can be represented as:
Storm centered ARF’s are connected with the effective depth calculation for the discrete
storm events. Following this method, the individual event ratio represents of contour lines depth
and storms maximum depth. Due to the difficulty of implementation on multi centered storms,
this ARF method is not widely used this kind of approach is very difficult to implement but can
be used only for individual storms.
This study has conducted by the Asquith and Famiglietti (2000) method considering the effective depths for watershed area. The ARF results are always between 0 and 1. The RFA’s are calculated upon the watershed characteristics, like as watershed shape and storm recurrence
interval. The approach has a best fit line that provides expected ratio. It does not require spatial
averaging of rainfall. So, this technique could be applied there. The empirical equation is follows
as:
(3.12)
Here, is station rainfall i for the annual maximum areal rainfall occurred in year j, is the annual maximum point rainfall, k is number of stations into the study area. From this method,
6-, 12-, 24-hr ARF ratios are determined. Later, this estimated result can be applied into the
3.4 L-moments based regional rainfall frequency analysis 3.4.1 L-moments method: theoretical background
The L-moments approach was firstly introduced by Hosking (1990) which is the suitable
statistical modeling and facilitates the estimation process of probability distribution and
frequency analysis. Recent years, rainfall extreme studies on statistical analysis are followed by
method-of-moments estimator for annual maximum (viz. hourly, daily, monthly) time series,
particularly in regional analysis. The L-moment provides a reasonable efficient estimation
characteristic of hydrological data and distributions parameters. In practical, advantages of using
L-moments includes: can be estimated from limited data samples, provide dispersion, skewness
and kurtosis which have less bias than other ordinary moments of probability distributions.
Hosking (1990) characterized the L-moments based on probability weighted moments (PWMs)
and can be shown as:
Here, is a linear function of r-th L-moment of a X distribution and r = 1, 2, 3,… is a non-negative integer. From equation (1), the first four resulting L-moment can be written as:
Hosking (1990) describes the utility of ratio estimators based on the L-moments ratios in
hydrological extreme analysis and can be followed as:
Where, is the measure of covariance (scale), is the measure of skewness (shape) and is the measure of kurtosis (peakedness). The value of is constrained by 0 to 1 range. Notable, these ratio estimator equations and their graphical diagrams are particularly good to
identify the distributional properties of highly skewed data. Thus, following the above equations
rainfall of 6-, 12-, 24-hr L-moments ratio for each regions has shown in this study.
3.4.2 Data screening by discordancy measure
A discordancy measure, , which is used to screen out the data from unusual sites and to check the appropriate data for regionalization. Let, a vector as which restrained the L-moments ratios for site i (Hosking and Wallis 1993), than discordancy measure
defined as:
Where, = vector of L-CV, L-Skewness and L-Kurtosis; S is covariance matrix of and is mean vector of .
3.4.3 Regional heterogeneity test
Homogeneous region identification is the significant step in regional frequency analysis.
The statistics compare between the inter-site distributions of L-moments sample can be projected
as homogeneous region. Hosking and Wallis (1993) proposed that derivation of statistical test for
a homogeneous region is defined as heterogeneity measure (H). To determine the expected
heterogeneity, Monte Carlo simulation of rainfall having record lengths equal to that of the
observed data are performed which is familiar in hydrological analysis. The heterogeneity
measure (H) can be obtained as:
Here, and are the mean and standard deviation of simulated data, respectively. is calculated from the regional data, which can be employed from three V-statistics (V1, V2, V3) as follows:
For H statistics criterion, Hosking and Wallis (1993) suggested that the region is
reasonably homogeneous if H < 1, possibly homogeneous region if 1≤ H < 2 and absolutely
heterogeneous region if H ≥ 2.
3.4.4 Goodness-of-fit measure
The regional frequency distribution L-moment ratio diagrams and goodness-of-fit measure
are chosen based on sample regional average and theoretical L-Kurtosis. For a particular
distribution, the goodness-of-fit measure is calculated as follows:
Here is an average L-Kurtosis value from the data of a given region, is a theoretical L-Kurtosis value for a fitted distribution and is the standard deviation value that obtained from simulated data. For an approximate 90% confidence level, the acceptable
goodness-of-fit is found at .
3.4.5 Estimation of regional rainfall frequency
The frequency distribution procedure of maximum consecutive hour rainfall data in a same
homogeneous region consist of similar frequency distribution (Dalrymple 1960). In the
simulations, frequency estimated for various robust probability distributions has been calculated.
If the frequency estimates consists of regional growth curve , i site non-exceedance probability F and site scaling factor l1, then the T-year frequency of the normalized regional
distribution is computed by: where q is common dimensionless function. For simulation of a homogeneous region, the regions are having the same number of stations, data
frequency error, root mean square error (RMSE), 90% error bounds are estimated for the
accuracy assessment.
3.5 Using tools for the study
During NRCS CN analysis, unit hydrograph, ARF ratio and regional frequency analysis
ArcGIS 10.3.1, HEC-HMS 2.2.2, R language 3.2.0 and Origin 6.1 software tools were used
(Figure 3.2). We also used the L-moment approach (lmomRFA 3.0-1 version) in R package,
developed by Hosking (2009).
Chapter IV: Results and Discussion
4.1 Application of NRCS CN method for runoff volume 4.1.1 Estimation of curve number (CN)
Using the data soil class and infiltration rates, Hancheon watershed has been classified in
four groups (A, B, C and D) with a mixture of soil and land cover characteristics (Table 4.1).
Each land cover has a unique CN value obtained in Figure 4.1. In this analysis assumes that
watershed’s drainage systems are directly connected with the impervious area. The impervious
area was found 1.60 sq. km that is 4.28% of total watershed area. In methodology section
narrated that infiltration and initial abstractions of soil are governed by AMC. Following the
equation 3.4, AMC-II was calculated for average condition of soil and slope. For this condition
CN value was value estimated as 67.40 (Mays 2010). Meantime, the CN values for dry (AMC-I)
and wet (AMC-III) conditions were found 47.50 and 82.90 respectively (Table 4.2).
Table 4.1 CN values for land cover classification
Code Area name A B C D
110 Residential 58 73 82 86 130 Commercial - 96 97 - 140 Entertainment Facilities 95 96 97 - 150 Traffic Area 89 91 93 94 160 Public Facilities - 88 91 93 210 Paddy Field - - 78 220 Agriculture Field 64 75 82 86 230 House - - 98 - 240 Orchard 44 66 77 83
250 Other Cultivated Land 74 82 -
Code Area name A B C D
320 Coniferous 46 68 79 86
330 Mixed forest 47 68 79 -
410 Natural Grassland 30 58 71 78
420 Golf Course - - 80 -
430 Other Grass Land 52 70 80 85
510 Inland Wetland - 98 98 -
520 Coastal Wetlands - - 98 98
620 Others Lowland - 86 91 94
710 Inland Waterways - 100 100 100
720 Marine - - 100 -
Figure 4.1 NRCS curve number (CN).
Table 4.2 Runoff curve number in different antecedent moisture condition (AMC) of soil
AMC I II III
4.1.2 Five years rainfall-runoff analysis results
The runoff depth and runoff volume had been calculated based on NRCS CN method. The
runoff in Hancheon watershed resulting from the given last five years rainfall, soil classification,
infiltration rates and land use. After that, the runoff depth was multiplied by watershed area that
conferred the total annual runoff volume. The calculations and results based on NRCS-CN
method, infer the annual runoff depth for last five years in Hancheon watershed and the total
volume of water (Table 4.3). From the analysis result, 2009 and 2013 year showed the lower
runoff volumes (where the runoff depth was 385.73 mm and 536.19 mm) that indicating arid
behavior of the watershed, experiencing very little rainfall events. But 2012 year, typhoon events
and continues heavy consecutive rainfall resulting the huge volume of runoff occurred in the
province. The runoff percentage values varied within a range of 18% to 44%, indicating the
temporal (seasonal) effects of the rainfall in cumulative runoff. In essence, the analysis result
provides runoff volume extends in relation to rainfall and the maximum rainfall-runoff receiving
year.
Table 4.3 Rainfall-runoff depth and volume of five years annual rainfall Year Annual rainfall
(mm) Runoff depth (mm) Runoff percentage (%) Runoff volume (1012 Mm3) 2013 2317.53 536.19 23.14 20048.144 2012 4160.11 1820.63 43.76 68073.356 2011 3185.19 992.33 31.15 37103.219 2010 3186.08 1239.86 38.91 46358.365 2009 2050.07 385.73 18.82 14422.445
4.2 Estimation of direct runoff from storm events
From the runoff volume analysis by NRCS CN method, study came out a decision that the
year of 2012 was received the maximum runoff volume. Therefore, the unit hydrograph study
(Clark hydrograph method) was undertaken to analyze the heavy rainfall events. Also, average
CN (67.40) and percentage of impervious area (4.28%) value were used as initial input of
HEC-HMS modeling.
4.2.1 Data calibration for unit hydrograph parameters estimation
The Kirpich equation had been used by many researchers’ in the recent past (Kumar et al.
2002; Shaoo et al. 2006; Ahmad et al. 2009) research work, using time-area relationships and
geomorphologic parameters of watershed. According to use the geomorphologic data, Kirpich’s
time of concentration and Clark’s storage coefficient values was found 1.59 and 3.06. These
initial values were used in the HEC-HMS model for peak data estimation of four different
rainfall events (Peters 1993), but it showed an unstable relation between observation and
simulation results. After that, trial-and-error method was applied to optimize the objective
function i.e. peak weighted root mean square error (RMSE). Following the objective function
and trial-and-error analysis of hydrograph parameters (Tc and R) nearest runoff simulation
values were shown in Table 4.4 and Figure 4.2.
During calibration of Clark unit hydrograph parameters, the peak runoff (Qp) and time of peak (Tp) were also being estimated. Optimized values were showing good coherence between observed and simulated results. Table 4.4 showing that, the observed peak runoff varied 162.26
to 544.38 m3/sec, whereas maximum simulated runoffs varied by 151.89 to 545.36 m3/sec. On the other hand, observed peak time intervals were found from 9.0 hr to 20.83 hr, whereas the
simulated peak time showed 8.33 to 26.60 hr. The maximum observed and simulated runoffs
were identified for typhoon Sanba. The typhoon Sanba showed observed runoff 544.38 m3/sec and simulated runoff 545.36 m3/sec where 9.0 hr and 8.33 hr peak times were found.
Table 4.4 Calibration of Clark parameters and difference between peak runoff hydrographs
Storm events Clark’s parameter Observed Simulated Error (%) Tc R Qp (m 3 /sec) Tp (hr) Qp (m 3 /sec) Tp (hr) Heavy rainfall 1.8 0.1 162.26 12.0 242.09 11.0 49.20 Typhoon Khanun 1.05 0.4 172.65 20.83 151.89 20.67 12.02 Typhoon Dembin 1.6 0.5 157.14 18.17 219.74 26.60 39.84 Typhoon Sanba 1.3 0.32 544.38 9.0 545.36 8.33 0.18
Noticeable that storm rainfall event’s rising limb to peak runoff was found within short
duration (1-day). The error percentage for heavy rainfall, typhoon Khanun, typhoon Dembin and
typhoon Sanba were seen at 49.2, 12.02, 39.84 and 0.18. Thus, typhoon Sanba and typhoon
Khanun provides accuracy better than the other occurred events, for which, the study can be
selected these two events for making decision.
Heavy rainfall (21-22 April, 2012)
0 1 2 3 4 0 50 100 150 200 250 300 12:00 AM 12:00 PM 12:00 AM 12:00 PM 12:00 AM Ru n o ff (m 3/se c)
Rainfall Loss Simulated Runoff Observed Runoff
Ra in fa ll (m m /m in ) Error %= 49.20