저작자표시-비영리-변경금지 2.0 대한민국 이용자는 아래의 조건을 따르는 경우에 한하여 자유롭게 l 이 저작물을 복제, 배포, 전송, 전시, 공연 및 방송할 수 있습니다. 다음과 같은 조건을 따라야 합니다: l 귀하는, 이 저작물의 재이용이나 배포의 경우, 이 저작물에 적용된 이용허락조건 을 명확하게 나타내어야 합니다. l 저작권자로부터 별도의 허가를 받으면 이러한 조건들은 적용되지 않습니다. 저작권법에 따른 이용자의 권리는 위의 내용에 의하여 영향을 받지 않습니다. 이것은 이용허락규약(Legal Code)을 이해하기 쉽게 요약한 것입니다. Disclaimer 저작자표시. 귀하는 원저작자를 표시하여야 합니다. 비영리. 귀하는 이 저작물을 영리 목적으로 이용할 수 없습니다. 변경금지. 귀하는 이 저작물을 개작, 변형 또는 가공할 수 없습니다.
Evaluation of Indirect Liquid Cooling for Electric
Vehicle Battery Thermal Management System
by
Waseem Raza
(Supervised by Professor Youn Cheol Park)
DISSERTATION
Submitted in partial fulfillment of the requirements for
the degree of Master's in Mechanical Engineering
Department of Mechanical Engineering
Jeju National University
iv
Acknowledgments
All praise to Almighty Allah, who is Most Merciful, is for completing this thesis. My humblest gratefulness to the Holy Prophet Muhammad (SAWW) and Ahl-e-Bait (AS), whose lifeways have been continuous guidance for me.
I would like to express my deepest gratitude to my advisor Prof. Youn Cheol Park, Dean of Mechanical Engineering Department, for his continuous guidance and support throughout my master's degree and research work. He has not only been an excellent scientific mentor but a very humble human being. Besides this, I would like to thank my dissertation evaluation committee (Prof. Myung Taek Hyun and Prof. Nam Jin Kim) for their valuable suggestions and comments during the thesis defense. I appreciate the support and encouragement given to me by my colleagues and dear friends for their kind support and help during my Jeju National University endeavors. Their presence certainly made the journey much more comfortable and exciting.
Finally, my special gratitude extends to my beloved parents for their generous support, prayers, and love towards my success. I am indebted to my brother Mr. Afzal Raza for his never-ending support right from the school days. Without his help, this would certainly not be possible for me. I am deeply thankful to other siblings who encouraged me to get to this point. Finally, I would like to thank Mr. Kausar Siddiqi, Mr. Hamid Masood, and everyone who helped me out. Without their support and motivation, I was unable to complete my work.
v
Dissemination
Journal Publications
1 Raza, W., Ko, G. S., & Park, Y. C. (2020). A Study on Combined Driven Refrigeration Cycle using Ejector. (Accepted)
2 Raza, W., Ko, G. S., & Park, Y. C. (2020). Induction Heater Based Battery Thermal Management System for Electric Vehicles. Energies, 13(21), 5711.
3 Nhut, L. M., Raza, W., & Park, Y. C. (2020). A Parametric Study of a Solar-Assisted House Heating System with a Seasonal Underground Thermal Energy Storage Tank. Sustainability, 12(20), 8686.
4 Raza, W., Ko, G. S., & Park, Y. C. (2020). Performance Evaluation of Battery Thermal Management System in Electric Vehicle using Induction Heater (Part 1: Parallel System). International Journal of Air-Conditioning and Refrigeration, 28(01), 2050003.
Conference Publications
1 Raza, W., Tuul O., Kim, B. C., & Park, Y. C. (2020). Performance Comparison of a Water-to-Water Heat Pump System with Low GWP Refrigerant. Korean Society of Mechanical Engineers Conference, Online.
2 Raza, W., Kim, J. H., Jang, J., Tuul O., & Park, Y. C. (2020). Development of a Heat Pump System using Waste Heat from Power Plants. The 15th Joint Symposium of Nagasaki University and Jeju National University, Nagasaki, Japan.
vi
3 Raza, W., Ko, G. S., Tuul O., & Park, Y. C. (2019). Performance Characteristics of an Ejector-Driven Refrigeration System according to Evaporation Temperature. Korean Society of Geothermal Engineers Winter Conference, Seoul, South Korea. 4 Gantulga, E., Raza, W., Park, Y. C., Kim, J. H., & Ko, G. S. (2019). A Basic
Experiment of an Conditioner using an Ejector. The Society of Air-Conditioning and Refrigerating Engineers of Korea (SAREK) Summer Conference, PyeongChang, South Korea.
5 G. S., Park, Y. C., & Raza, W. (2019). Basic Study of Ejector Air-Conditioner. The Society of Air-conditioning and Refrigerating Engineers of Korea (SAREK) Spring Conference, Busan, South Korea.
vii
Table of Contents
Abstarct ... 1
Chapter 1 Introduction ... 3
1.1 Overview ... 3
1.2 Adverse Effect of Temperature on Lithium-ion Battery ... 4
1.2.1 Low Temperature ... 5
1.2.2 High Temperature ... 6
1.2.3 Advised Temperature Range ... 9
1.3 Battery Thermal Management System ... 9
1.3.1 BTMS Selection Based on Medium ... 11
1.3.2 Indirect Cooling Method ... 14
1.3.3 Cold Plate ... 14
1.4 Objective/Aim ... 16
1.5 Thesis Structure ... 16
Chapter 2 Modeling, Simulation, and System Description... 18
2.1 Conservation Equations ... 18
2.2 Required Operating Mode of Thermal System ... 19
2.2.1 Chiller Mode ... 21
viii 2.2.3 Heater Mode ... 23 2.3 Chiller ... 24 2.4 Radiator ... 25 2.5 Battery Pack ... 26 2.6 Cooling System ... 28
Chapter 3 Simulation Setup ... 33
Chapter 4 Results and Discussion ... 36
4.1 45 kWh Battery Pack ... 36
4.1.1 Cooling Cycle using Chiller for 45 kWh Battery Pack ... 36
4.1.2 Cooling Cycle using Radiator for 45 kWh Battery Pack ... 40
4.2 64 kWh Battery Pack ... 43
4.2.1 Cooling Cycle using Chiller for 64 kWh Battery Pack ... 43
4.2.2 Cooling Cycle using Radiator for 64 kWh Battery Pack ... 46
Chapter 5 Comparison and Verification ... 49
Chapter 6 Conclusions and Future Work ... 53
References
ix
List of Figures
Figure 1. Process of thermal runaway [23]. ... 8
Figure 2. Available battery thermal management system according to the medium. ... 11
Figure 3. BTMS operating mode required related to battery temperature flow chart. ... 20
Figure 4. Cooling system schematic diagram using chiller. ... 21
Figure 5. Cooling system Schematic diagram using radiator. ... 22
Figure 6. Schematic diagram of the BTMS heating system using an induction heater ... 23
Figure 7. Simulation diagram of Chiller. ... 24
Figure 8. Simulation diagram of a radiator. ... 25
Figure 9. Pouch cell diagram. ... 26
Figure 10. Battery pack assembly from cell to vehicle integration ... 27
Figure 11. Battery pack and coolant entrance and exit paths ... 29
Figure 12. Different cold plate configurations ... 31
Figure 13. Energy consumption of pump versus flow rate. ... 32
Figure 14. Cooling rate against flow rate at an outside temperature of 25 °C. ... 36
Figure 15. Cooling rate against flow rate at an outside temperature of 30 °C. ... 38
Figure 16. Cooling rate against flow rate at an ambient temperature of 35 °C. ... 39
Figure 17. Cooling rate versus flow rate at an airflow of 1200 CMH. ... 40
x
Figure 19. Cooling rate versus flow rate at an airflow of 3600 CMH. ... 42
Figure 20. Impact of cooling rate with flow rate at ambient temperature 25 °C. ... 43
Figure 21. Impact of cooling rate with flow rate at ambient temperature 30 °C. ... 44
Figure 22. Impact of cooling rate with flow rate at ambient temperature 35 °C. ... 45
Figure 23. Cooling rate against flow rate at an airflow of 1200 CMH. ... 46
Figure 24. Cooling rate against flow rate at an airflow of 2400 CMH. ... 47
Figure 25. Cooling rate against flow rate at an airflow of 3600 CMH. ... 48
Figure 26. Comparison of 45 & 64 kWh battery packs with chiller & radiator cycles ... 49
xi
List of Tables
Table 1. Operating fluid thermophysical properties ... 28 Table 2. Test Conditions for Cycle using Chiller ... 35 Table 3. Test Conditions for Cycle using Radiator ... 35
xii
Nomenclature
A Ampere
Ah Ampere hour
BEV Battery electric vehicle
BTMS Battery thermal management system
Cf Smooth pipe friction factor
CMH Cubic meters per hour
Cp Specific heat
d Pipe diameter
EV. Electric vehicle
HEV Hybrid electric vehicle HTF Heat transfer fluids
K Thermal conductivity
k Thermal Conductivity
kW Kilowatt
kWh Kilowatt per hours
Li-B Lithium-ion battery Li-ion Lithium-ion
LPM Liter per minute
Ni-Cd Nickle-cadmium
xiii
Nu Nusselt number
PCM Phase change materials PHEV Plug-in hybrid electric vehicle
Pr Prandtl number
TR. Thermal Runaway
Ueff Effective velocity outside boundary layer
1
Abstract
Green-powered electric vehicles are reliable substitutes to lessen greenhouse gas emissions and reliance on fossil fuels. Electric vehicles are now extensively used worldwide, and this will be high in the future. The battery pack is the key feature of an electric vehicle. The battery pack's performance and life are incredibly temperature-sensitive, a problem related to battery thermal management. So, it is mandatory to keep the optimal temperature range for smooth performance and safety. This study evaluates the coolant cooling system for the thermal management of 45 kWh and 64 kWh battery packs, respectively. A chiller and radiator are employed to cool the operating fluid, combining water and ethylene glycol with the 50:50 ratio. A thermal-fluid simulation executed using a standard commercial tool known as GT Suite, and the battery pack temperature experiment using a vehicle was conducted to validate the simulation results. The results reveal that the proposed systems' performance typically improved by improving the flow rate and the chiller power. It depicts that the cooling rate is maximum at 40 °C initial battery temperature and an ambient temperature of 25 °C with 3 kW chiller capacity and flow rate of 20 liters per minute (LPM) in the chiller cycle mode. While in the radiator cycle, the highest cooling rate is at an ambient temperature of 25 °C, an initial battery temperature of 40 °C with an airflow rate of 3600 cubic meters per hour (CMH), and a 30 LPM of coolant flow rate in both systems, respectively. Besides, a thermal management system of a 45 kWh battery pack was found better than a 64 kWh battery pack system
2
in terms of cooling performance. In the future, the proposed BTMS could be a realistic solution and help develop the electric vehicles' thermal system.
3
Chapter 1 Introduction
1.1 Overview
In the 21st century, with growing concerns about the scarcity of fossil fuel, the price of crude oil, and technological development, electric vehicles have acquired a greater interest in transport mode. Many electric vehicles, including pure electric vehicles (EVs), hybrid electric vehicles (HEVs), and plug-in hybrid electric vehicles (PHEVs), have been produced in recent years. Toyota and Honda have introduced the Prius, Insight, and Civic electric vehicles since 1997. The consumers of these vehicles are praised tremendously. In 2008, Tesla launched the first-ever lithium-ion battery electric vehicle, namely Tesla Roadster, for over 200 mileage. Nissan Leaf, KIA NIRO, and Hyundai Kona gained tremendous attention in recent years. According to the International Energy Agency, electric cars (BEVs, PHEVs) deliveries topped 2.1 million worldwide to boost the total stock to 7.2 million electric vehicles in 2019 [1].
The global challenge of electricity scarcity and environmental emissions has prompted the increasing popularity of electric vehicles to take the top stage in the future. In the transport market, electric vehicles are expected to increase 22% by 2030 due to emissions from EVs that have up to 43% lower emissions than diesel vehicles and have lower lifetime climate impact than those with IC engines. Anderson et al. [2] indicated that the EVs' usage could lead to a remarkable reduction of greenhouse gas emissions by approximately 40% if the energy supplies by renewable resources.
4
Electric vehicles are becoming increasingly prevalent worldwide to solve the deterioration of environmental and energy problems. The effectiveness of electric vehicles relies primarily on their storage system for electricity. The significant areas of focus for electric vehicles are to find a reliable system of energy storage that can accommodate high mileage, rapid charging, and practical driving [3]. Currently, lithium-ion batteries have the best characteristics to satisfy the wide variety of specifications unique to automotive applications low cost, no pollution, self-discharge rate, good power capabilities, light-weight, no memory effect, higher energy density, and long-life cycle [4]. The flat-plate batteries are often preferred because of their higher power density.
1.2 Adverse Effect of Temperature on Lithium-ion Battery
Compared to other rechargeable batteries, such as lead-acid, nickel-cadmium (Ni-Cd), nickel-metal hybrid (Ni-MH) batteries, rechargeable lithium-ion batteries are considered the most suitable energy storage option for EVs. However, Li-ion batteries may be problematic if they are not appropriately treated. The battery's performance and state of health (SOH) is firmly dependent on the working ambient temperature.
A large quantity of heat is generated inside the pack, particularly during the fast charging and discharging process because of several chemical reactions and phenomena of electrochemical transport, which will increase the battery temperature.
5
The generated heat is maximum as hundreds of cells are serially or parallel connected and battery irregularity and thermal conditions causing the temperature difference between them. The exothermic existence of all of these reactions shows that a battery pack's performance is affected by temperature. The heat is contained within the battery pack if it is not adequately dissipated. The author of Ref. [5] observed that the voltage, electricity, efficiency, and life cycle of a cell are profoundly affected by its operating temperature.
Temperature uniformity significantly affects the health of the battery pack in the long-term. For li-ion batteries, there are two essential items:
First, the working temperature goes above the appropriate temperature limit. Second, the uniformity of the low-temperature contributes to the loss of battery life.
1.2.1 Low Temperature
Operating a lithium-ion battery below the optimal temperature range can cause battery performance reduction, leading to limits in its use in a cold environment. There are many issues with low ambient temperature, such as high resistance to receiving charging, battery life span, and round-trip efficiency. The charger cannot charge the battery pack fast if the battery is working below 5 °C. If the battery is running below 0 °C, it will lose charge, power, acceleration, and driving range. It identified that if the battery is working at a lower ambient temperature over the long-run, the battery dendrites the anode lithium, causing a decline in battery safety. Smart
6
et al. [6] showed that it is tough to charge the battery at its maximum capacity because lithium plating can occur at high charging levels at room temperature. The author already discussed the impact of low-temperatures on battery pack health in previous studies [7,8].
1.2.2 High Temperature
In a vehicle, an entire battery pack typically comprises multiple single cells attached serially or in parallel. Many battery cells can produce a significant amount of heat during the charge and discharge process, allowing temperatures to increase [9]. There are various effects exerted on the battery's performance at the temperature above the optimal, such as self-discharge, power fade, and these could cause the accessible energy to experience enormous losses [10]. It may be even worse when hundreds of cells are bound in series or parallel.
Battery running above the optimal ambient temperature can induce volume swelling, and non-uniform distribution of temperatures affects the batteries thermally and results in various forms of a node. During spirited driving and without conditioning, battery life can be decreased by 2/3 in hot weather conditions [11]. At an operational temperature between 30 °C to 40 °C, the lithium-ion battery life reduces by 60 days per degree of temperature rise [12].
The author of Ref. [13] experimented to determine the influence of temperature and aging time on the Li-ion cells. The results revealed that above the short course of 20
7
weeks at 55 °C, a power decline of 55% was obtained. Several complex reactions occur as batteries are charged/discharged. Electrochemical reactions affect the heat generation rate, and the speed of the electrochemical reactions is further increased by higher temperatures [14]. That is one of the main reasons for batteries' thermal behavior, related to these reactions [15].
For EVs, safety is a concern and a serious problem. In addition to the low high temperature's performance, each module's cell is susceptible to short circuits overheating and extreme ambient temperature. With the advent of fire and explosion, the thermal runway (TR) may occur when the self-healing process is out of control. Besides, the variation in temperature between each cell will lead to a low rate of variable power, decreasing the battery pack's life cycle.
In one study [16], the
author identified that c
harging performance and battery life deteriorates the most quickly due to heat at temperatures above 50 °C.
As the battery temperature increases constantly, heat cannot be extracted in time after the temperature exceeds 80°C thermal runaway will occur [17].Thermal runaway is mostly caused by short-circuiting [18] and overheating [19]. Extreme exothermic reactions occur one after another as the thermal runaway occurs: layer decomposition of solid electrolyte interphase (SEI), adverse electrode-electrolyte reaction, decomposition of electrode-electrolyte, and positive electrode-electrode-electrolyte reaction [20]. E.g., LFP, decomposed SEI layer at 100℃, melting separator, and
8
shrinking at 130℃, allowing the electrodes to have short circuits. With the increasing temperature, the widely used positive electrode material would continue to deteriorate and begin to produce oxygen. The released oxygen and heat during the reaction process cause the fire and explosion for batteries and the thermal runaway occurs at temperatures above 150℃ [21]. Furthermore, a significant quantity of poisonous gas can endanger personal protection with a sudden release of a large amount of energy.
Three factors [22] typically cause a single battery thermal runaway to occur: one is the loss in internal thermal resistance, such as inflammation gas in the battery core, which will significantly increase thermal resistance. (2) The fault of heat generation, such as a short-circuit that results in an uncontrollable generation of heat. (3) The outer convective cooling flaw, such as when in an adiabatic condition, battery heat could not be removed to the outside.
Figure 1. Process of thermal runaway [23].
The characteristics of the particular battery need to be understood to maximize their performance.
9
1.2.3 Advised Temperature Range
Batteries are susceptible to several problems, for example, short circuits and high ambient temperatures leading to battery overheating and failure. Thus, it's vital to design an actual thermal system to regulate a specified range of battery temperature. To obtain the optimal temperature range, many researchers have advised the optimum temperature range. For example, the author of Ref [24] presents that commercial li-ion battery packs achieve optimum performance near room temperature. Pesaran et al. [25]advised the narrow temperature range of 25 ~ 40 °C for lithium-ion batteries, and the desired cell to cell or module to module temperature difference is 5 °C. Authors of [26] present an increase in the temperature difference over 5 °C between the battery pack and a 10% reduction in power. He at al. [27] suggested that a typical temperature range is between 20 °C and 40 °C, and the long-range for lithium-ion batteries is between -10 °C and 50 °C for tolerable operation [28]. Finally, to sum up, at a temperature between 25 °C and 40 °C, lithium-ion batteries work best. In a battery or from module to module, less than 5 °C is the optimal temperature distribution.
1.3 Battery Thermal Management System
They expose high or low temperature, voltages, excessive fast-tracked battery degradation, and battery failure. According to the working environment and conditions, a thermal management system must ensure reliability, performance,
10
battery life, range, and safety to prevent runaway. A thermal management system of the battery pack is also required to provide a reasonable temperature spread.
There are two approaches to decrease the chance of thermal runaway and to boost thermal stability; one is affected by the electrode characteristics, such as electrode material [29], electrolyte [30], and separator [31]. The properties of battery thermal runaway processes vary with the battery material variation [32], and this is far away. Another solution is to apply a thermal system, called a battery thermal management system, to the batteries for a suitable operating environment. Thus, developing an effective BTMS for packs is the only way to avoid thermal runaway in batteries.
BTMS has two main functions: To prolong battery life and improve electrical performance by keeping batteries within an optimal temperature range, having improved safety to prevent thermal runaway.
Moreover, two things are expected in BTMS: Battery temperature should be within the optimal range and to keep the non-uniform temperature within the required range between the cells. BTMS has to be combined with the battery pack.
Furthermore, there are few things to consider before designing the battery pack's thermal management system; What is the proposed system's cost? What is the optimal temperature range? Which kind of heat transfer pattern is appropriate?
11
Which method of cooling is suitable? Direct or Indirect? How much heat removes from the pack?
The factor considered in the analysis includes ease of operation, capital cost, energy efficiency, reliability, and maintenance requirement.
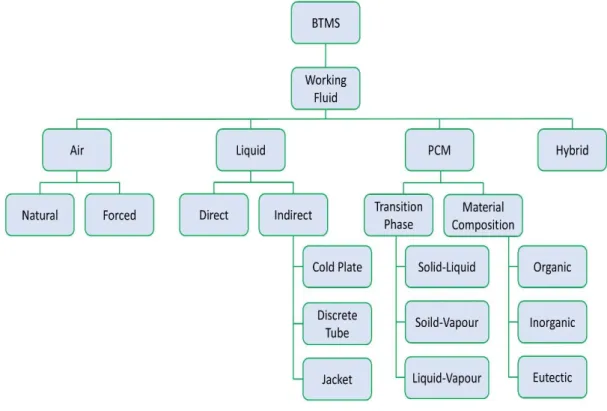
1.3.1 BTMS Selection Based on Medium
Figure 2.Available battery thermal management system according to the medium.
As discussed above, the battery thermal management system keeps narrow temperature bandwidth and prevents thermal runaway potential in extreme temperature conditions.
12
Several methods to quickly extract heat from a battery pack have been evaluated by numerous research groups worldwide in recent years. As seen in Figure 2, they can categorize into several forms. A battery thermal management system can be distinguished by the operating fluid used in the cooling loop.
Some popular BTMS systems are: • Air Cooled
• Liquid Cooled
• Phase change materials (PCM) • Hybrid (Any other)
The air-cooled system can be a natural or forced air cooling system depending on the requirement. The liquid cooling system is divided based on the operating mode; there are two modes: Direct mode and Indirect mode. In the first one, the liquid directly contacts the battery to remove the heat. One example of this system is jacket cooling. This system is usually employed for cylindrical batteries.
On the other hand, in the indirect cooling method, a mini channel, discrete tube, or cold plate is considered to remove the battery's heat by contact surface strategy. Another one is phase change materials based BTMS. As shown by name phase change materials, the PCM cooling method is used to remove the heat. Materials evaporate by the evaporation method and then condensed in the condenser. By evaporation and condensation processes system pulled the heat from the pack.
13
Low thermal conductivity and low specific air capacity make air cooling limited, and the ability to reduce and maintain the temperature is low. PCM is massive, costly, and not eco-friendly. The heat collected by PCM will also need to be extracted by other cooling techniques since a given mass of overall heat capacity is limited [33]. Besides, phase change material's thermal conductivity is low, resulting in poor performance of the system's heat conduction. Heat pipe transfers heat through latent heat as it is in its initial stage of studies.
On the other hand, the higher specific heat power and higher heat exchange efficiency of liquid coolant make it simple than air to satisfy the battery's thermal requirements. The liquid cooling has a more robust heat exchanger capacity than air-cooled BTMS. In addition, because of its higher heat transfer coefficient, a liquid cooling system is more potent in cooling, and less pumping power is needed than the air system. Besides, a suitable battery management system's choice relies on many aspects, such as working efficiency, installation costs, and volumetric constraints. The liquid cooling system has a compact structure that allows taking less volume and narrow space. Due to its high efficiency, simple maintenance, and technological sophistication, liquid cooling is commonly employed.
The author of Ref. [34] studies that a liquid-based thermal management system can minimize power consumption and have a better cooling impact relative to the air-cooling approach. Moreover, it has been employed in commercial electric vehicles, such as BM i3 and i8, Chevrolet Volt, Tesla Model S, Kia Niro, and Hyundai Kona.
14
Liquid cooling maybe 3500 times more efficient or converse up to 40% of parasitic energy than air cooling [35]. Due to the advantages mentioned earlier, the liquid cooling method is considered in this research to cool the battery.
1.3.2 Indirect Cooling Method
The battery's direct contact with the heat transfer fluid might not be feasible in battery packs, considering the high thermal performance of direct-contact mode [36]. Furthermore, it's better to consider an indirect liquid-based system. The lower viscosity of a heat transfer fluid (e.g., ethylene glycol/water) than a dielectric liquid (e.g., mineral oil), resulting in a much higher flow rate for a defined pumping capacity [37]. Thus, passing the fluid through a channel, a metal plate with a cold plate is commonly used in commercial EVs. The performance of an indirect liquid cooling battery pack was evaluated by Chacko et al. [38]. They concluded that one of the most promising ways of achieving battery thermal management would be successful indirect liquid cooling/heating.
1.3.3 Cold Plate
A way of cooling a battery pack is to circulate a liquid coolant via a jacket or separate tubes around it or placing it directly on a liquid-cooled plate. While designing the indirect cooling system, few concerns need to be counted. The cold plate is suitable for prismatic and pouch cells. Jacket cooling is ideal for cylindrical cells. Pouch cells
15
are employed in this study and based on the cell type and volume, and a cold plate is suitable as a way of cooling. The cooling performance of a cold plate depends on many things such as; the diameter of the inlet and outlet of channels, the number of channels, channel shape, the position of the cooling plate, the geometry of the flow path, and flow direction.
Jin et al. [37] presented an ultra-thin cold plate for EV batteries' thermal management, useful in the cooling performance. To enhance the pack's thermal uniformity, Zhao [39] provides two significant promises: shortening the flow paths by increasing the flow channels and increasing the contact area between the battery and the cooling channels. The flow influences the cooling effect for large battery sizes because of the distinct heat generation rate distribution.
The channel's physical dimension, such as its length, width, or path, affects cooling plates' impact. The author of Ref. [40] explored several optimization methods for liquid cooling plate channel quantity, mass flow rate, flow direction, and input size to monitor the difference in maximum temperature and battery temperature.
The structure of liquid cooling makes it simpler, supported by Pesaran et al. [41]. Huo et al. [42] found that the direction of liquid flow, the flow rate, and the number of channels significantly influence the straight cooling channel's cooling effect. They gave recommendations on the number of channels needed for the flow rate. The impact of different serpentine structures on temperature uniformity and the cooling plate's average temperature was studied by [43].
16
The cold plates' cooling performance with serpentine channels was examined by Panchal [44]. The coolant flow paths were identical to the Chevrolet Volt cold plate configuration. The findings revealed that higher discharge rates from 1 coulomb to 4 coulomb and conditions from 5 °C to 35 °C resulted in higher battery temperature contours.
1.4 Objective/Aim
This study aims to evaluate the liquid cooling performance for the thermal management of the battery pack. The main goal is to develop a cooling system that can achieve high efficiency, ease of maintenance, low power consumption, low cost, and reliability by using the indirect liquid cooling technique. In other words, the main focus is to find the optimal values to design the BTMS. A chiller and a radiator with the flow rate variations are used to remove the system's heat. The findings indicate the rise in cooling rate with the increase in flow rate and the chiller capacity and radiator airflow rate. A BTMS that can track, control, maintain, and ensure the battery pack safety is considered. As mentioned above, the literature pays more attention to study the thermal management of the battery pack.
1.5 Thesis Structure
The rest of this dissertation is structured as follows: chapter 2 elaborates the system description, chapter 3 presents the test conditions, chapter 4 discusses the result and
17
discussion, chapter 5 is about comparison and verification of the obtained results, and finally, chapter 6 concludes the study with the benefits, drawbacks, future work and suggestions.
18
Chapter 2 Modeling, Simulation, and System
Description
2.1 Conservation Equations
The continuity equation is:
𝑑𝑚
𝑑𝑡 = ∑ 𝑚̇
𝑏𝑜𝑢𝑛𝑑𝑎𝑟𝑖𝑒𝑠
(1)
Where 𝑚̇ is the boundary mass flux into volume, & 𝑚̇ = pAu, and m = mass of the volume. The energy conservation equation for the explicit solver is:
𝑑(𝑚𝑒) 𝑑𝑡 = −𝑃 𝑑𝑉 𝑑𝑡 + ∑ (𝑚̇𝐻) 𝑏𝑜𝑢𝑛𝑑𝑎𝑟𝑖𝑒𝑠 − ℎ𝐴𝑠 (𝑇𝑓𝑙𝑢𝑖𝑑 − 𝑇𝑤𝑎𝑙𝑙) (2)
While the enthalpy conservation equation for the implicit solver is: 𝑑(𝑝𝐻𝑉)
𝑑𝑡 = ∑ (𝑚𝐻)̇
𝑏𝑜𝑢𝑛𝑑𝑎𝑟𝑖𝑒𝑠
+ 𝑉𝑑𝑝
𝑑𝑡− ℎ𝐴𝑠 (𝑇𝑓𝑙𝑢𝑖𝑑 − 𝑇𝑤𝑎𝑙𝑙) (3)
Where e is the total specific internal energy (internal energy plus kinetic energy per unit mass), P is the pressure, V is the volume, H is the total specific enthalpy, 𝐴𝑠 is the
heat transfer surface area, 𝑇𝑓𝑙𝑢𝑖𝑑 is the temperature of the fluid, and 𝑇𝑤𝑎𝑙𝑙 is the wall
temperature. The momentum conversation equation is:
𝑑𝑚̇ 𝑑𝑡 =
𝑑𝑝𝐴 + ∑𝑏𝑜𝑢𝑛𝑑𝑎𝑟𝑖𝑒𝑠 (𝑚𝑢̇ ) − 4𝐶𝑓 𝑝𝑢|𝑢|2 𝑑𝑥𝐴𝐷 − 𝐾𝑝 (12 𝑝𝑢|𝑢|)𝐴
𝑑𝑥 (4)
Where u is the velocity at the boundary, 𝐶𝑓is Fanning friction factor, 𝑑𝑥 is the length
of the mass element in the flow direction, and 𝑑𝑝 is the pressure differential acting
19
2.2 Required Operating Mode of Thermal System
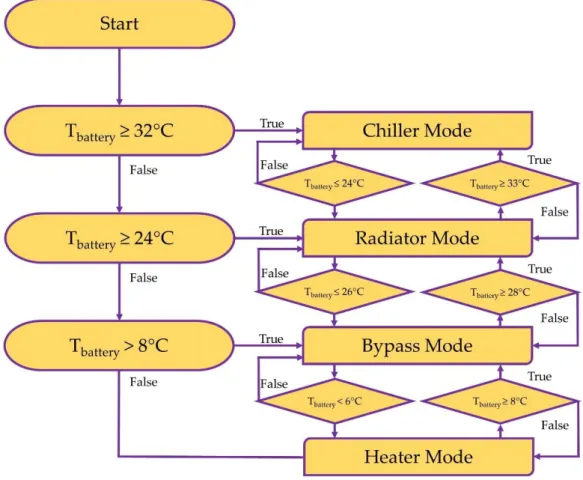
A battery thermal management system is necessary in order to maintain the battery pack within the optimal temperature range. The next question is about the mode; which mode is suitable according to the battery pack's initial temperature. There are many modes to keep the battery temperature within the optimum range, as shown in Figure 3. The selection of operating mode depends on the required temperature. Automatic control techniques are used to change the operating mode as per the instructions.
A chiller mode is required to down the temperature if the battery's initial temperature is above 32 °C. Whereas, if the battery's initial temperature is above 24 °C, a radiator mode is suitable. Besides, if the temperature is in the range of 8 ~ 23 °C, a bypass mode will be applied. Finally, if the temperature is below the 6 °C, a heater mode must maintain the battery pack's optimal temperature range.
20
21
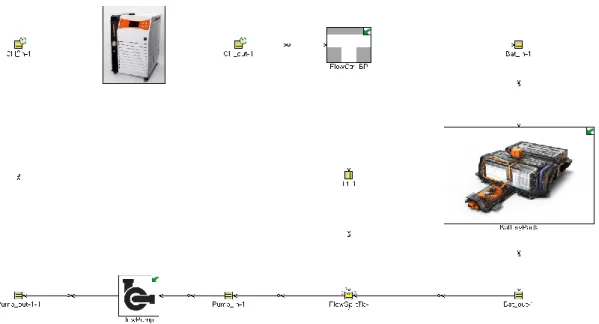
2.2.1 Chiller Mode
The liquid coolant flow is operated by a three-way expansion valve, based on the cooling load and the exterior environment. The chiller mode cycle is straightforward; it consists of a chiller, pump, control valve, and a battery pack. Figure 4 illustrates the chiller cycle used in this study. A mixture of water and ethylene glycol is used as a coolant to remove the battery pack's heat. In the chiller mode, where the battery requires high cooling performance or where the ambient temperature is higher than the liquid coolant temperature, the coolant flows to the chiller to exchange heat. The chiller with three different capacities, 1, 2, and 3 kW, is used in the study. Simultaneously, the coolant flow rate was 5, 10, 20, and 30 LPM.
22
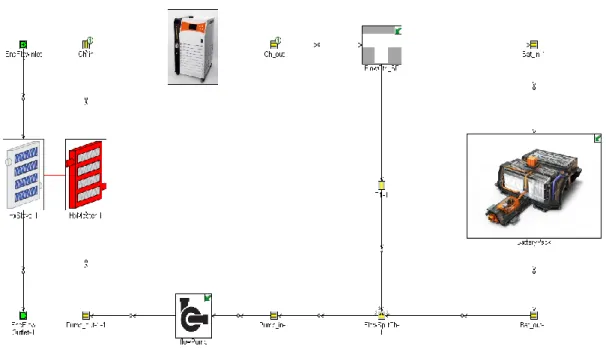
2.2.2 Radiator Mode
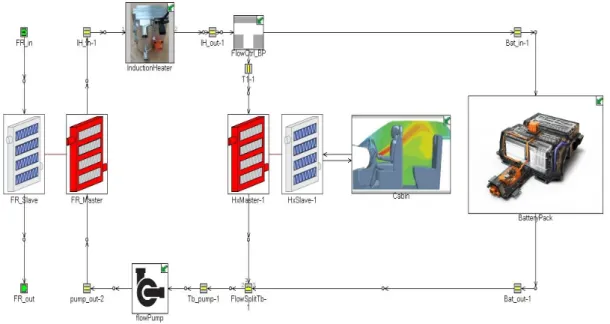
In the radiator mode, a radiator is considered to work as a heat exchanger to remove heat to the environment. The liquid coolant flows to the radiator cooled by the outside air, while the battery requires low cooling performance, and the ambient temperature is lower than the liquid coolant temperature. The chiller is bypassed in this cycle because of less need for the temperature difference. A radiator mode cycle is illustrated in Figure 5. This cycle consists of a battery pack, a pump, a control valve, a radiator, and valves to bypass the coolant. It depends on the ambient temperature of the active region. A fan is also employed to circulate the air through the radiator to enhance the heat transfer coefficient. To evaluate the cycle's cooling rate, the air volume flow rate from 400 to 3600 CMH is considered for coolant flow rate 10 to 30 liters per minute.
23
2.2.3 Heater Mode
An induction heater is employed in the heater mode to warm the coolant to extract the battery pack's heat. Figure 6 demonstrates the heating mode cycle to maintain the required narrow bandwidth in the cold climate region. The author of this study already studied the battery thermal management system's heating system in detail in Ref. [7,8].
24
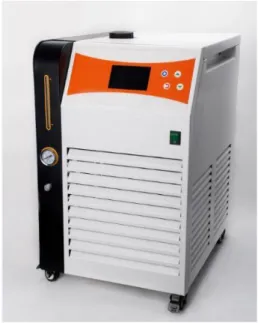
2.3 Chiller
The chiller is the cooling system's central component if the temperature is over 32 °C, which allows the coolant temperature to be further reduced by the refrigerant. A typical chiller diagram is shown in Figure 7. The coolant of a secondary circuit flows through the channels for this reason. The coolant has to be cooled in the chiller to the actual temperature following heat absorption. The temperature drop in the chiller occurs by the refrigerant's evaporation, which circulates in the chiller.
25
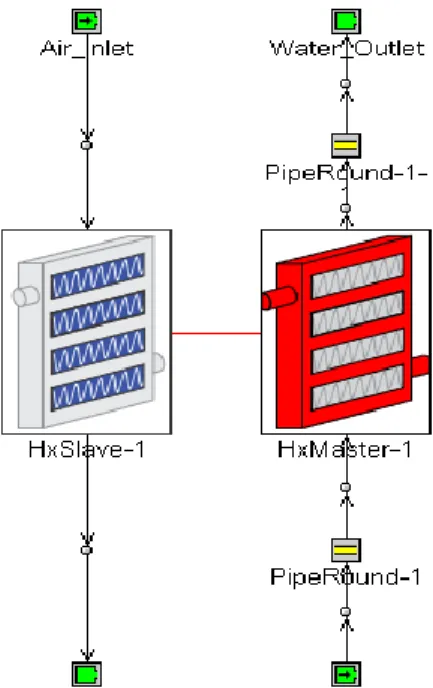
2.4 Radiator
A parallel flow heat exchanger is used as a radiator to transfer the heat to the environment. A radiator simulation diagram is shown in Figure 8.
26
2.5 Battery Pack
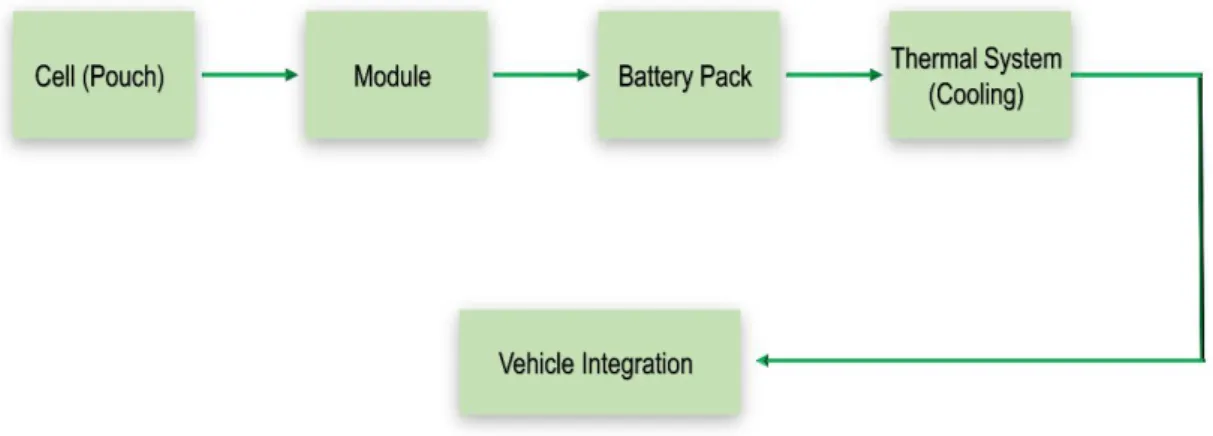
The nucleus of an integral component of the electric vehicle is the battery pack. A Power battery has drawn the bulk of researchers' interest as essential electric vehicle components. A 180 Ah prismatic lithium-ion pouch cell with 300 mm length, 98 mm width, and 14 mm thickness is considered for this study. The picture of the cell is shown in Figure 9. The battery pack consists of 5 modules with a total pack capacity of 64 kWh and a voltage of 356. The battery's position is on the vehicle's floor at the bottom, low the vehicle's center of gravity. The lower gravity significantly increases the vehicles' stability. Also spread across the base is the large battery pack, ensuring structural rigidity against side collisions.
Figure 9. Pouch cell diagram.
Battery length to width ratio is another important factor in the temperature distribution between the cells. A reason for non-uniform temperature distribution
27
between the cells is the ratio of battery length and width [45]. A suitable battery geometry design can produce a uniform distribution within cell-to-cell. A battery pack assembly from cell to vehicle integration is shown in Figure 10.
28
2.6 Cooling System
A combination of water and ethylene glycol is considered as a coolant in this study. The reasons behind choosing the glycol with the water are: firstly, water will solidify if the temperature is lower than 0 °C, and secondly, severe battery damage may occur due to volume expansion of the frozen water. The thermophysical properties of coolants are itemized in Table 1.
Table 1. Operating fluid thermophysical properties
Thermal conductivity 0.3892 W.m-1. K-1
Density 1069 kg.m-3
Kinetic viscosity 2.58 × 10⁻⁶
Specific heat capacity 3323 J.kg-1. K-1
An aluminum-made cold plate is used underneath the battery to cool down the battery pack.The cooling passages in parallel formation are passing through the plate from all directions.
The diameter of the channel is also the primary parameter and should not be too small. If the channel diameter is too small, there will be a more massive pressure drop, and it will exert more load on the pump's energy. Cooling liquid flows into the channels. The distance between the two channels also impacts the uniformity of temperature
29
between the cells. Zhao et al. [42] studied large liquid-cooled lithium-ion battery packs and found that shorter cooling channels would significantly minimize temperature unevenness. Another parameter is the number of channels on a cold plate. If there are fewer channels, it will create a high-pressure drop and bad thermal efficiency. More channels cause higher costs. So, the number of channels should be optimal. Figure 11 displays a different kind of cold plate configuration for battery cooling.
30
The generated heat is transferred to the cold plate, an indirect method through a contact surface. A liquid heat-transfer medium is pumped through the channels. So, coolant comes and around, transferring the heat from the battery cells into the plate. The transferred heat to coolant then exchanges the heating with the chiller or radiator cycle depends on the coolant's initial required temperature. Besides, in terms of the heat transfer rate, a cold plate's cooling performance is determined.
An applicable device is required to energize the coolant. This research uses a small centrifugal pump order to pressurize the coolant. 5 and 30 LPM, respectively, were the lowest and highest flow rates. Meanwhile, the increasing flow rate of cooling liquid caused the pump's energy consumption to increase significantly because the pack itself primarily supplies the battery energy for the cooling system.
31
32
It is energy abuse of the pump when the temperature drop trend decreases with the flow rate increase. An optimal flow rate can be determined by considering the cooling efficiency and power consumption. The power usage by the pump versus the coolant flow rate is presented in Figure 12.
33
Chapter 3 Simulation Setup
This chapter is about analysis setup details. A 45 kWh and 64 kWh rating batteries are considered to evaluate the indirect cooling performance for electric vehicles. To simulate the behavior of the proposed system, a standard simulation tool known as GT-SUITE is utilized. A chiller and radiator are being used to heat transfer between refrigerant and coolant and environment and coolant, respectively. A chiller with several power capacities 1, 2, and 3 kW is considered at the ambient temperature of 25, 30, and 35 °C. A combination of water and ethylene glycol is employed as a coolant in this study. The flow rate is considered between 5 LPM to 30 LPM. The initial battery temperature considered in this study was 30, 35, and 40 °C.
On the other hand, the airflow rate of 400 CMH to 3600 CMH is considered in the radiator cycle to remove heat to the environment. A coefficient of heat transfer evaluates the cooling rate. The heat transfer from fluids within the channels and flow split to their walls is determined using a heat transfer coefficient. The heat transfer coefficient is evaluated from the thermo-physical properties, fluid velocity, and the wall surface's roughness at any point in time. Using the Colburn analog, smooth pipes' heat transfer coefficient is measured using Equation (1).
ℎ
𝑔=
12
𝐶
𝑓𝜌𝑈
𝑒𝑓𝑓𝐶
𝑝𝑃𝑟
−234
Where Cf = fanning smooth pipe friction factor, 𝜌 = density, Uef f= effective velocity
of the outside boundary layer, Cp = specific heat, and Pr = prandtl number.
The Colburn analogy is considered for laminar, transitional, and turbulent flow. In advanced setup-miscellaneous, If the option improved laminar heat transfer model chosen, the heat transfer coefficient is determined from the constant Nusselt number in the laminar scheme. A Nusselt number of 3.66 is used for a Reynolds number less than 2000, and then the heat transfer coefficient is defined using Equation (2):
ℎ
𝑔=
𝑁𝑢.𝑘𝑑 (6)
Where Nu = Nusselt number, k = thermal conductivity, and d = pipe diameter.
The value is interpolated between the constant Nusselt number at Re = 2000 and the value at Re = 4000 from the transformation regime's Colburn analogy. The Colburn analogy is utilized for the turbulent regime above Re = 4000.
The heat transfer rate versus coolant flow rate is investigated at different ambient temperatures and initial battery temperatures. On the other side, in the radiator cycle, the cooling rate is assessed as a flow rate function with varying airflow ratios at an ambient temperature of 25 °C. All the test conditions are listed in Tables 2 and 3, respectively.
35
Table 2. Test Conditions for Cycle using Chiller Chiller Capacity (kW) Flow Rate (LPM) Ambient Temp (°C) Initial Battery Temp (°C) 3 5 10 20 30 25 30 35 40 30 30 35 40 35 30 35 40
Table 3. Test Conditions for Cycle using Radiator Ambient Temp
(°C)
Flow Rate (LPM)
Initial Battery
Temp (°C) Air Flow (CMH)
25 10 20 30 30 35 40 1200 2400 3600
36
Chapter 4 Results and Discussion
4.1 45 kWh Battery Pack
4.1.1 Cooling Cycle using Chiller for 45 kWh Battery Pack
Figure 14. Cooling rate against flow rate at an outside temperature of 25 °C.
Figure 14 illustrates the cooling rate as a flow rate function at an ambient temperature of 25 °C and battery working temperatures of 30, 35, and 40 °C. The outside temperature is an essential parameter in battery thermal management. A chiller having a 3 kW of capacity is considered in this study. It depicts that the cooling rate increases from 5 to 20 LPM before decreasing at 30 LPM. At the initial stage, the
37
cooling rate rose dramatically, followed by 10 LPM. There is a slight increase in the cooling rate from 10 to 20 LPM. After that, the cooling rate dropped a little with the growth of flow rate to 30 LPM. It is clear to see that the maximum cooling rate is 0.0133 °C/sec at 40 °C battery temperature with a flow rate of 20 LPM. In comparison, the minimum is 0.0113 °C/sec at 30 °C of battery temperature with a flow rate of 5 LPM, which shows the impact of ambient temperature and flow rate on the system efficiency.
Figure 15 demonstrates the cooling rate concerning the coolant flow rate at the ambient temperature of 30 °C with the initial battery temperatures of 30, 35, and 40 °C. A chiller with 3 kW of power is employed in this study to cool down the coolant. The ambient temperature is one of the main factors involved in the battery thermal management system's performance. The maximum cooling rate is at initial battery temperature of 40 °C with the flow rate of 20 LPM is 0.0128 °C/sec, and the minimum is 0.0109 °C/sec at battery temperature of 30 °C with the flow rate of 5 LPM; displays the influence of ambient temperature and liters per minutes of flow rate on the overall performance. The overall cooling rate is decreased with the increase in ambient temperature. It reveals a significant increase in the cooling rate from 5 to 10 LPM. After that, the cooling rate slowly increases with the rise in coolant flow rate before a gradual decline followed by the maximum flow rate of 30 LPM.
38
Figure 15. Cooling rate against flow rate at an outside temperature of 30 °C.
Figure 16 presents the cooling rate's influence in terms of coolant flow rate at an ambient temperature of 35 °C with working battery temperatures of 30, 35, and 40 °C. The ambient temperature in this level is the maximum that has been used in this evaluation. The chiller power rating is 3 kW used to remove the heat from the coolant after heat absorption. The overall trend is almost the same as the previous ones but decreased the cooling rate because of increased ambient temperature. The maximum cooling rate found in this level is 0.0123 °C/sec with a flow rate of 20 LPM at 40 °C temperature of the battery pack, and the minimum is 0.0104 °C/sec at initial battery temperature of 30 °C with 5 LPM flow rate.
39
Although a given mass of coolant does have less time to absorb heat when coolant is being pumped in faster, now more coolant is being pumped in by the same factor. The difference is that this coolant mass does not get as hot when it leaves the plate, so it can absorb more heat from the plate per unit time as it flows.
40
4.1.2 Cooling Cycle using Radiator for 45 kWh Battery Pack
Figure 17. Cooling rate versus flow rate at an airflow of 1200 CMH.
Figure 17 presents the cooling rate impact on coolant flow rate at three different initial battery temperatures of 30, 35, and 40 °C. The airflow rate of 1200 cubic meters per hour is considered because it is a radiator cycle where forced air is employed to remove coolant heat to the ambient. The ambient temperature is set to 25 °C. The trend at all three-battery initial temperature is increasing. It is growing slowly to 20 LPM at 30 and 35 °C temperatures of battery pack then almost remained the same with little changes. On the other hand, at 40 °C, the cooling rate increasing rate is more than the different two temperatures, and the cooling rate is maximum at a flow rate of 30 LPM, which is 0.0146 °C/sec.
41
Figure 18 shows the cooling rate between coolant and battery pack against the flow rate of coolant. The considered initial battery temperatures are 30, 35, and 40 °C. Airflow rate of 2400 CMH is also considered because of the radiator using cycle. The coolant is get cooled by the ambient air in the radiator. The ambient temperature set for this level is 25 °C. The trends are showing an increase in cooling rate as a result of an increase in flow rate. With the increase in the coolant flow rate at the ambient temperature of 40 °C, there is a slight increase in the cooling rate. The highest rate in all three ambient temperature trends is 0.0184 °C/sec at 40 °C battery temperature and 30 LPM of flow rate, which shows the flow rate influence on the cooling rate.
42
Figure 19 describes the effect of heat transfer rate against the coolant flow rate at three different initial battery pack temperatures of 30, 35, and 40 °C at an ambient temperature of 25 °C. An airflow rate of 3600 cubic meters per hour is considered because it is a cycle using a radiator. The cooling rate increases significantly at the ambient temperatures of 30 and 35 °C. While at the ambient temperature of 40 °C, the cooling rate rose dramatically to 20 LPM, there is a small rise followed by 30 LPM of flow rate. The maximum cooling rate is 0.0201 °C /sec at 30 LPM of flow rate and 40 °C of ambient temperature.
43
4.2 64 kWh Battery Pack
4.2.1 Cooling Cycle using Chiller for 64 kWh Battery Pack
Figure 20. Impact of cooling rate with flow rate at ambient temperature 25 °C.
Figure 20 refers to the cooling rate as a function of operating fluid flow rate at an ambient temperature of 25 °C and the three different battery pack temperatures of 30, 35, and 40 °C. A chiller rating of 3 kW is employed in this analysis. The results display the fluctuations in the cooling rate at different conditions. For example, the cooling rate jumped to 10 LPM of flow rate at the initial stage. Then, there is a slight increase in the cooling rate before the decline with the same trend towards the flow rate of 30
44
LPM. The optimum cooling rate is at 40 °C with a flow rate of 20 LPM, which is 0.0959 °C/sec.
Figure 21 shows the systems' cooling rate with the coolant flow rate at an ambient temperature of 30 °C with three different initial battery temperatures of 30, 35, and 40 °C. A chiller having a capacity of 3 kW is employed to cool down the coolant temperature. The cooling rate increases between the 5 and 10 LPM of flow rate and decreases to 30 LPM at all different battery pack temperatures. The maximum cooling rate is 0.0092 °C/sec at the initial battery temperature of 40 °C with a 20 LPM flow rate.
45
Figure 22 refers to the cooling rate's impact with the coolant flow rate at three different initial battery pack temperatures of 30, 35, and 40 °C and an ambient temperature of 35 °C. A 3 kW of chiller power is used to remove the heat from the coolant. The trend of cooling rate is almost similar to the last one. The cooling rate rose significantly at the initial flow rate, and then there is a small increase in cooling rate per degree centigrade. After passing from 20 LPM, the cooling rate is decreased, followed by 30 LPM of flow rate.
46
4.2.2 Cooling Cycle using Radiator for 64 kWh Battery Pack
Figure 23 is about the cooling rate against the coolant flow rate at three initial battery pack temperatures of 30, 35, and 40 °C. The airflow rate of 1200 CMH is also considered in this analysis because of the radiator cycle. The ambient temperature was fixed to 25 °C. At 35 °C of temperature, the cooling rate is 0.0062 °C/sec at 10 LPM of flow rate, while at the 30 LPM, the cooling rate is 0.0077, which shows the increase in the with the increase in flow rate. The optimum point of cooling rate is at 40 °C with a flow rate of 30 LPM.
47
Figure 24 illustrates the system's cooling rate against the coolant flow rate at three different initial battery temperatures of 30, 35, 40 °C. The ambient temperature I set to 25 °C. The airflow rate is also considered because of the radiator cycle, which is 2400 cubic meters per hour. The trends show the increase in the cooling rate with the increase in the flow rate. As shown in the Figure, the cooling rate at 40 °C of the initial battery pack with a 20 LPM flow rate is 0.0143 °C/sec, and at 30 LPM, it is 0.0154 °C/sec, which shows the increase in the overall cooling rate.
48
Figure 25. Cooling rate against flow rate at an airflow of 3600 CMH.
Figure 25 demonstrates the heat transfer rate versus the coolant flow rate at three different initial battery pack temperatures. The initial battery temperatures considered for this analysis are 30, 35, and 40 °C. The ambient temperature was also fixed to 25 °C. This analysis is based on the cycle using a radiator to cool down the coolant temperature, so an airflow rate of 3600 CMH is employed. The increasing trend rate is different for battery pack temperatures. Anyhow, the cooling rate increases with the increase in the coolant flow rate. At the 30 and 35 °C temperatures, the increasing trend is almost similar, while at the 40 °C, the cooling rate is increasing dramatically. The cooling rate's optimum value is at 40 °C with a flow rate of 30 LPM, which is 0.0172 °C/sec.
49
Chapter 5 Comparison and Verification
In this chapter, the comparison of 45 kWh and 64 kWh battery packs is made to evaluate an indirect cooling system's performance. Firstly, a comparison made according to a cycle using a chiller to cool down the coolant. The results of both battery packs with the test conditions are demonstrated in Figure 26. For the chiller cycle, results from a chiller capacity of 3 kW at 40 °C initial battery temperature with a flow rate of 20 LPM condition is utilized for battery packs comparison.
50
In the radiator cycle, results from a coolant flow rate of 30 LPM at 25 °C of ambient temperature and 40 °C of initial battery temperature are employed to compare two battery packs, 45 & 64 kWh, respectively. Thus, as shown in the Figure, a 45 kWh rating battery pack maintains a higher cooling rate than 64 kWh. A 45 kWh battery has a cooling rate of 0.01336 °C/sec at 25 °C of ambient temperature, 40 °C of initial battery pack temperature, and 20 LPM of flow rate with a 3 kW chiller capacity. While with the same parameters, the 64 kWh battery pack's cooling rate is 0.00959, which shows the 45 kWh battery pack's efficiency. It is because of the heat generated inside the pack. If there is a need to increase the cooling rate and efficiency of a 64 kWh battery pack, a high rated chiller or more LPM of flow rate is required.
The Figure also compares battery packs for a radiator cycle to determine the optimum values. In this cycle, a radiator is used to remove the heat from the coolant. The cooling rate of a 45 kWh battery pack at an ambient temperature of 25 °C and initial battery temperature of 40 °C with a coolant flow rate of 30 and airflow rate of 3600 CMH is 0.0201 °C/sec. While following the same conditions, this value is 0.0172 °C/sec for the 64 kWh battery pack. The result shows that a 45 kWh battery pack is dominant in terms of performance. To sum up, it is evident that a 45 kWh battery pack is efficient compared to a 64 kWh battery pack in both chiller and radiator cycles.
In one study, Shen & Goa [46] performed a system simulation on refrigerant-based battery thermal management technology for electric vehicles. They used a cold plate to remove the heat from the battery. The initial battery temperature assumption were 31.5, 36.5, & 41.5 °C and found the cooling rate of 0.0121, 0.0191, 0.0263 °C/sec,
51
respectively. On the other hand, in the proposed study, the initial battery temperature is 30, 35, & 40 °C, and the obtained results are 0.0123, 0.0128, and 0.0133 °C/sec, respectively, which show the accuracy of the results.
Figure 27 displays the vehicle's real experimental model to assess the proposed cooling system's performance, similar to the experiment results.
52
53
Chapter 6 Conclusions and Future Work
To maintain the optimal temperature range and the local temperature difference between the cells, an indirect cooling system based on cold plates is proposed in this study. Two different rated battery pack, 45 kWh, and 64 kWh, are considered in this study. The results and discussion about the study are discussed in chapter 3. Herein, to conclude the investigation, this chapter is made to know about the proposed research.
In the chiller cycle, the cooling rate increases with an increase in the fluid flow in but to some extent, after a certain point, there is a decrease in the cooling rate because of coolant pressure and less time to absorb heat. Also, chiller capacity has a substantial effect on the cooling system. In the radiator cycle, the cooling rate increases throughout. There is no decrease in the cooling rate because air is used to cool down the coolant temperature with the various flowrate in this cycle air.
In comparing 45 & 64 kWh battery packs, a 45 kWh rated battery pack is found batter in heat transfer efficiency in both chiller and radiator cycles. In the chiller cycle, a 45 kWh battery pack has a maximum cooling rate of 0.01336 °C/sec at an ambient temperature of 25 °C and an initial battery pack temperature of 40 °C with a coolant flow rate of 20 LPM and 3 kW chiller capacity. On the other hand, a 64 kWh battery back has a maximum cooling rate of 0.00959 °C/sec at the same conditions. In the radiator cycle, a 45 kWh battery pack is again dominant in terms of heat transfer rate.
54
The maximum cooling rate is 0.02012 °C/sec at 25 °C ambient temperature and 40 °C initial battery pack temperature with a coolant flow rate of 30 LPM and an airflow rate of 3600 cubic meters per hour. For a 64 kWh battery pack, the maximum heat transfer rate is 0.01726 °C/sec with the same working conditions. Hence, the numbers proved that a 45 kWh rated battery pack is efficient in both cycles for the battery thermal management system. Finally, a BTMS with 3 kW of chiller capacity and a coolant flow rate of 20 LPM at an ambient temperature of 25°C and 40°C temperature of the battery pack is suggested for the chiller-based cycle. For the radiator-based cycle, a BTMS with an airflow rate of 3600 cubic meters per hour and 30 LPM of coolant flow rate at an ambient temperature of 25°C and 40°C temperature of the battery pack is suggested.
The cooling system has many benefits such as maximum temperature drops, temperature uniformity between the cells, top performance, applicable to all kinds of cells, reduction in noise level, and highly commercialized in the current electric vehicles. In contrast, there are also some drawbacks to the cooling system. For example, the proposed cooling system can potentially leakage, increase the battery pack's weight, high cost, and maintenance.
In terms of benefits, drawbacks, and efficiency of the proposed system, it is concluded that a hybrid system build as a couple of two separate thermal management systems will be a stable, modular system for battery pack thermal management. Another approach to increase the cooling rate is suspending the Nano-sized solid particles (Al,
55
Cu, Ni, Ag, AL2O3, TiO2, & Fe3O4) to increase the thermal conductivity of the coolant, which is beneficial to reduce energy consumption.
56
References
1. IEA 2020 Report. Https://Www.Iea.Org/Reports/Global-Ev-Outlook-2020#integrating-Electric-Vehicles-with-Power-Systems-Can-Benefit-Both. (Accessed Online Nov. 10, 2020).
2. Andersen, P.H.; Mathews, J.A.; Rask, M. Integrating Private Transport into Renewable Energy Policy: The Strategy of Creating Intelligent Recharging Grids
for Electric Vehicles. Energy Policy 2009, 37, 2481–2486,
doi:10.1016/j.enpol.2009.03.032.
3. Budde-Meiwes, H.; Drillkens, J.; Lunz, B.; Muennix, J.; Rothgang, S.; Kowal, J.; Sauer, D.U. A Review of Current Automotive Battery Technology and Future Prospects. Proc. Inst. Mech. Eng. Part J. Automob. Eng. 2013, 227, 761–776, doi:10.1177/0954407013485567.
4. Etacheri, V.; Marom, R.; Elazari, R.; Salitra, G.; Aurbach, D. Challenges in the Development of Advanced Li-Ion Batteries: A Review. Energy Environ. Sci. 2011,
4, 3243, doi:10.1039/c1ee01598b.
5. An, Z.; Jia, L.; Ding, Y.; Dang, C.; Li, X. A Review on Lithium-Ion Power Battery Thermal Management Technologies and Thermal Safety. J. Therm. Sci. 2017, 26, 391–412, doi:10.1007/s11630-017-0955-2.
6. Smart, M.C.; Ratnakumar, B.V.; Whitcanack, L.D.; Chin, K.B.; Surampudi, S.; Croft, H.; Tice, D.; Staniewicz, R. Improved Low-Temperature Performance of Lithium-Ion Cells with Quaternary Carbonate-Based Electrolytes. J. Power
57
7. Raza, W.; Ko, G.S.; Park, Y.C. Induction Heater Based Battery Thermal Management System for Electric Vehicles. Energies 2020, 13, 5711, doi:10.3390/en13215711.
8. Raza, W.; Ko, G.S.; Park, Y.C. Performance Evaluation of Battery Thermal Management System in Electric Vehicle Using Induction Heater (Part 1: Parallel
System). Int. J. Air-Cond. Refrig. 2020, 28, 2050003,
doi:10.1142/S2010132520500030.
9. Guo, L.S.; Wang, Z.R.; Wang, J.H.; Luo, Q.K.; Liu, J.J. Effects of the Environmental Temperature and Heat Dissipation Condition on the Thermal Runaway of Lithium Ion Batteries during the Charge-Discharge Process. J. Loss
Prev. Process Ind. 2017, 49, 953–960, doi:10.1016/j.jlp.2017.05.029.
10. Wright, R.B.; Christophersen, J.P.; Motloch, C.G.; Belt, J.R.; Ho, C.D.; Battaglia, V.S.; Barnes, J.A.; Duong, T.Q.; Sutula, R.A. Power Fade and Capacity Fade Resulting from Cycle-Life Testing of Advanced Technology Development Program Lithium-Ion Batteries. J. Power Sources 2003, 119–121, 865–869, doi:10.1016/S0378-7753(03)00190-3.
11. Yuksel, T.; Litster, S.; Viswanathan, V.; Michalek, J.J. Plug-in Hybrid Electric Vehicle LiFePO4 Battery Life Implications of Thermal Management, Driving Conditions, and Regional Climate. J. Power Sources 2017, 338, 49–64, doi:10.1016/j.jpowsour.2016.10.104.
12. Selman, J.R.; Al Hallaj, S.; Uchida, I.; Hirano, Y. Cooperative Research on Safety Fundamentals of Lithium Batteries. J. Power Sources 2001, 97–98, 726–732, doi:10.1016/S0378-7753(01)00732-7.
58
13. Thomas, E.V.; Case, H.L.; Doughty, D.H.; Jungst, R.G.; Nagasubramanian, G.; Roth, E.P. Accelerated Power Degradation of Li-Ion Cells. J. Power Sources 2003,
124, 254–260, doi:10.1016/S0378-7753(03)00729-8.
14. Lundgren, H.; Svens, P.; Ekström, H.; Tengstedt, C.; Lindström, J.; Behm, M.; Lindbergh, G. Thermal Management of Large-Format Prismatic Lithium-Ion Battery in PHEV Application. J. Electrochem. Soc. 2016, 163, A309–A317, doi:10.1149/2.09411602jes.
15. Vazquez-Arenas, J.; Gimenez, L.E.; Fowler, M.; Han, T.; Chen, S. A Rapid Estimation and Sensitivity Analysis of Parameters Describing the Behavior of Commercial Li-Ion Batteries Including Thermal Analysis. Energy Convers. Manag.
2014, 87, 472–482, doi:10.1016/j.enconman.2014.06.076.
16. Qiao, S.; Hu, M.; Fu, C.; Qin, D.; Zhou, A.; Wang, P.; Lin, F. Experimental Study on Storage and Maintenance Method of Ni-MH Battery Modules for Hybrid Electric Vehicles. Appl. Sci. 2019, 9, 1742, doi:10.3390/app9091742.
17. Wang, Q.; Ping, P.; Zhao, X.; Chu, G.; Sun, J.; Chen, C. Thermal Runaway Caused Fire and Explosion of Lithium Ion Battery. J. Power Sources 2012, 208, 210–224, doi:10.1016/j.jpowsour.2012.02.038.
18. Lamb, J.; Orendorff, C.J. Evaluation of Mechanical Abuse Techniques in Lithium
Ion Batteries. J. Power Sources 2014, 247, 189–196,
doi:10.1016/j.jpowsour.2013.08.066.
19. Zhu, J.; Wierzbicki, T.; Li, W. A Review of Safety-Focused Mechanical Modeling of Commercial Lithium-Ion Batteries. J. Power Sources 2018, 378, 153–168, doi:10.1016/j.jpowsour.2017.12.034.
59
20. Röder, P.; Baba, N.; Wiemhöfer, H.-D. A Detailed Thermal Study of a Li[Ni0.33Co0.33Mn0.33]O2/LiMn2O4-Based Lithium Ion Cell by Accelerating Rate and Differential Scanning Calorimetry. J. Power Sources 2014, 248, 978–987, doi:10.1016/j.jpowsour.2013.09.146.
21. Guo, G.; Long, B.; Cheng, B.; Zhou, S.; Xu, P.; Cao, B. Three-Dimensional Thermal Finite Element Modeling of Lithium-Ion Battery in Thermal Abuse
Application. J. Power Sources 2010, 195, 2393–2398,
doi:10.1016/j.jpowsour.2009.10.090.
22. Dey, S.; Biron, Z.A.; Tatipamula, S.; Das, N.; Mohon, S.; Ayalew, B.; Pisu, P. Model-Based Real-Time Thermal Fault Diagnosis of Lithium-Ion Batteries.
Control Eng. Pract. 2016, 56, 37–48, doi:10.1016/j.conengprac.2016.08.002.
23. Ross, P.E. Boeing's Battery Blues [News]. IEEE Spectr. 2013, 50, 11–12, doi:10.1109/MSPEC.2013.6471040.
24. Basu, S.; Hariharan, K.S.; Kolake, S.M.; Song, T.; Sohn, D.K.; Yeo, T. Coupled Electrochemical Thermal Modelling of a Novel Li-Ion Battery Pack Thermal
Management System. Appl. Energy 2016, 181, 1–13,
doi:10.1016/j.apenergy.2016.08.049.
25. Pesaran, A.A.; Keyser, M. Thermal Characteristics of Selected EV and HEV Batteries. In Proceedings of the Sixteenth Annual Battery Conference on Applications and Advances. Proceedings of the Conference (Cat. No.01TH8533); IEEE: Long Beach, CA, USA, 2001; pp. 219–225.
26. Feng, X.; Xu, C.; He, X.; Wang, L.; Zhang, G.; Ouyang, M. Mechanisms for the Evolution of Cell Variations within a LiNixCoyMnzO2/Graphite Lithium-Ion
![Figure 1. Process of thermal runaway [23] .](https://thumb-ap.123doks.com/thumbv2/123dokinfo/4743448.12780/22.892.212.754.727.965/figure-process-thermal-runaway.webp)