Background/Aims: 18F-fluorodeoxyglucose-positron
emis-sion tomography (18F-FDG-PET) reflects biological
aggressive-ness and predicts prognoses in various tumors. Evaluating the oncologic significance of the preoperative metabolic phe-notype might be necessary for planning the surgical strategy in resectable pancreatic cancers. Methods: From January 2010 to December 2015, a total of 93 patients with patho-logic T3 (pT3) pancreatic cancer were included in this study. Clinicopathological parameters and PET parameters were evaluated, and transcriptome-wide analysis was performed to identify the oncologic impact and molecular landscape of the metabolic phenotype of resectable pancreatic cancers. Results: Preoperative metabolic tumor volume (MTV)2.5 was
significantly higher in the pN1 group compared to the pN0 group (11.1±11.2 vs 6.5±7.8, p=0.031). Higher MTV2.5
val-ues (MTV2.5 ≥4.5) were associated with multiple lymph node
metastasis (p=0.003), and the lymph node ratio was also significantly higher in resected pT3 pancreatic cancer with MTV2.5 ≥4.5 compared to those with MTV2.5 <4.5 (0.12±0.13
vs 0.05±0.08, p=0.001). Disease-specific survival of pa-tients with MTV2.5 <4.5 was better than that of patients with
MTV2.5 ≥4.5 (mean, 28.8 months; 95% confidence interval
[CI], 40.1 to 57.0 vs mean, 32.6 months; 95% CI, 25.5 to 39.7; p=0.026). Patients with MTV2.5 ≥4.5 who received
postoperative adjuvant chemotherapy showed better survival outcomes than patients with MTV2.5 ≥4.5 who did not receive
adjuvant treatment in resected pT3 pancreatic cancers (p<0.001). Transcriptome-wide analysis revealed that tumors
with MTV2.5 ≥4.5 demonstrated significantly different
expres-sion of cancer-related genes reflecting aggressive tumor biol-ogy. Conclusions: Resectable pancreatic cancer with high MTV2.5 is not only associated with lymph node metastasis but
also early systemic metastasis. The molecular background of resectable pancreatic cancer with high MTV2.5 may be
as-sociated with aggressive biologic behavior, which might need to be considered when managing resectable pancreatic can-cers. Further study is mandatory. (Gut Liver 2019;13:356-365)
Key Words: Pancreatic neoplasms; Positron-emission tomog-raphy; Metabolic phenotype; Transcriptome-wide analysis
INTRODUCTION
In the early 1920s, Otto Warburg reported that cancer cells preferentially metabolize glucose by “aerobic glycolysis,” even
in the presence of ample oxygen.1 The increased glucose
de-mand has been considered one of the fundamental features of cancer and has become the foundation of the clinical
applica-tion of 18
F-fluorodeoxyglucose-positron emission tomography
(18F-FDG-PET) in oncology.2 Cancer cells show an increased
up-take of glucose and FDG.2
Both glucose and FDG are phosphor-ylated by hexokinase (HK) to prevent their release from cancer cells. In contrast to glucose, FDG cannot be further metabolized due to the lack of the 2’-OH group, resulting in its accumulation
in cells proportional to the amount of uptake and HK activity.3
FDG-PET has emerged as an important clinical tool for cancer detection and staging and the monitoring of the response of
cancer to therapy.4 However, there are some important critiques
This is an Open Access article distributed under the terms of the Creative Commons Attribution Non-Commercial License (http://creativecommons.org/licenses/by-nc/4.0) which permits unrestricted non-commercial use, distribution, and reproduction in any medium, provided the original work is properly cited.
Preoperative Metabolic Tumor Volume
2.5Associated with Early Systemic
Metastasis in Resected Pancreatic Cancer: A Transcriptome-Wide Analysis
Sung Hwan Lee1,2, Ho Kyoung Hwang2,3, Woo Jung Lee2,3, Mijin Yun3,4, and Chang Moo Kang2,3
1Department of Systems Biology, University of Texas MD Anderson Cancer Center, Houston, TX, USA, 2Division of Hepatobiliary and
Pancreatic Surgery, Department of Surgery, Yonsei University College of Medicine, 3Pancreatobiliary Cancer Center, Yonsei Cancer Center,
Severance Hospital, and 4Department of Nuclear Medicine, Yonsei University College of Medicine, Seoul, Korea
See editorial on page 225.
Received 는
Date Submitted 날짜로 수정일은 마지막 날짜로 논평은 전부 삭제
Correspondence to: Chang Moo Kang (https://orcid.org/0000-0002-5382-4658)a
and Mijin Yun (https://orcid.org/0000-0002-1712-163X)b a
Department of Surgery, Yonsei University College of Medicine, 50-1 Yonsei-ro, Seodaemun-gu, Seoul 03722, Korea Tel: +82-2-2228-2100, Fax: +82-2-313-8289, E-mail: [email protected]
b
Department of Nuclear Medicine, Yonsei University College of Medicine, 50-1 Yonsei-ro, Seodaemun-gu, Seoul 03722, Korea Tel: +82-2-2228-6068, Fax: +82-2-312-0578, E-mail: [email protected]
Received on May 28, 2018. Revised on September 19, 2018. Accepted on October 1, 2018. Published online March 15, 2019 pISSN 1976-2283 eISSN 2005-1212 https://doi.org/10.5009/gnl18242
1월 January 2월 February 3월 March 4월 April 5월 May 6월 June 7월 July 8월 August 9월 September 10월 October 11월 November 12월 December
of the routine use of FDG-PET in clinical oncology. It has been observed that FDG-PET is not more effective than conventional imaging technology at detecting early pancreatic cancer and
small metastatic lesions.5 In addition, FDG-PET is not able to
discriminate the oncologic process of pancreatic cancer from
in-flammatory focal lesions including mass-forming pancreatitis.6
However, with the clinical experiences of using FDG-PET in patients with pancreatic cancer, recent studies have suggested that the characteristics of preoperative FDG-PET images are
strongly associated with aspects of tumor biology,7 such as the
pathological grade,8 recurrence,9 distant metastasis,10 and
long-term oncologic outcomes.11 Several parameters for FDG-PET are
being developed to measure the metabolism of cancer lesions and to predict aspects of tumor biology and the resultant on-cologic outcomes. Unlike the maximum standard uptake value (SUVmax), which reflects the metabolic activity of a single pixel, the metabolic tumor volume (MTV) and total lesion glycolysis (TLG) can measure the volume-based metabolic activity of the
entire tumor lesion.11 In our previous study, the results of the
propensity score-matched analysis demonstrated that preopera-tive MTV2.5 greater than 4.5 can predict tumor recurrence and
long-term survival in patients with resected pancreatic cancer.12
In addition, it was shown that high FDG uptake in left-sided pancreatic cancer is strongly associated with loss of SMAD4,
subsequently resulting in early systemic metastasis.13 From the
viewpoint of the American Joint Committee on Cancer (AJCC) 7th cancer staging system, pathologic T3 (pT3) lesions are the most common type of resected pancreatic cancer, regardless of
the tumor size.14 Therefore, small proportions of T1 and T2 are
potential confounding factors in the analysis of the oncologic impact of PET/computed tomography (CT)-related parameters in patients with resected pancreatic cancer.
In this study, we focused on patients who underwent po-tentially curative pancreatectomy for pT3 pancreatic cancer without neoadjuvant treatment. We determined the value of MTV2.5 in predicting the oncologic outcome of resected pancre-atic cancer, and investigated the differences in gene expression in patients with pT3 pancreatic cancer to explain the different oncologic outcomes according to the value of MTV2.5. This ap-proach may be a basis for a patient-oriented surgical apap-proach to the treatment of resectable pancreatic cancer in the near fu-ture.
MATERIALS AND METHODS
1. Study period and populationFrom January 2010 to December 2015, 232 patients under-went potentially curative pancreatectomy for pancreatic cancers in Yonsei University Severance Hospital, Seoul, Korea. Of those 232 patients, 93 patients with pT3 pancreatic cancer (AJCC 7th) without neoadjuvant treatment who had undergone preopera-tive PET/CT imaging were included in this investigation. This
study protocol was approved by the Institutional Review Board of Severance Hospital with the waiver of informed consent due to retrospective study (IRB number: 4-2017-0657).
2. Clinicopathological parameters
We retrospectively reviewed the medical records of the pa-tients, and collected information, such as gender, age, tumor location, operation type, tumor size, tumor grade (differentia-tion), pathologic tumor (pT) stage, presence of lymph node me-tastasis, lymph node ratio (the total number of metastatic lymph nodes divided by the total number of retrieved lymph nodes), the presence of microscopic perineural invasion, the presence of lymphovascular invasion, the recurrence pattern, and the time to recurrence, which was defined as the time from surgical resection to recurrence or the last clinical follow-up visit at our medical center.
3. PET/CT protocol and PET-related parameters
18F-FDG PET/CT scans were performed with the same protocol
described in our previous study.12 The SUVmax and MTV2.5 were
measured on PET images using volume viewer software. Each tumor was examined with a spherical-shaped volume of interest (VOI) that included the entire lesion in the axial, sagittal, and
coronal planes. By using CT images, the 18F-FDG uptake values
of normal organs such as the bowel, stomach, and liver were not included in the VOI. The SUVmax of the VOI was calculated as (decay-corrected activity/tissue volume)/(injected dose/body weight). MTV2.5 was defined as the total tumor volume with an SUV ≥2.5, and the MTV and mean SUV of the VOI were auto-matically calculated. The tumor to liver ratio (TLG) was calcu-lated as (mean SUV) × (MTV). In patients with SUVmax <2.5, the MTV2.5 and TLG were not measured. The TLG was calculated as the SUVmax/SUVmean of the liver parenchyma to adjust the values of different PET scanners.
4. Sample preparation
In total, six tumor samples from each pancreatic cancer pa-tient were used for the transcriptomics study. Three samples were randomly selected from both the MTV high (MTV2.5 ≥4.5) group and the MTV low (MTV2.5 <4.5) group. Total RNA was extracted from each formalin-fixed paraffin-embedded sample using the TRIzol reagent (Molecular Research Center, Inc., Cin-cinnati, OH, USA) according to the manufacturer’s instructions. Following homogenization, 1 mL of solution was transferred to a 1.5-mL Eppendorf tube and centrifuged at 12,000 g for 10 minutes at 4°C to remove any insoluble material. The super-natant containing the RNA was collected, mixed with 0.2 mL of chloroform, and centrifuged at 12,000 g for 15 minutes at 4°C. After nucleic acids in the aqueous phase were transferred to a new tube, the RNA was precipitated by adding 0.5 mL of isopropyl alcohol and then recovered by centrifuging the tube at 12,000 g for 10 minutes at 4°C. The RNA pellet was washed
briefly in 1 mL of 75% ethanol and centrifuged at 7,500 g for 5 minutes at 4°C. Finally, the total RNA pellet was dissolved in nuclease-free water, and its quality and quantity were as-sessed on an Agilent Bioanalyzer 2100. Gene expression was
analyzed with the GeneChip®
Human Genome U133 Plus 2.0 Array (Affymetrix, Santa Clara, CA, USA), which is composed of over 45,000 probe sets representing approximately 38,500 well-characterized human genes. For each gene, eleven pairs of oligonucleotide probes are synthesized in situ on the arrays.
5. Microarray
Biotinylated cRNA was prepared according to the standard Affymetrix protocol from 200 ng of total RNA (Expression Analysis Technical Manual, 2001; Affymetrix). Following frag-mentation, 3 µg of RNA were hybridized for 16 hours at 45°C
on the GeneChip® Human Genome Array. The GeneChip® was
washed and stained in the Affymetrix Fluidics Station 450.
The GeneChip® was scanned using the Affymetrix GeneChip®
Scanner 3000 7G. The data were analyzed with Robust Mul-tichip Analysis using the Affymetrix default analysis settings and global scaling as the normalization method. The trimmed
mean target intensity of each array was arbitrarily set to 100. The normalized and log transformed intensity values were then analyzed using GeneSpring GX 12.6.1 (Agilent Technologies, Santa Clara, CA, USA). Fold change filters included the require-ment that the genes be present in at least 150% of the controls for upregulated genes and fewer than 66% of the controls for downregulated genes. Through hierarchical clustering, data were clustered into groups that behaved similarly across experi-ments using GeneSpring GX 12.6.1 (Agilent Technologies). The clustering algorithm used the Euclidean distance with average linkage.
6. Transcriptomics data analysis
The transcriptomics data obtained from the Affymetrix U133 Plus 2.0 Arrays were used for the calculation of the fold ratio and p-value of gene expression levels between MTV2.5 high and MTV2.5 low tumor samples. Genes showing significantly dif-ferential expression between MTV2.5 high and MTV2.5 low tumor samples were selected and included in an integrative analysis with ingenuity pathway analysis software (Qiagen Inc., Valen-cia, CA, USA). The comprehensive analyses for canonical
path-T umor size (cm) 0.01 0.02 0.05 0.1 0.2 0.5 1 2 5 10 20 50 10.0 8.0 7.0 6.0 5.0 4.0 3.5 3.0 2.5 2.0 1.75 1.5 1.2 1.0
A
MTV2.5 No Yes Nodal metastasis MT V2. 5B
No Yes 0 30 25 20 15 10 5 Nodal metastasis T umor size No Yes 5 4 3 2 1 Nodal metastasis Disease-free survival 20 40 60 1.0 0.8 0.6 0.4 0.2 0C
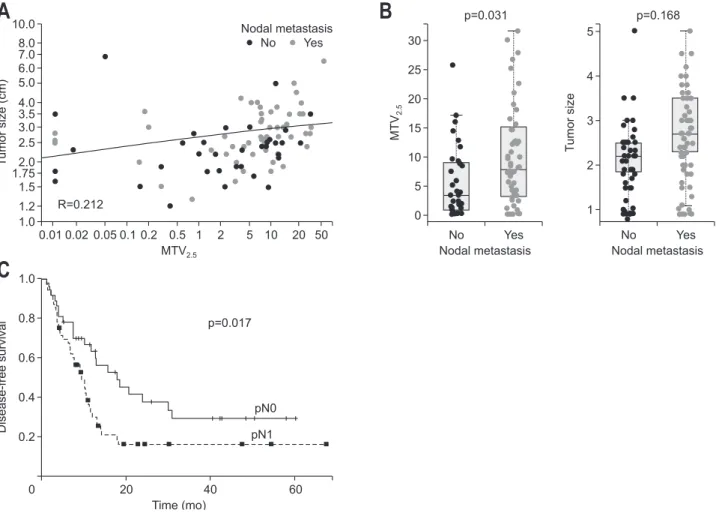
Time (mo) R=0.212 pN0 pN1 p=0.017 p=0.031 p=0.168Fig. 1. Tumor size and MTV2.5 for nodal metastasis. (A) Correlation analysis for tumor size and MTV2.5. (B) Comparison of the difference in tumor
size and MTV2.5 according to nodal metastasis. (C) The oncologic outcome of lymph node metastasis in resected pT3 pancreatic cancer.
ways, upstream elements, diseases and functions, and regulatory effects were performed.
7. Statistics
Continuous variables were described as the means±standard deviation, and categorical variables were described as frequen-cies (%). The Student t-test, chi-squared tests with Fisher exact tests, and linear regression analyses were performed. The Pear-son correlation method was used to calculate the correlation coefficients. Survival curves were estimated using the Kaplan-Meier method to calculate the cumulative recurrence-free sur-vival rates. Statistical analyses were performed using SPSS 20.0 for Windows (IBM Corp., Armonk, NY, USA). p-values <0.05 were considered statistically significant.
RESULTS
1. Characteristics of patients with resected pT3 pancreatic cancer
From January 2010 to December 2015, 232 patients under-went radical resection for pancreatic cancer. The final study population was 93 patients after excluding the patients who underwent neoadjuvant treatment or palliative resection. The mean age of the study population was 63.6±9.4 years; 53 (57%) were males, and 40 (43%) were females.
2. Oncologic outcome of lymph node metastasis in patients with resected pT3 pancreatic cancer
Among the clinically available pathologic variables, such as the tumor size, degree of differentiation, presence of lympho-vascular invasion, presence of perineural invasion, presence of lymph node metastasis, and resection margin, the Cox propor-tional hazard model showed that lymph node metastasis was the strongest prognostic factor predicting tumor recurrence (Exp(β)=1.868, p=0.019). There was a significant difference in disease-free survival (DFS) according to the pN stage (mean,
26.7 months; 95% CI, 18.5 to 34.8 vs mean, 17.7 months; 95% CI, 11.4 to 24.0; p=0.017) (Fig. 1C).
3. Preoperative detectable clinical parameter to predict lymph node metastasis in patients with resected pT3 pancreatic cancer
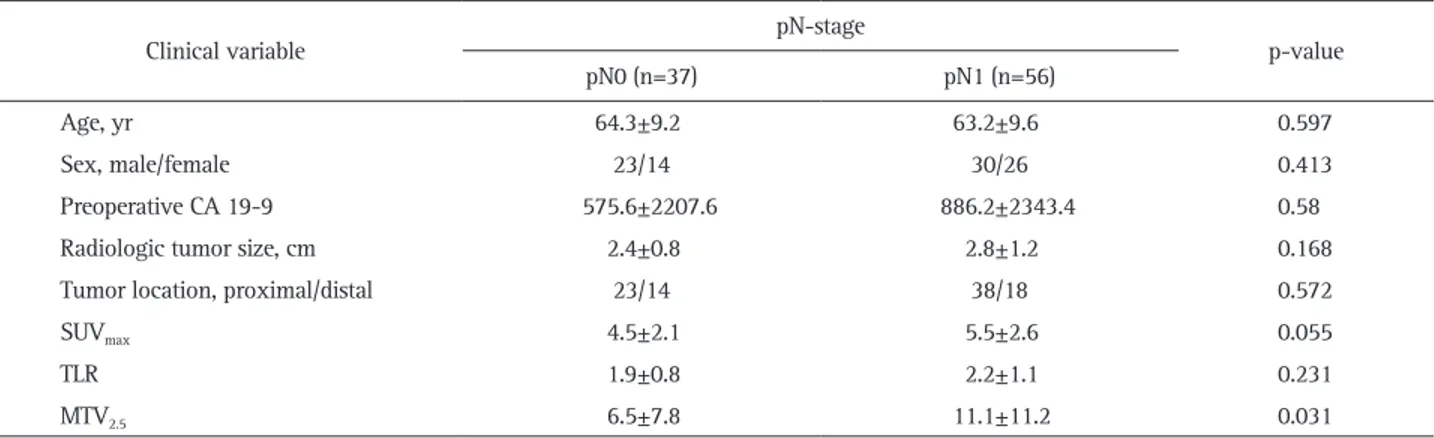
Only the value of preoperative MTV2.5 was significantly higher in patients with pN1 than in other patients (6.5±7.8 vs 11.1±11.2, p=0.031). SUVmax was also marginally significantly different between the two groups; however, when adjusted by the SUVmean of the liver (tumor to liver ratio), there was no significant difference between two groups (1.9±0.8 vs 2.2±1.1, p=0.231) (Table 1).
4. Preoperative MTV2.5 ≥4.5 is significantly associated with lymph node metastasis in patients with resected pT3 pancreatic cancer
The previously determined preoperative PET parameter12 of a
Table 1. Preoperatively Available Parameters to Predict Lymph Node Metastasis in Resected pT3 Pancreatic Cancer
Clinical variable pN-stage p-value
pN0 (n=37) pN1 (n=56)
Age, yr 64.3±9.2 63.2±9.6 0.597
Sex, male/female 23/14 30/26 0.413
Preoperative CA 19-9 575.6±2207.6 886.2±2343.4 0.58
Radiologic tumor size, cm 2.4±0.8 2.8±1.2 0.168
Tumor location, proximal/distal 23/14 38/18 0.572
SUVmax 4.5±2.1 5.5±2.6 0.055
TLR 1.9±0.8 2.2±1.1 0.231
MTV2.5 6.5±7.8 11.1±11.2 0.031
Data are presented as mean±SD or number.
pT3, pathologic T3; SUVmax, maximum standard uptake value; TLR, tumor to liver ratio; MTV, metabolic tumor volume.
Table 2. Preoperative Positron Emission Tomography Parameters to Predict Pathologic Outcomes in Resected pT3 Pancreatic Cancer
Pathological variable MTV2.5 p-value <4.5 ≥4.5 pN-stage 0.019 pN0 21 18 pN1 16 38 Retrieved LNs 19.3±9.4 19.9±10.9 0.76 Metastatic LNs 0.003 0 21 14 1 10 15 ≥2 8 25 LNR 0.05±0.08 0.12±0.13 0.001
Data are presented as number or mean±SD.
pT3, pathologic T3; MTV, metabolic tumor volume; LN, lymph node; LNR, lymph node ratio.
value of MTV2.5≥4.5 was again found to have a close relation-ship with lymph node metastasis in patients with resected pT3 pancreatic cancer (p=0.019). In addition, higher MTV2.5 values (MTV2.5≥4.5) in patients with pancreatic cancer was found to be associated with metastasis to multiple lymph nodes (chi-square, linear-to-linear association, p=0.003), and the lymph node ra-tio was also significantly higher in patients with resected pT3-pancreatic cancer with MTV2.5 ≥4.5 than in those with MTV2.5 <4.5 (0.05±0.08 vs 0.12±0.13, p=0.001) (Table 2).
5. Association between MTV2.5 and tumor size according to nodal metastasis
To elucidate the confounding effect of tumor size on MTV2.5, a correlation analysis and statistical comparisons of tumor size and MTV2.5 according to nodal metastasis were performed. There was no marked correlation (Pearson correlation coeffi-cient=0.212) between MTV2.5 and tumor size (Fig. 1A). Though the difference in tumor size according to nodal metastasis was not statistically significant (p=0.168), the value of MTV2.5 was significantly higher in the nodal metastasis group than in the group without nodal metastasis (p=0.031) (Fig. 1B).
6. Preoperative MTV2.5 ≥4.5 is significantly associated with early systemic metastasis in patients with resected pT3 pancreatic cancer
Among the 93 patients with resected pT3 pancreatic cancer, 28 patients (30.1%) experienced early (<6 months after sur-gery) systemic recurrence. The mean time interval from radi-cal pancreatectomy to early systemic recurrence was 3.9±2.6 months. The most frequent distant metastatic site was found to be the liver (16/28, 57.1%). pN stage could not predict early systemic recurrence in patients with resected pT3 pancreatic cancer (p=0.146) (Fig. 2A). A lymph node ratio cutoff value of 0.07 was shown to determine early systemic recurrence with a
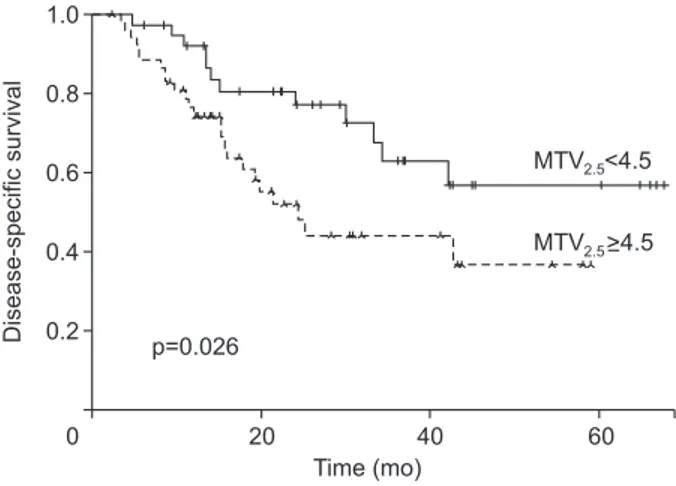
sensitivity of 60.7% and a specificity of 71.5%. The same cutoff value could discriminate those with early systemic metastasis from those without with marginal significance in patients with resected pT3 pancreatic cancer (p=0.078). However, significantly more patients with MTV2.5 ≥4.5 than those with MTV2.5 <4.5 had early systemic recurrence after initial radical pancreatectomy (p=0.008) (Fig. 2B). Subsequently, the disease-specific survival of the patients with MTV2.5 <4.5 was much better than those with MTV2.5 ≥4.5 (mean, 28.8 months; 95% CI, 40.1 to 57.0 vs mean, 32.6 months; 95% CI, 25.5 to 39.7; p=0.026) (Fig. 3).
7. Postoperative adjuvant chemotherapy attenuates the adverse oncologic impact of MTV2.5 ≥4.5 in patients with resected pT3 pancreatic cancer
Approximately 80% of patients who underwent curative resection received adjuvant treatment based on gemcitabine or fluorouracil (5-FU). Among them, approximately 15% of
pa-B
A
Early systemic-recurrence-free survival 1.0 0.8 0.6 0.4 0.2 0 Time (mo) pN0 pN1 p=0.146 Early systemic-survival recurrence-free 1.0 0.8 0.6 0.4 0.2 0 Time (mo) MTV2.5<4.5 p=0.008 MTV2.5>4.5 1 2 3 4 5 6 1 2 3 4 5 6Fig. 2. Preoperative MTV2.5 parameter and early systemic metastasis in resected pT3 pancreatic cancer. (A) Early systemic recurrence-free survival
according to nodal metastasis. (B) Early systemic recurrence-free survival according to MTV2.5 value.
MTV, metabolic tumor volume; pT3, pathologic T3.
Disease-specific survival 20 40 60 1.0 0.8 0.6 0.4 0.2 0 Time (mo) MTV <4.5 p=0.026 >4.5 2.5 2.5 MTV
Fig. 3. Disease-specific survival according to the preoperative MTV2.5
parameter in resected pT3 pancreatic cancer. MTV, metabolic tumor volume; pT3, pathologic T3.
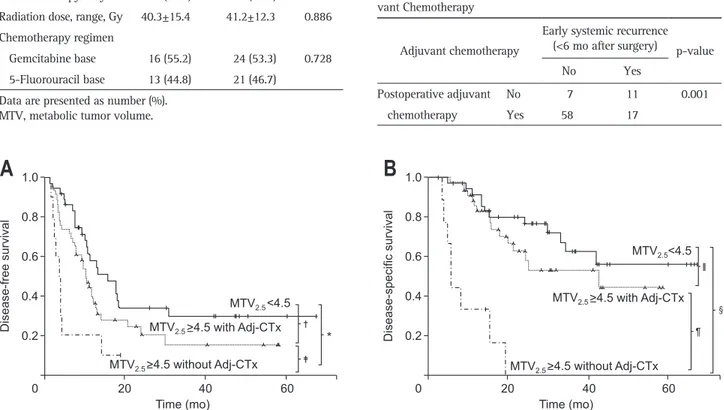
tients who received adjuvant treatment after surgery underwent chemotherapy with radiation therapy. There was no significant difference in the proportion of patients receiving adjuvant treat-ment according to the level of MTV2.5 (Table 3). Postoperative adjuvant chemotherapy could modify the oncologic outcome of patients with resected pT3 pancreatic cancer. There was no sig-nificant difference in the oncologic outcomes (log-rank p=0.352 in DFS, p=0.142 in overall survival) between patients who re-ceived adjuvant treatment and those who did not in the MTV2.5 low group (MTV2.5 <4.5). However, among patients with MTV2.5 ≥4.5, those who received postoperative adjuvant chemotherapy had longer DFS times than those who did not receive postopera-tive adjuvant chemotherapy (mean, 5.7 month; 95% CI, 2.2 to 9.2 vs mean, 17.4 month; 95% CI, 11.3 to 23.6; p=0.026) (Fig. 4A); furthermore, the DFS of the former group approached that of patients with MTV2.5 <4.5 (mean, 28.3 months; 95% CI, 18.9 to 37.6; p=0.075). Moreover, the overall disease-specific sur-vival of patients with MTV2.5 ≥4.5 who underwent postoperative chemotherapy became similar to those with MTV2.5 <4.5 (mean,
34.7 months; 95% CI, 29.9 to 45.2 vs mean, 48.4 months; 95% CI, 39.9 to 56.9; p=0.241) (Fig. 4B). In addition, it was found that among the 28 patients who experienced early (<6 months after surgery) systemic recurrence, only 17 patients (60.7%) received postoperative adjuvant chemotherapy, while most patients (58/65 patients, 89.2%) without early systemic recurrence received post-operative adjuvant chemotherapy (p=0.001) (Table 4).
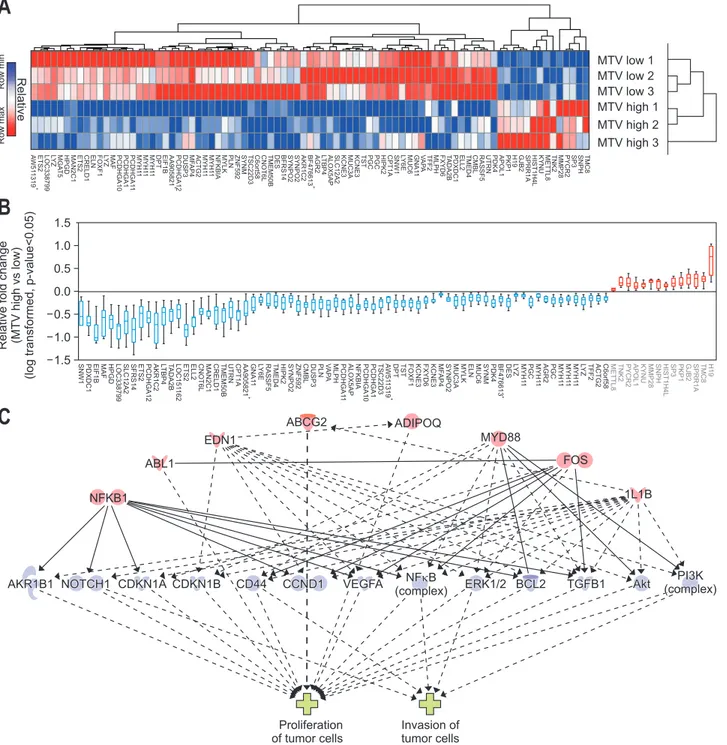
8. Genetic background of resected T3 pancreatic cancer with MTV2.5 ≥4.5 is associated with aggressive biologic behavior; transcriptome-wide analysis discriminating gene expression
In total, 85 genes (upregulated in MTV2.5 high: 14 genes; downregulated: 71) were identified in the transcriptome-wide analysis for differentially expressed genes according to metabol-ic phenotype (MTV high; MTV2.5 ≥4.5 vs MTV low; MTV2.5 <4.5) (Fig. 5A and B, Supplementary Tables 1 and 2, Supplementary Figs 1 and 2). Causative analyses using regulator effectors asso-ciated with the phenotype of the tumors were performed. Master regulators (NFKB1, ABL1, EDN1, ABCG2, ADIPOQ, MYD88, FOS, and IL1B) were associated with the phenotype of the tu-mor in terms of the proliferation and invasion of tutu-mor cells via several downstream effectors (AKR1B1, NOTCH1, CDKN1A, CDKN1B, CD44, CCND1, VEGFA, NFkB, ERK1/2, BCL2, TGFB1, Akt, and PI3K). These molecular pathways were significantly
Table 3. Details of Adjuvant Treatment According to MTV2.5
Adjuvant treatment MTV2.5 <4.5
(n=37) MTV(n=56)2.5 ≥4.5 p-value Adjuvant treatment 29 (78.4) 45 (80.4) 0.812
Chemoradiation 4 (13.8) 8 (17.8) 0.788
Chemotherapy only 25 (86.2) 48 (82.2)
Radiation dose, range, Gy 40.3±15.4 41.2±12.3 0.886 Chemotherapy regimen
Gemcitabine base 16 (55.2) 24 (53.3) 0.728 5-Fluorouracil base 13 (44.8) 21 (46.7)
Data are presented as number (%). MTV, metabolic tumor volume.
Table 4. Early Systemic Recurrence According to Postoperative Adju-vant Chemotherapy
Adjuvant chemotherapy
Early systemic recurrence (<6 mo after surgery) p-value
No Yes
Postoperative adjuvant No 7 11 0.001
chemotherapy Yes 58 17
Fig. 4. The adverse oncologic impact of MTV2.5 ≥4.5 according to postoperative adjuvant chemotherapy in resected pT3 pancreatic cancer. (A)
Dis-ease-free survival according to MTV2.5 subgroup with or without adjuvant chemotherapy (*p=0.00, †p=0.075, ‡p=0.026). (B) Disease-specific overall
survival according to MTV2.5 subgroup with or without adjuvant chemotherapy (§p<0.001, Ⅱp=0.241, ¶p<0.001).
MTV, metabolic tumor volume; pT3, pathologic T3; Adj-CTx, adjuvant chemotherapy.
B
A
Disease-free survival 20 40 60 1.0 0.8 0.6 0.4 0.2 0 Time (mo) 20 40 60 1.0 0.8 0.6 0.4 0.2 0 Time (mo) Disease-specific survival MTV 2.5<4.5 MTV2.5 MTV2.5 MTV2.5<4.5 >4.5 without Adj-CTx >4.5 with Adj-CTx MTV2.5 MTV2.5>4.5 without Adj-CTx >4.5 with Adj-CTx *correlated with the aggressive tumor phenotype (Fig. 5C, data shown in Supplementary Tables 4 and 6).
A supervised analysis for cancer-specific genes related to the hallmarks of cancer was performed using gene set analysis with gene sets for oncogenes, tumor suppressor genes, proliferation, apoptosis, extracellular remodeling, angiogenesis, immune es-cape, epithelial-mesenchyme transition, metastasis, and
metabo-lism obtained from the GeneCards database (Supplementary Figs
2-6).15,16
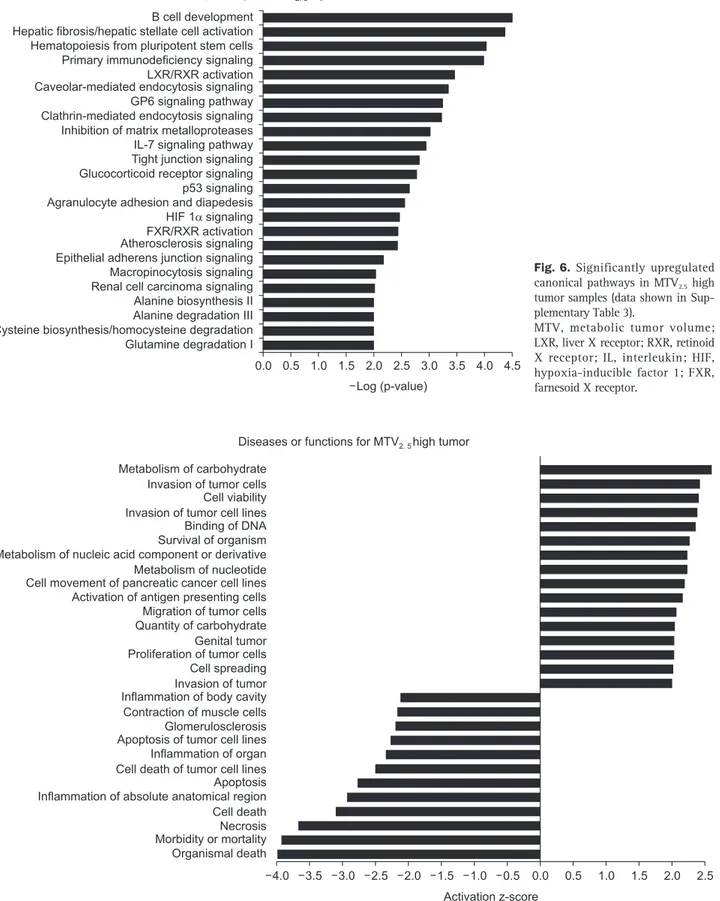
The upregulated canonical pathways predicted from the gene expression pattern of the MTV high tumors were associat-ed with aberrant immune response, impairassociat-ed stromal signaling, and alternative metabolic pathways (Fig. 6). MTV high tumors were strongly associated with the aggressive tumor phenotype in terms of the proliferation and invasion of tumor cells, with
Fig. 5. Hierarchical clustering & significant genes heat map comparing metabolic tumor volume (MTV) high versus low (14 upregulated genes and 71 downregulated genes). (A) Hierarchical clustering of significantly expressed genes (fold change >2 or <0.5 with p<0.05). (B) Relative log-transformed fold changes of MTV high versus low. (C) Causative analysis of regulatory effectors and associated tumor phenotype. Master regula-tors (NFKB1, ABL1, EDN1, ABCG2, ADIPOQ, MYD88, FOS, and IL1B) were associated with the tumor phenotype in terms of the proliferation and invasion of tumor cells via several downstream effectors (AKR1B1, NOTCH1, CDKN1A, CDKN1B, CD44, CCND1, VEGFA, NFkB, ERK1/2, BCL2, TGFB1, Akt, and PI3K) (data shown in Supplementary Tables 4 and 6).
B
C
RelativeA
MTV low 1 MTV low 2 MTV low 3 MTV high 1 MTV high 2 MTV high 3 Row min Row ma x Relative fold change (MTV high vs low) (log transformed, p-value<0.05) 1.5 1.0 0.5 0.0 0.5 1.0 1.5 Proliferation of tumor cells Invasion of tumor cells 1L1B FOS MYD88 ADIPOQ ABCG2 EDN1 ABL1 NFKB1AKR1B1 NOTCH1 CDKN1A CDKN1B CD44 CCND1 VEGFA NF B
(complex) ERK1/2 BCL2 TGFB1 Akt
PI3K (complex) TMC8 SNPH SP3 PYCR2 MMP28 TNK2 METTL8 KYNU HIST1H4L SPRR1A GJB2 H19 PKP1 APOL1 PDK4 UTRN RASSF5 CMBL TMED4 ELL2 PDXDC1 T ADA2B FXYD6 MLPH TFF2 V A P A GNA1 1 MUC6 L Y6E SNW1 CPT1A HIPK2 PGC PGC TST KCNE3 MUC3A KCNE3 SLC12A2 ALOX5AP L TBP4 AGR2 BF476613 + AKR1C2 SYNPO2 SYNPO2 BFRS14 DES TMEM50B CNOT6L C6ort58 TSC22D3 SYNM ZNF592 PLN MYLK NFKBIA MYH1 1 MYH1 1 ACTG2 MF AP4 DUSP3 PCDHGA12 AA905821 + EIF1B DPT MYH1 1 MYH1 1 MYH1 1 PCDHGA1 1 PCDHGA1 PCDHGA10 MAF L Y Z FOXF1 ELN CRELD1 ETS2 MAN2C1 HPGD MGA T5 L Y Z LOC338799 ETS2 A W51 1319 + H1 9 TMC8 SPRR1A GJB2 PKP1 SP3 HIST1H4L SNPH MMP2 8 KYNU APOL 1 PYCR2 TNK2 METTL 8 C6orf58 ACTG2 TFF 2 L Y Z MYH1 1 MYH1 1 MYH1 1 PGC AGR2 MYH1 1 L Y Z DE S BF476613 + PDK4 SYNM MUC6 ELN MYL K MUC3 A SYNPO2 MF AP4 KCNE 3 FOXF1 TST DP T A W 51 1319 + TSC22D3 PCDHGA1 PCDHGA1 0 NFKBI A ALOX5AP PCDHGA1 1 MLPH V A P A PLN DUSP 3 CMBL ZNF592 SYNPO2 HIPK2 TMED4 RASSF5 L Y 6E GNA1 1 AA90582 1 + CPT1 A UTRN TMEM50B CRELD1 MAN2C1 CNOT6L ELL 2 ETS2 LOC151 16 2 T ADA2 B L TBP4 AKR1C2 PCDHGA1 2 ETS2 SFRS1 4 SLC12A 2 LOC338799 HPGD MAF EIF1 B PDXDC1 SNW1 MYH1 PGC 1 FXYD6 KCNE 3
Canonical pathway for MTV2. 5high tumor B cell development
Hepatic fibrosis/hepatic stellate cell activation Hematopoiesis from pluripotent stem cells Primary immunodeficiency signaling LXR/RXR activation Caveolar-mediated endocytosis signaling GP6 signaling pathway Clathrin-mediated endocytosis signaling Inhibition of matrix metalloproteases IL-7 signaling pathway Tight junction signaling Glucocorticoid receptor signaling p53 signaling Agranulocyte adhesion and diapedesis HIF 1 signaling FXR/RXR activation Atherosclerosis signaling Epithelial adherens junction signaling Macropinocytosis signaling Renal cell carcinoma signaling Alanine biosynthesis II Alanine degradation III Cysteine biosynthesis/homocysteine degradation Glutamine degradation I 0.0 4.5 Log (p-value) 4.0 3.5 3.0 2.0 1.5 1.0 0.5 2.5
Fig. 6. Significantly upregulated canonical pathways in MTV2.5 high
tumor samples (data shown in Sup-plementary Table 3).
MTV, metabolic tumor volume; LXR, liver X receptor; RXR, retinoid X receptor; IL, interleukin; HIF, hypoxia-inducible factor 1; FXR, farnesoid X receptor.
Metabolism of carbohydrate Invasion of tumor cells Cell viability Invasion of tumor cell lines Binding of DNA Survival of organism Metabolism of nucleic acid component or derivative Metabolism of nucleotide Cell movement of pancreatic cancer cell lines Activation of antigen presenting cells Migration of tumor cells Quantity of carbohydrate Genital tumor Proliferation of tumor cells Cell spreading Invasion of tumor Inflammation of body cavity Contraction of muscle cells Glomerulosclerosis Apoptosis of tumor cell lines Inflammation of organ Cell death of tumor cell lines Apoptosis Inflammation of absolute anatomical region Cell death Necrosis Morbidity or mortality Organismal death
Diseases or functions for MTV2. 5high tumor
0.0 Activation z-score
4.0 3.5 3.0 2.5 2.0 1.5 1.0 0.5 0.5 1.0 1.5 2.0 2.5
Fig. 7. Diseases or functions associated with gene expression pattern of MTV2.5 high tumor samples (data shown in Supplementary Table 5).
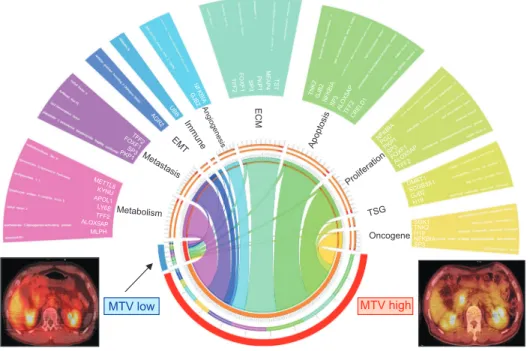
the predicted correlation with disease and function (Fig. 7). The landscape of discriminating gene expression levels of cancer-specific genes according to metabolic phenotype in resected pT3
pancreatic cancer visualized by Circos plots17 revealed that MTV
high tumors had markedly higher expression levels of cancer-specific genes than MTV low tumors, reflecting the biologically aggressive behavior of resectable pancreatic cancer (Fig. 8).
DISCUSSION
Pancreatic cancer is an intractable carcinoma with a dismal prognosis due to early systemic metastasis. Even after margin-negative resection of primary pancreatic cancer, the majority of patients undergo systemic metastasis. Early systemic metastasis is a major feature of pancreatic cancer even after margin-neg-ative resection of a primary cancer lesion. Therefore, the identi-fication of a high-risk group showing aggressive tumor biology even among patients with resectable pancreatic cancer is needed to improve their oncologic outcomes after curative resection.
Current evidence shows that metabolic phenotypes that can be obtained clinically by PET scans before surgical resection can predict the oncologic outcomes of patients with various solid
tumors.18 There is a high likelihood that a primary tumor with
high metabolic activity has at least a minimal amount of re-sidual disease that cannot be detected on preoperative imaging
studies.19,20
In the treatment of pancreatic cancer, systemic chemotherapy is fundamental for improving oncologic outcomes after
resec-tion.19 In fact, in the present study, 15 of 28 patients (53.6%)
showing early recurrence were found to have systemic metas-tasis before adjuvant treatment because of their poor general condition and their refusal of treatment (11 out of 15 patients).
Therefore, considering the potential role of systemic chemo-therapy in treating pancreatic cancer, even resectable pancreatic cancer, neoadjuvant chemotherapy might be reasonable in patients with pancreatic cancer with high MTV2.5. Our results also showed that high metabolic tumors correlated with higher node positive rate, early systemic recurrence within 6 months after curative resection, and favorable oncologic outcomes in response to systemic chemotherapy. It is thought that this popu-lation can be a potential candidate popupopu-lation for neoadjuvant treatment in resectable pancreatic cancer.
In this study, we performed a transcriptome-wide analysis using patients’ tumor tissue to reveal the genetic background of the differences in metabolic phenotypes identified on PET scans preoperatively. The result demonstrated broad enhancement of cancer-related gene expression, especially genes related to can-cer progression and metastasis in the MTV high group (MTV2.5 ≥4.5) compared to the low group (MTV2.5 <4.5). To the best of our knowledge, this is rare translational study using clinical samples based on metabolic phenotype measured by preopera-tive images to reveal differences in the molecular landscape ac-cording to metabolic phenotype.
This retrospective observational study was performed in a single institution with a limited study population. The transcrip-tome-wide analysis was also conducted in small number based on metabolic phenotype. In spite of these limitations, our pilot translational study showed the prognostic value of metabolic phenotype that can be identified by preoperative PET scan. In addition, the potential correlation between gene expression related to aggressive tumor behavior and high metabolism pan-creatic cancer can be utilized to suggest neoadjuvant treatment and could be beneficial for patients with “apparently” resectable pancreatic cancer with high FDG uptake.
MTV low MTV high Metabolism Metastasis EMT Immune Angiogenesi s ECM Apoptosis Proliferatio n TSG Oncogene DMBT1 SCGB3A1 GJB2 H19 SGK1 TNK2 H19 NFKBIA SP3 NFKBI A PGC PKP1 SP3 FOXF1 ALOX5AP TFF2 TN K2 GJB 2 NF KB IA SP 3 ALOX5AP TFF2 CRELD1 TS T M F A P 4 P K P 1 S P 3 FO XF1 TFF2 NFKBI A G JB 2 UB B AG R2 TFF2 FO XF1 SP3 PKP1 METTL8 KYNU APOL1 LY6E TFF2 ALOX5AP MLPH
Fig. 8. Circos plot for the landscape of discriminating gene expression related to cancer-specific genes ac-cording to metabolic phenotype in resected pT3 pancreatic cancer. MTV, metabolic tumor volume; pT3, pathologic T3; EMT, epithelial mes-enchymal transition; ECM, extracel-lular matrix; TSG, tumor suppressor gene.
In conclusion, resectable pancreatic cancer with high MTV2.5 is associated with lymph node metastasis and early systemic metastasis. Nonetheless, postoperative adjuvant chemotherapy attenuated this adverse oncologic impact of high MTV2.5 in re-sectable pancreatic cancer. The genetic background of rere-sectable pancreatic cancer with high MTV2.5 might be associated with aggressive biologic behavior. Taken together, neoadjuvant treat-ment can be a potential alternative even in resectable pancreatic cancer with high MTV2.5. A well-designed prospective clinical trial with confirmative mechanism study is needed to confirm the choice of therapeutic strategy according to metabolic phe-notype in pancreatic cancer.
CONFLICTS OF INTEREST
No potential conflict of interest relevant to this article was reported.
ACKNOWLEDGEMENTS
This study was supported by Korea Institute of Planning and Evaluation for Technology in Food, Agriculture, Forestry and Fisheries (IPET, 31-316055-3).
Author contributions: Study design: S.H.L., C.M.K. Data col-lection: H.K.H., W.J.L., M.Y. Data analysis: S.H.L., C.M.K. Article writing: S.H.L., C.M.K. Critical revision: C.M.K., M.Y. Obtaining fund: C.M.K.
REFERENCES
1. Hsu PP, Sabatini DM. Cancer cell metabolism: Warburg and be-yond. Cell 2008;134:703-707.
2. Bares R, Klever P, Hauptmann S, et al. F-18 fluorodeoxyglucose PET in vivo evaluation of pancreatic glucose metabolism for de-tection of pancreatic cancer. Radiology 1994;192:79-86.
3. Lindholm P, Minn H, Leskinen-Kallio S, Bergman J, Ruotsalainen U, Joensuu H. Influence of the blood glucose concentration on FDG uptake in cancer: a PET study. J Nucl Med 1993;34:1-6. 4. Czernin J, Phelps ME. Positron emission tomography scanning:
current and future applications. Annu Rev Med 2002;53:89-112. 5. Kinkel K, Lu Y, Both M, Warren RS, Thoeni RF. Detection of
he-patic metastases from cancers of the gastrointestinal tract by using noninvasive imaging methods (US, CT, MR imaging, PET): a meta-analysis. Radiology 2002;224:748-756.
6. Ahn SJ, Park MS, Lee JD, Kang WJ. Correlation between 18F-fluorodeoxyglucose positron emission tomography and pathologic differentiation in pancreatic cancer. Ann Nucl Med 2014;28:430-435.
7. Kubota K. From tumor biology to clinical PET: a review of posi-tron emission tomography (PET) in oncology. Ann Nucl Med 2001;15:471-486.
8. Torizuka T, Tamaki N, Inokuma T, et al. In vivo assessment of glucose metabolism in hepatocellular carcinoma with FDG-PET. J Nucl Med 1995;36:1811-1817.
9. Chung HH, Jo H, Kang WJ, et al. Clinical impact of integrated PET/CT on the management of suspected cervical cancer recur-rence. Gynecol Oncol 2007;104:529-534.
10. Shinoto M, Yamada S, Yoshikawa K, et al. Usefulness of 18F-fluorodeoxyglucose positron emission tomography as predictor of distant metastasis in preoperative carbon-ion radiotherapy for pancreatic cancer. Anticancer Res 2013;33:5579-5584.
11. Chong JU, Hwang HK, Lee JH, Yun M, Kang CM, Lee WJ. Clini-cally determined type of 18F-fluoro-2-deoxyglucose uptake as an alternative prognostic marker in resectable pancreatic cancer. PLoS One 2017;12:e0172606.
12. Kang CM, Lee SH, Hwang HK, Yun M, Lee WJ. Preoperative volume-based PET parameter, MTV2.5, as a potential surrogate marker for tumor biology and recurrence in resected pancreatic cancer. Medicine (Baltimore) 2016;95:e2595.
13. Kang CM, Hwang HK, Park J, et al. Maximum standard uptake value as a clinical biomarker for detecting loss of SMAD4 expres-sion and early systemic tumor recurrence in resected left-sided pancreatic cancer. Medicine (Baltimore) 2016;95:e3452.
14. Allen PJ, Kuk D, Castillo CF, et al. Multi-institutional validation study of the American Joint Commission on Cancer (8th Edition) changes for T and N staging in patients with pancreatic adenocar-cinoma. Ann Surg 2017;265:185-191.
15. Rebhan M, Chalifa-Caspi V, Prilusky J, Lancet D. GeneCards: in-tegrating information about genes, proteins and diseases. Trends Genet 1997;13:163.
16. Stelzer G, Rosen N, Plaschkes I, et al. The GeneCards Suite: from gene data mining to disease genome sequence analyses. Curr Pro-toc Bioinformatics 2016;54:1.30.1-1.30.33.
17. Krzywinski M, Schein J, Birol I, et al. Circos: an information aesthetic for comparative genomics. Genome Res 2009;19:1639-1645.
18. Kim BK, Kang WJ, Kim JK, et al. 18F-fluorodeoxyglucose uptake on positron emission tomography as a prognostic predictor in lo-cally advanced hepatocellular carcinoma. Cancer 2011;117:4779-4787.
19. Müller V, Alix-Panabières C, Pantel K. Insights into minimal residual disease in cancer patients: implications for anti-cancer therapies. Eur J Cancer 2010;46:1189-1197.
20. Kostakoglu L, Goldsmith SJ. 18F-FDG PET evaluation of the re-sponse to therapy for lymphoma and for breast, lung, and colorec-tal carcinoma. J Nucl Med 2003;44:224-239.