Effects of obesity on lower urinary tract symptoms in Korean
BPH patients
Seung Hwan Lee1, Joon Chul Kim2, Ji-Youl Lee2, Jang Hwan Kim1, Cheol Young Oh3, Seung Wook Lee4, Se Jeong Yoo1, Byung Ha Chung1
1Department of Urology, Yonsei University Health System, Seoul 135-720, Korea 2Department of Urology, The Catholic University of Korea, Seoul 137-701, Korea 3Department of Urology, Hallym University, Chuncheon 200-704, Korea
4Department of Urology, Eulji Medical Center, Eulji University, Seoul 139-230, Korea
Correspondence to: Dr Byung Ha Chung, Department of Urology, Yonsei University Health System, Gangnam Severance Hospital, Yongdong, PO Box 1217, Seoul 135-720, Korea.
Fax: +82-2-3462-8887 E-mail: [email protected] Received: 30 June 2009 Revised: 3 August 2009 Accepted: 20 August 2009 Published online: 21 September 2009
Original Article
Abstract
We analyzed the effects of obesity on lower urinary tract symptoms (LUTSs) in Korean benign prostatic hyperplasia (BPH) patients. This is a multicenter, cross-sectional, prospective study conducted in four centers in Korea. A total of 602 men with LUTSs secondary to BPH were included. BPH/LUTSs cases were men aged ≥ 40 years with international prostate symptom scores (IPSS) ≥ 8 points. Height, weight and waist circumference were measured. Among the 602 patients, 156 patients had a waist circumference above 90 cm, representing central obesity, and 215 patients had a body mass index above 25 kg m-2. Waist circumference was positively correlated with prostate volume (P = 0.034). Men with waist circumference > 90 cm experienced a 1.36-fold increased risk of severe LUTSs (95% CI 0.82–2.41) compared with men with waist circumference ≤ 90 cm. Prostate volume was positively correlated with urgency and nocturia in men with central obesity. In this population of Korean men diagnosed with BPH, central obesity rather than overall obesity seems to be the more important predictor of LUTSs correlated with BPH.
Asian Journal of Andrology (2009) 11: 663–668. doi: 10.1038/aja.2009.62; published online 21 September 2009.
Keywords: benign prostatic hyperplasia, central obesity, lower urinary tract symptom, prostate
1 Introduction
Lower urinary tract symptoms (LUTSs), often the result of benign prostatic hyperplasia (BPH), are common among older men and have a negative
impact on quality of life (QoL). Most men after the fifth decade experience symptoms of BPH [1]. Despite its frequency and its impact on quality of life, the pathophysiology of BPH is unclear and there is controversy about the risk factors that contribute to the development and aggravation of BPH [2]. Recent studies concerning the pathophysiology of BPH have suggested that in addition to the conventional risk factors, such as age, family history and androgen activity, newly identified risk factors, such as smoking, diet and obesity, may have a major role in the development of BPH [2, 3].
may greatly affect their QoL. Positive associations between anthropometric measures of obesity and LUTSs were observed in one cohort study, but not in another [4, 5]. In addition, on the basis of the observation in a clinic-based study of 158 patients that an enlarged prostate is more often diagnosed in men who have components of a metabolic syndrome, such as insulin-dependent diabetes mellitus (DM), hypertension requiring treatment, low high-density lipoprotein–cholesterol levels, high fasting insulin levels and obesity, Hammarsten et al. [6]suggested that the development of an enlarged prostate might be the result of perturbations in insulin control and other aspects of the metabolic syndrome.
The Korean National Health and Nutrition Surveys reported an increase in prevalence of obesity in South Korea from 1995 to 2001, and an age-related increase in prevalence of obesity in Korean adults, in 2001 [7]. The prevalence of clinical BPH was reported to be from 10.6% to 31% in men over 50 years of age, with an age-related increase seen in South Korea [8, 9]. However, there is insufficient data on risk factors for prostatic hyperplasia, especially the role of obesity in Korean men. In this cross-sectional study, we investigated the relationship of obesity with clinical markers of LUTSs in men aged 40 years or more among BPH/LUTS patients.
2 Materials and methods 2.1 Study design
This was a multicenter, prospective, cross-sectional study conducted in four urology centers in Korea from July 2007 to May 2008 through a questionnaire survey and laboratory findings at first visit. Before initiating this study, approval was granted from the local institutional review board, and patients provided informed consent.
Eligible patients with BPH/LUTSs attending a urology clinic for the first time were enrolled. There were no preinclusion or washout periods. Only one visit was planned. The symptoms of BPH were collected through the routine evaluation of BPH using transrectal ultrasound of the prostate, uroflowmetry, International Prostate Symptom Score (IPSS), urine analysis and prostate-specific antigen (PSA) determinations. Height, weight and waist circumference were measured in all enrolled patients. At the initial visit, the following variables were also recorded: the patient’s demographic
data (patient’s initials, age), vital signs (blood pressure, pulse), reasons for consultation, duration of symptoms, medical history of hypertension or DM, medical treatment prescribed (if any) and dosage prescribed. The body mass index (BMI) of each patient was calculated as the body weight in kilograms divided by the square of the height in meters.
2.2 Patients
In total, 602 BPH patients with LUTSs (IPSS ≥ 8 points) and aged ≥ 40 yrs were included in this prospective study. The exclusion criteria of this study included the use of medications affecting prostate growth and erectile function such as antiandrogens and 5-a-reductase inhibitors. Patients were also excluded from this trial if they had neurogenic bladder dysfunction, confirmed prostate cancer, acute or chronic urinary retention status, acute or chronic prostatitis within the previous 3 months, serum PSA levels in excess of 10 ng mL-1, a history of recurrent urinary tract infection or bladder stones and previous TURP (transurethral resection of the prostate) or other surgical intervention related to BPH. The subjects were divided into three groups according to BMI: normal (< 22.9 kg m-2), overweight (23–24.9 kg m-2) and obese (≥ 25 kg m-2). They were also categorized into two groups by waist circumference: normal waist (≤ 90 cm) and central obesity (> 90 cm). Classification of the subgroups was based on the Asia–Pacific obesity criteria [10].
2.3 Statistical analysis
All analyses were conducted with SAS statistical software, version 8.2 (SAS Institute, Cary, NC, USA). After performing a covariate analysis of variance for adjusting for age, the significance of differences in prostate volume, PSA concentration, IPSS and Qmax among the groups based on BMI was examined using ANOVA (analysis of variance) with Scheffe’s post hoc test and among groups based on waist circumference using unpaired t-test. The χ2-test was used to determine the statistical significance of differences in DM and hypertension between groups. As the data for PSA concentration, prostate volume, residual volume and Qmax were not normally distributed, we examined the data after logarithmic transformation. After adjusting for age, we used linear regression to examine the association between metabolic components and prostate volume. Multivariate logistic regression analyses was
used for risk factors of severe LUTSs, adjusting for age, prostate volume and PSA. P < 0.05 was considered to be statistically significant.
3 Results
The overall mean prostate volume was 33.1 ± 7.6 cm3 (range 20.0–98.0 cm3). Among the 602 patients, 156 patients had a waist circumference above 90 cm, representing central obesity, and 215 patients had a BMI above 25 kg m-2. Mean prostate volume was 31.6 ± 11.4 and 34.7 ± 14.2 cm3 in the ≤ 90 and > 90 cm waist groups, respectively, and 31.4 ± 11.0, 32.5 ± 11.5 and 33.4 ± 13.8 cm3 in the normal, overweight and obese groups, respectively. After adjusting for age, men with an obese waist circumference had a greater median prostate volume (P = 0.021) (Table 1). Moreover, in the regression analyses after adjusting for age, waist circumference was positively correlated with prostate volume (P = 0.034) (Table 2).
An obese waist circumference was statistically associated with DM and hypertension; however, BMI was correlated only with hypertension (Table 1). Men with waist circumference > 90 cm had significantly lower PSA levels compared with men with waist circumference ≤ 90 cm (P = 0.04).
The odds ratios of severe LUTSs (IPSS ≥ 19) in relation to BMI, waist circumference, presence of diabetes and hypertension are summarized in Table 3. Men with waist circumference > 90 cm experienced a
Table 1. Age-adjusted demographic characteristics of the study subjects according to waist circumference and BMI.
Waist circumference Waist circumference BMI < 22.9 kg m-2 BMI 23–24.9 kg m-2 BMI ≥ 25 kg m-2
≤ 90 cm > 90 cm normal overweight obese
Number 446 156 209 178 215
Prostate volume (cm3) 31.6 ± 11.4 34.7 ± 14.2* 31.4 ± 11.0 32.5 ± 11.5 33.4 ± 13.8
PSA (ng mL-1) 1.96 ± 1.94 1.73 ± 1.51* 1.61 ± 1.20 1.79 ± 1.31 1.82 ± 1.32
IPSS (total score) 16.8 ± 6.9 17.4 ± 6.3 17.2 ± 7.6 16.7 ± 6.2 16.9 ± 7.0
Qmax (mL s-1) 16.7 ± 8.0 12.1 ± 4.9 21.7 ± 8.5 11.8 ± 6.4 12.8 ± 9.5 DM (%) Yes 15.7 26.3D = 18.2 16.3 20.5 No 84.3 73.7 81.8 83.7 79.5 HTN (%) Yes 33.0 50.0D = 29.2D = 35.4D = 46.5D = No 67.0 50.0 70.8 64.6 53.5
Abbreviations: BMI, body mass index; PSA, prostate-specific antigen; IPSS, International Prostate Symptom Score; DM, diabetes mellitus.
The values for prostate volume, PSA, IPSS, QoL and Qmax are expressed as means ± SD. *P < 0.05 by unpaired t-test, compaired with
the group of waist circumference ≤ 90 cm; D
=P < 0.05 among three groups by χ2-test.
Table 2. Linear regression analyses evaluating factors correlated with prostate volume.
Coefficient P-value
BMI (kg m-2)a 0.120 0.687
Waist circumference (cm)a 0.277 0.034
DMb 0.736 0.597
Hypertensionb 0.201 0.861
aComponent is continuous variable; bComponent is absent or present.
Table 3. Odds ratio of severe LUTSs according to metabolic markers. P-value ORa (95% CI) BMI (kg m-2) < 22.9 (normal) [1] (Reference) 23 – 24.9 (overweight) 0.15 1.17 (0.65 – 2.03) ≥ 25 (obese) 0.09 1.19 (0.62 – 2.21) Waist circumference (cm) ≤90 [1] (Reference) > 90 0.04 1.36 (0.82 – 2.41)
Abbreviations: CI, confidence interval; LUTS, lower urinary tract symptom.
aOdds ratio adjusted for age, prostate volume and PSA.Severe
LUTS is defined as IPSS ≥ 19.
1.36-fold increased risk of severe LUTSs (95% CI 0.82 –2.41) compared with men with waist circumference ≤ 90 cm. Men with diabetes experienced a 1.53-fold increased risk of severe LUTSs (95% CI 0.60–2.33) compared with men without diabetes.
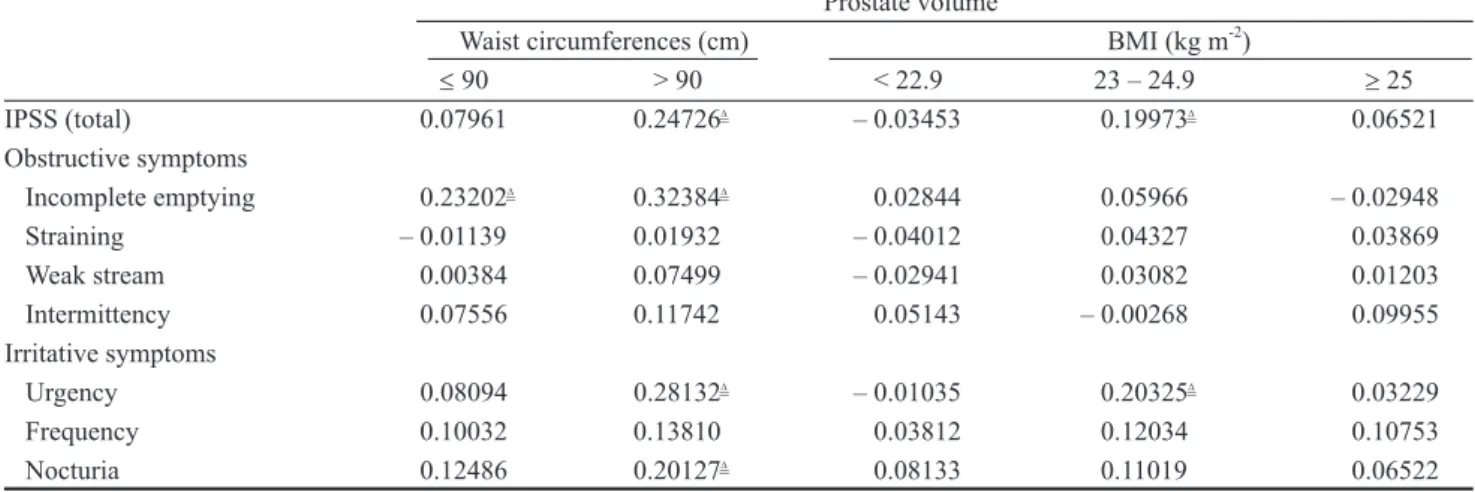
the higher the BPH/LUTS severity scores, especially in men with waist circumference > 90 cm (P = 0.02). In these patients, prostate volume was positively correlated with urgency and nocturia among irritative symptoms and with incomplete emptying among obstructive symptoms after adjustment for age (P < 0.05).
4 Discussion
Our data showed that prostate volume was positively correlated with central obesity, as represented by waist circumference, but not with BMI, representing overall obesity. However, it is known that obesity and BMI are significantly associated with the risk of BPH and with prostate volume [11]. In an American case–control study of black men, Sarma et al. [12] reported that BMI was directly associated with prostate volume. The positive associations described between BMI and prostate volume, however, have not been consistently observed across studies. There was no association between BMI and BPH in a Greek study [13]. In a Chinese study, there was no relationship with BMI, but a direct association was observed with the waist/ hip ratio [14]. In another study, body surface area positively correlated with prostate volume, whereas BMI did not [15]. Lee et al. [16] found that centrally obese men had lower testosterone concentrations and greater prostate volume. Obesity raises estrogen levels, as well as free and total estradiol concentrations while lowering free and total testosterone and serum globulin-binding protein levels [17]. Greater estrogen
levels in the environment of age-induced and obesity-induced lower testosterone levels may affect prostate cell growth. Especially, abdominal obesity increases the estrogen to androgen ratio and may increase sympathetic nervous activity, both known to influence the development of BPH and the severity of LUTSs [4, 18]. One more pathway that explains the increased risk for BPH in centrally obese men is the linkage of the quality of venous drainage to BPH [19]. Gat et al. [19] observed that BPH developed because of an impairment of the testicular venous drainage system in the erect posture. They found that in BPH patients, the one-way valves in the vertically oriented internal spermatic veins are destroyed (clinically manifested as varicocele), causing elevated hydrostatic pressure, some sixfold greater than normal, in the venous drainage of the male reproductive system. Furthermore, in the centrally obese men, big abdominal mass just above the testicular venous system may affect the prostate. However, in the current study, we did not have data about the testicular drainage system. The causal relation between the central obesity and the prostate volume requires further study.
In our study, serum PSA level was associated with waist circumference but not with BMI. Serum PSA levels may be affected by many factors, such as, age, prostate volume and obesity. Recently, several studies have found a greater BMI to be linked with lower PSA levels [18, 20–21]. In contrast, Ochiai et al. [22] reported that the anthropometric parameters were not directly associated with the PSA levels. Even though obesity is
Table 4. Partial Pearson correlation analyses. Distribution of individual symptoms according to waist circumferences and BMI. Prostate volume
Waist circumferences (cm) BMI (kg m-2)
≤ 90 > 90 < 22.9 23 – 24.9 ≥ 25 IPSS (total) 0.07961 0.24726D = – 0.03453 0.19973D = 0.06521 Obstructive symptoms Incomplete emptying 0.23202D = 0.32384D = 0.02844 0.05966 – 0.02948 Straining – 0.01139 0.01932 – 0.04012 0.04327 0.03869 Weak stream 0.00384 0.07499 – 0.02941 0.03082 0.01203 Intermittency 0.07556 0.11742 0.05143 – 0.00268 0.09955 Irritative symptoms Urgency 0.08094 0.28132D = – 0.01035 0.20325D = 0.03229 Frequency 0.10032 0.13810 0.03812 0.12034 0.10753 Nocturia 0.12486 0.20127D = 0.08133 0.11019 0.06522
Abbreviations: BMI, body mass index; IPSS, International Prostate Symptom Score. All values shown are partial correlation coefficient adjusted by age.
a major anthropometric factor in metabolic syndrome, complex interrelationships exist among individual anthropometric parameters partly because of their associations with obesity. Kristal et al. [21]reported that PSA levels were ~0.2–0.4 ng ml-1 lower among individuals who were obese but otherwise healthy as compared with non-obese; however, unfortunately, the magnitude of the correlation between serum PSA levels and the presence of each metabolic component still remains unclear. Given that the prevalence of obesity and metabolic syndrome are increasing worldwide and that the world population is aging, the effect of obesity and related anthropometric factors on altered PSA levels warrant further clarification. In the Olmsted county study, Burke et al. [23] observed that diabetic men had a significantly greater AUASI (the American Urological Association Symptom Index) score and a lower peak urinary flow rate compared with those without diabetes. However, no significant difference was found in changes in prostatic volume, suggesting that the presence of diabetes may be more closely associated with the dynamic components of lower urinary tract function than with BPH progression. Another report showed that the incidence of nocturia increased with increasing BMI [24]. In our study, we observed that the irritative symptoms, such as nocturia and urgency, increased with the increases of prostate volume in men with waist circumference > 90 cm. The mechanisms underlying the association between obesity and nocturia are as yet unknown. Obesity could cause nocturia by increased urine production or by increased voiding frequency. Obese men may have increased nocturnal production of urine as a result of increased fluid intake before bedtime, or centrally obese men can have an increased intra abdominal pressure, and therefore, cause nocturia. Obesity may also increase the risk of nocturia by causing BPH [25].
Limitations affecting our current findings must be considered. First, our study is cross-sectional, a method that might not allow definitive conclusions about causal links between the severity of LUTSs and the investigated variables. Second, the patients in this study had IPSS ≥ 8 points. Exclusion of men with IPSS < 8 may have increased the sensitivity to detect associations of obesity with LUTSs. Third, our study was limited by relying on the self-reported diagnosis of hypertension or DM. Therefore, we could not assess exact duration of concomitant diseases as well as medications taken for each subject because of lack of
relevant information. Finally, our study did not include all demographic variables. As other sociodemographic and health status variables, such as marital status, socioeconomic variables and work situation, might affect urinary symptoms, additional studies including these variables are needed.
In conclusion, this study provides evidence that central obesity rather than overall obesity seems to be the more important predictor of LUTSs correlated with BPH.
Acknowledgment
This study was sponsored by Pfizer Korea Ltd. References
1 Isaacs JT, Coffey DS. Etiology and disease process of benign prostatic hyperplasia. Prostate 1989; 2: 33–50. 2 Nandeesha H. Benign prostatic hyperplasia: dietary and
metabolic risk factors. Int Urol Nephrol 2008; 40: 649–56. 3 Suzuki S, Platz EA, Kawachi I, Willett WC, Giovannucci E.
Intakes of energy and macronutrients and the risk of benign prostatic hyperplasia. Am J Clin Nutr 2002; 75: 685–97. 4 Giovannucci E, Rimm EB, Chute CG, Kawachi I, Colditz
GA, et al. Obesity and benign prostatic hyperplasia. Am J Epidemiol 1994; 140: 989–1002.
5 Gann PH, Hennekens CH, Longcope C, Verhoek-Oftedahl W, Grodstein F, et al. A prospective study of plasma hormone levels, nonhormonal factors and development of benign prostatic hyperplasia. Prostate 1995; 26: 40–9.
6 Hammarsten J, Hogstedt B, Holthuis N, Mellstrom D. Components of the metabolic syndrome-risk factors for the development of benign prostatic hyperplasia. Prostate Cancer Prostatic Dis 1998; 1: 157–62.
7 Kim DM, Ahn CW, Nam SY. Prevalence of obesity in Korea. Obes Rev 2005; 6: 117–21.
8 Park YH, Chung MK. The prevalence of clinical benign prostatic hyperplasia and lower urinary tract symptoms in South-East Korea: a community-based study. J Pusan Natl Univ Hosp 2001; 9: 141–57.
9. Lee MW, Lee KS. The prevalence of benign prostatic hyperplasia in self-referral populations over aged 50. Korean J Urol 1996; 37: 263–7.
10 World Health Organization. Western Pacific Region. International Association for the Study of Obesity. The Asia-Pacific perspective: redefining obesity and its treatment. Sydney, Australia: Health Communications Australia Pty Limited; 2000.
11 Xie LP, Bai Y, Zhang XZ, Zheng XY, Yao KS, et al. Obesity and benign prostatic enlargement: a large observational study in China. Urology 2007; 69: 680–4.
12 Sarma AV, Jaffe CA, Schottenfeld D, Dunn R, Montie JE, et al. Insulin-like growth factor-1, insulin-like growth factor
binding protein-3, and body mass index: clinical correlates of prostate volume among black men. Urology 2002; 59: 362–7.
13 Signorello LB, Tzonou A, Lagiou P, Samoli E, Zavitsanos X, et al. The epidemiology of benign prostatic hyperplasia: a study in Greece. BJU Int 1999; 84: 286–91.
14 Dahle SE, Chokkalingam AP, Gao YT, Deng J, Stanczyk FZ, et al. Body size and serum levels of insulin and leptin in relation to the risk of benign prostatic hyperplasia. J Urol 2002; 168: 599–604.
15 Kim YD, Yang WJ, Song YS, Park YH. Correlation between prostate volume and metabolic or anthropometric factors in male visitors to a health promotion center. Korean J Urol 2008; 49: 139–44.
16 Lee SY, Min HG, Choi SH, Kim YJ, Oh SW, et al. Central obesity as a risk factor for prostatic hyperplasia. Obesity 2006; 14: 172–9.
17 Pasquali R, Casimirri F, Cantobelli S, Melchionda N, Morselli Labate AM, et al. Effect of obesity and body fat distribution on sex hormones and insulin in men. Metabolism 1991; 40: 101–4.
18 Barqawi AB, Golden BK, O’Donnell C, Brawer MK, Crawford ED. Observed effect of age and body mass index on total and complexed PSA: analysis from a national screening program. Urology 2005; 65: 708–12.
19 Gat Y, Gornish M, Heiblum M, Joshua S. Reversal of benign prostate hyperplasia by selective occlusion of impaired venous drainage in the male reproductive system: novel mechanism, new treatment. Andrologia 2008; 40: 273–81. 20 Ku JH, Kim ME, Lee NK, Park YH, Ahn JO. Influence of
age, anthropometry, and hepatic and renal function on serum prostate-specific antigen levels in healthy middle-age men. Urology 2003; 61: 132–6.
21 Kristal AR, Chi C, Tangen CM, Goodman PJ, Etzioni R, et al. Associations of demographic and lifestyle characteristics with prostate-specific antigen (PSA) concentration and rate of PSA increase. Cancer 2006; 106: 320–8.
22. Ochiai A, Fritsche HA, Babaian RJ. Influence of anthropometric measurements, age, and prostate volume on prostate-specific antigen levels in men with a low risk of prostate cancer. Urology 2005; 66: 819–23.
23. Burke JP, Jacobson DJ, McGree ME, Roberts RO, Girman CJ, et al. Diabetes and benign prostatic hyperplasia progression in Olmsted County, Minnesota. Urology 2006; 67: 22–5. 24 Shiri R, Hakama M, Hakkinen J, Auvinen A, Huhtala H,
et al. The effects of lifestyle factors on the incidence of nocutria. J Urol 2008; 180: 2059–62.
25 Yoshimura K, Terada N, Matsui Y, Terai A, Kinukawa N, et al. Prevalence of and risk factors for nocturia: analysis of a health screening program. Int J Urol 2004; 11: 282–7.
![Table 3. Odds ratio of severe LUTSs according to metabolic markers. P-value OR a (95% CI) BMI (kg m -2 ) < 22.9 (normal) [1] (Reference) 23 – 24.9 (overweight) 0.15 1.17 (0.65 – 2.03) ≥ 25 (obese) 0.09 1.19 (0.62 – 2.21) Waist c](https://thumb-ap.123doks.com/thumbv2/123dokinfo/5073411.72219/3.892.461.814.836.993/table-severe-according-metabolic-markers-normal-reference-overweight.webp)