J Korean Acad Community Health Nurs (지역사회간호학회지) https://doi.org/10.12799/jkachn.2020.31.S.563
Factors Associated with Physical Activity in Older Adults by Region:
Based on the 2017 Community Health Survey
Lee, Hyun-Ju
1· Lee, Yeongsuk
1· Yun, Jungmi
21Assistant Professor, College of Nursing, Catholic University of Pusan, Busan 2Assistant Professor, College of Nursing, Pusan National University, Yangsan, Korea
Purpose: The purpose of this study is to identify personal factors, social factors, and environmental factors related to physical activity in older adults in urban and non-urban areas. Methods: We used source data from the 2017 Community Health Survey. The subjects of this study included some older adults aged 65 and over, and analyzed the data of 23,043 older adults living in the urban and 34,063 older adults living in the non-urban area. Results: The common factors influencing physical activity in older adults by region include current smoking and drinking, BMI, sleep duration, and subjective health status, help with neighbors, frequency of meeting with neighbors and friends, participation in social and leisure activities, and falls experience (p<.001). However, the living environment, public transport satisfaction, and medical service use significantly associated with physical activity for only older adults living in the urban area (p<.001). Conclusion: In order to improve physical activity in older adults in the community, it is necessary to consider not only the improvement of individual factors that practice health behaviors but also health promotion strategies that take into account social and environmental factors because there are environmental differences among regions.
Key Words: Aged; Exercise; Health; Urban population; Rural population
Corresponding author: Yun,Jungmi
College of Nursing, Pusan National University, 49 Busandaehak-ro, Mulgeum-eup, Yangsan 50612, Korea. Tel: +82-51-510-8305, Fax: +82-51-510-8308, E-mail: [email protected]
- This study was supported by the Korean Society for Preventive Medicine funded by a grant from the Korea Centers for Disease Control and Prevention Chronic Disease Control Research (ISSN 2733-5488).
Received: May 6, 2020 / Revised: Jul 21, 2020 / Accepted: Oct 8, 2020
This is an open access article distributed under the terms of the Creative Commons Attribution Non-Commercial License (http://creativecommons.org/licenses/ by-nc/3.0), which permits unrestricted non-commercial use, distribution, and reproduction in any medium, provided the original work is properly cited.
INTRODUCTION
1. Background
With the growth of the older population, the average life expectancy of Koreans has increased significantly to 82.4 years, but the healthy life expectancy is estimated to be 64.9 years, 17.5 years lower than the life expectancy [1]. This means that older adults live in an unhealthy state due to diseases, frailty, and lying sick in bed during the period. Since most health problems in older adults are chronic dis-eases, active improvement of lifestyle habits and self-man-agement skills for chronic disease manself-man-agement are re-quired [2]. However, individual efforts alone are insuffi-cient, and the role of the community is important in im-proving health-related lifestyle habits and enhancing the
competency in chronic disease self-management in older adults.
Most older adults aged 65 and older have one or more chronic diseases [2], so the management of geriatric dis-eases and health-promoting behaviors that enable inde-pendent daily life are required. Among health-promoting behaviors, physical activity is a useful method for a healthy old age and independent life by prolonging healthy life expectancies. In other words, physical activity can reduce changes in physical functions due to the aging process, pre-vent cognitive decline, increase independence, and alle-viate depression, thereby improving the quality of life in older adults [3]. Despite the positive effects of such phys-ical activity, it has been reported that 41.9% of older adults in Korea do not participate in physical activity and partici-pation in physical activity decreases gradually with
in-creasing age [2]. According to the World Health Organiza-tion (WHO)[4], the lack of physical activity is the fourth leading cause of death worldwide. Since the lack of phys-ical activity is such a serious level, active measures are re-quired to maintain and promote physical activity to lead a healthy life, and a prerequisite for such measures is to identify factors related to physical activity in older adults.
The physical activity of older adults is reported to be af-fected by sociodemographic factors such as gender, age, educational level, and economic status [3,5]. Although an individual's biological, genetic and socioeconomic charac-teristics determine health status levels, health may also be improved by the physical environment or institutional support which provides motivation for health promotion. On the other hand, prolonged exposure to a harmful envi-ronment or more limited social support compared to oth-ers may result in relatively poorer health conditions or more serious health problems [6]. Individual factors that influence physical activity in older adults are variables that increase or decrease the likelihood that individuals would participate in physical activity, and they include individuals' psychological characteristics, such as self- efficacy, attitude, belief, and motivation and sociodemo-graphic characteristics, such as gender, age, and education level [7]. Social factors are various social factors that influ-ence individual behavior and they include social support, social network, social capital, and neighborhood factors [8]. Since physical activities are performed within a phys-ical environment, physphys-ical environmental factors are very important for continuous or regular physical activities, and they include ease of spatial access to exercise facilities, convenience of exercise facilities, and the stability of the surrounding environment [9]. Therefore, it is necessary to gain an understanding of the complex effects of in-dividual, social and environmental factors before devel-oping a plan for improving physical activity among older adults.
In recent years, the composition ratio of the older pop-ulation has been becoming different according to the resi-dential areas (urban and non-urban areas) across the world. As a result, the exercise participation rate and fac-tors affecting physical activity among older adults may vary according to the residential areas [10]. Therefore, in order to increase physical activity among older adults, it is necessary to develop strategies for promoting physical ac-tivity in consideration of the individual, social, and envi-ronmental characteristics of older adults in each resi-dential area. Previous studies on the health of older adults according to the place of residence or residential area were mostly focused on individual factors such as demographic
characteristics and health-related characteristics [11,12] and a study considered the impact of social support on health status together with other factors [13]. Most pre-vious studies on physical activity in older adults limited research to one type of area, such as urban or rural areas, or investigated related factors without the division of resi-dential areas [3,5,8,14]. Although a small number of stud-ies compared predictive factors for physical activity among urban and rural older adults [15], few studies have suffi-ciently considered the social and environmental character-istics reflecting the physical and human health resources of residential areas.
In particular, in Korea, since economic development has been concentrated in the Metropolitan Area around Seoul, distinct disparities in health between the metropoli-tan and the non-metropolimetropoli-tan areas have been observed in recent years, and the health gap between regions has been widening especially in non-urban areas [16]. With respect to these aspects, it is considered a meaningful research at-tempt to examine the problem of regional health dis-parities among older adults since this investigation allows us to identify differences in the social structural conditions. The physical and social environment of a residential area affects the resources and choices available to residents. In particular, for older adults with characteristics such as physical frailty, a lack of resources, and limited accessi-bility, environmental factors such as medical services, var-ious social facilities, and community capacity [17] affect their physical activities, which may lead to regional dis-parities in health status.
Therefore, based on the social ecological model (SEM) [18], which considers multidimensional effects including social and environmental factors as well as individual fac-tors in relation to the determinants of health behaviors of individuals, this study aimed to make an integrative in-vestigation of overall factors influencing physical activity in older adults by region. Through this investigation, this study attempted to provide basic data for the develop-ment of community programs to promote physical activ-ity among older adults and strategies to create a social en-vironment to reduce regional health inequalities.
2. Purpose
The main purpose of this study was to identify indivi-dual, social and environmental factors related to physical activity in older adults in urban and non-urban areas by using the data from the Community Health Survey since the data allows a comparison of health status levels be-tween regions.
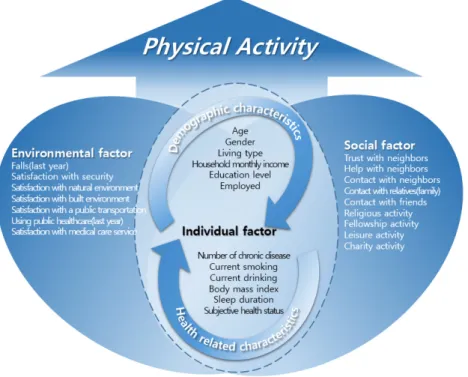
Figure 1. Conceptual framework of this study.
3. Conceptual Framework
The conceptual framework of this study was based on the social ecological model. This model has five hierar-chical levels of individual, interpersonal, community, or-ganizational, and policy/enabling environments, and it also has the concept of expansion from individuals to soci-ety [18]. Since this model presents a comprehensive sys-tem for understanding the effects of various levels on physical activity, it has been used as an effective theoret-ical basis in several previous studies on phystheoret-ical activity [19]. Since the use of the data from the Community Health Survey involves limitations in linking variables in relation to organizational and policy areas with data obtained from a questionnaire survey on health behaviors related to chronic diseases, a modified conceptual model reflecting individual, social, and environmental factors was con-structed (Figure 1).
METHODS
1. Study Design
This study is a descriptive research to investigate indivi-dual, social, and environmental factors related to physical activities among older adults in urban and non-urban areas and to identify influencing factors for physical activity.
2. Participants
This study used data from the 2017 Community Health Survey among 228,381 adults aged 19 and older. The sam-ples of the Community Health Survey were extracted by the complex sampling design method, and the informa-tion on the elements of complex sampling design, such as sampling weight, stratified variables, and clustered varia-bles, is included in the raw data. If analysis is conducted by selecting or deleting some part of the data instead of us-ing the total data, the standard error bias of the estimate may occur due to the omission of information on complex sampling design included in the deleted data. Therefore, among the total respondents, older adults aged 65 and older without missing data were first selected, and 23,043 elderly people in urban areas and 34,063 elderly people in non-urban areas were designated as subpopulations. Then, data of the subpopulations was used without further de-leting other data.
3. Research variables
The research variables used in this study were individual, social, and environmental factors including sociodemo-graphic and health-related characteristics which were se-lected among variables available in the Community Health Survey data by referring to the items reported as factors
re-lated to physical activity in previous studies [3,5-9,14,15]. 1) Individual factors
Individual factors included sociodemographic and health-related characteristics. Sociodemographic charac-teristics analyzed in this study were age, gender, residen-tial area, household type, household income, education level, and the presence or absence of economic activity. Regarding the residential area, the variables of dong/eup
․ myeon administrative units were used to classify
resi-dential areas into urban and non-urban areas. In other words, when the place of residence was a 'dong', it was classified as an urban area, and when the place of resi-dence was a 'eup' or 'myeon', it was classified as an non-urban area. In addition, the type of household was re-classified into 'single-person households' and 'multi-per-son households'.
Health-related characteristics examined in this study were as follows: the number of diseases diagnosed among the five chronic diseases of high blood pressure, diabetes, dyslipidemia, arthritis, and cataract, current smoking sta-tus, current drinking stasta-tus, body mass index (BMI), daily sleep duration and subjective health status. Regarding BMI (kg/m2), people with a BMI (kg/m2) of less than 18.5 were reclassified as the 'underweight' group, those with a BMI of 18.5 to less than 25 as the 'normal weight' group, and those with a BMI of 25 or more as the 'obese' group. 2) Social factors
Social factors analyzed in this study were as follows: trust between neighbors, exchanges of help among neigh-bors, social networks assessed by measuring the frequency of meetings with neighbors, relatives (family members) and friends, and regular participation in each type of social ac-tivity at least once per month for social activities such as religious activities, socializing activities, leisure activities, and charitable activities.
3) Environmental factors
Environmental factors examined in this study were as follows: the experience of a fall in the past year, overall safety level, satisfaction with the natural environment, sat-isfaction with living conditions, satsat-isfaction with public transportation, the use of public health facilities such as public health centers (primary health care centers) or branch offices of public health centers, and satisfaction with medical services.
4) Physical activity
The amount of physical activity was expressed as
Meta-bolic equivalent-minutes per week (MET-minutes/week) [15], which was calculated using the time spent perform-ing intense physical activity, moderate physical activity, and walking and the number of days per week when phys-ical activity is performed. Based on MET-minutes/week, participants were classified into the inactive, minimally active, and health-enhancing physical activity groups. The 'inactive' group are people who do not belong to the mini-mally active group or the health-enhancing physical activ-ity group because they perform the least physical activactiv-ity. Individuals classified as the 'minimally active' group are those who perform vigorous physical activity for at least 20 minutes a day for at least 3 days a week, or moderate physical activity or walking for at least 30 minutes a day for at least 5 days a week, or total physical activity of 600 or more MET-min/week over 5 or more days a week by per-forming walking, moderate physical activity, or intense physical activity. The 'health-enhancing physical activity' group' is the most desirable physical activity group, and people classified as this group are those who perform vig-orous physical activity of a total of 1,500 or more METmin/ week for at least 3 days per week or those who consume a total of 3,000 or more MET-min/ week through walking, moderate physical activity, or vigorous physical activity for at least 3 days per week [15].
4. Data Collection and Analysis
The Community Health Survey is a cross-sectional study using multi-stage area probability sampling by the two- stage stratified two-stage cluster systematic sampling method. After stratification of dividing the population in-to regions, administrative units (dong/eup ․ myeon), and residential types (apartment/single house) to represent all the regions and the entire population in the country, sam-ple households are extracted proportionally to the number of households in the population of each strata by the sys-tematic sampling method. The data is collected on the se-lected households and all members of those households through interviews and the Community Health Survey (CHS) data is publicly available data. Therefore, this study was conducted using the 2017 CHS data after the inves-tigators signed the agreement for access to personal in-formation for research or statistical purposes and sub-mitted a plan on the use of CHS data to request the data.
5. Statistical Analysis
Data analysis was carried out using IBM SPSS Statistics 23.0 by applying an analysis method for complex sample
survey data considering the strata, cluster and weights. A x2 test was conducted to examine differences in individual, social and environmental factors and physical activity in older adults between urban and non-urban areas. Partici-pants were divided into the inactive, minimally active, and health-enhancing physical activity groups according to the amount of physical activity, and the level of physical activity was set as the dependent variable. Based on the re-sults of previous studies [3,5-9,14,15], individual, social, and environmental factors which were expected to affect physical activity were entered into the logistic regression model to calculate the odds ratios and determine stat-istical significance with a 95% confidence interval. A value of p<.05 was considered statistically significant.
6. Ethical Considerations
This study was conducted after receiving an exemption determination from the IRB of Catholic University of Pusan (IRB No. 2019-01-009) for the secondary analysis of the 2017 Community Health Survey data that was collected after obtaining informed consent from all participants pri-or to data collection.
RESULTS
1. Individual, Social and Environmental Factors and
Physical Activity of Participants
The analysis results of differences in individual, social, and environmental factors and physical activities between older adults in urban and non-urban areas are shown in Table 1. In terms of demographic and sociological charac-teristics among individual factors, there were statistically significant differences between the two groups in age, household type, household income, educational level and economic activity, except for gender (p<.001). As for health-related characteristics, the percentages of people with multimorbidity of chronic diseases, current drinkers and obese people were 1.9%, 5.5%, and 3.6% higher, re-spectively, among older adults in urban areas than those in non-urban areas. The percentage of older adults with a daily sleep duration of less than 6 hours was 4.0 percent higher among older adults in urban areas than in non-ur-ban areas.
With respect to social factors, the level of trust among neighbors and exchanges of help among neighbors were 16.6% and 38.0% higher, respectively, in older adults in non-urban areas than those in urban areas. The propor-tions of older adults who reported meeting with
neigh-bors, relatives (family members) and friends two or more times a week were 33.8%, 8.0%, and 5.3% higher, respec-tively, in non-urban areas than in urban areas. On the oth-er hand, the poth-ercentage of oldoth-er adults regularly partic-ipating in social activities at least once a month for social activities, such as religious activities, socializing activities, leisure activities and charitable activities, was higher in urban areas.
As for environmental factors, the levels of satisfaction with living conditions, public transportation and medical services were 1.5%, 15.8%, and 14.7% higher, respectively, among older adults in urban areas than those in non-ur-ban areas. On the other hand, the percentage of people sat-isfied with the natural environment was 7.4% higher among older adults in non-urban areas, and the utilization rate of public health institutions was also 31.5% higher among older adults in non-urban areas, compared to those in urban areas. In terms of physical activity, among older adults in urban areas, the minimally active group con-stituted the largest proportion (49.6%), but among older adults in urban areas, the inactive group accounted for the largest proportion (53.4%).
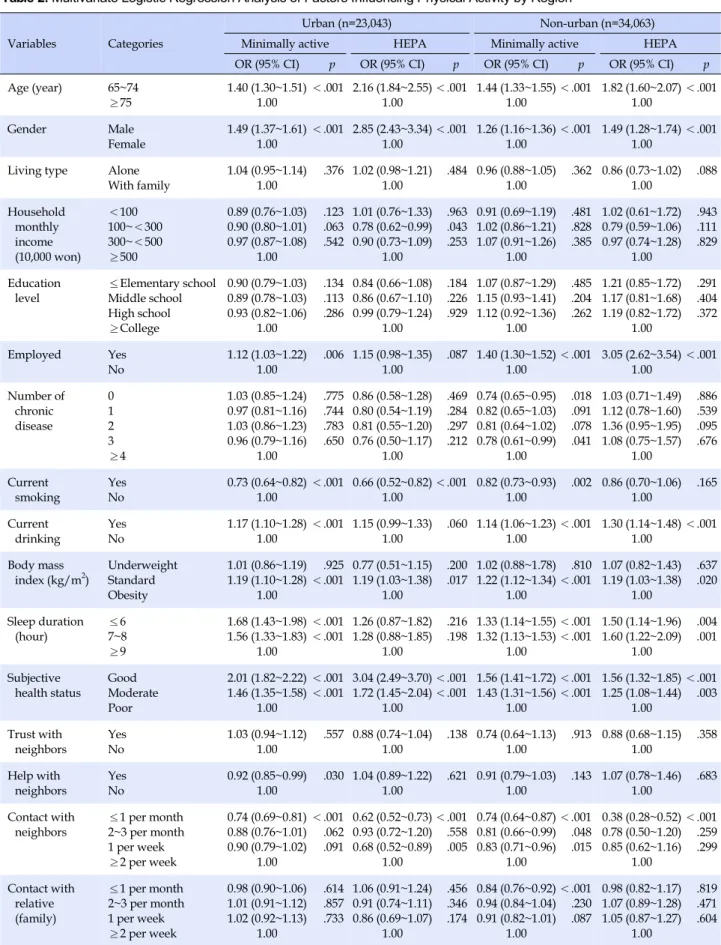
2. Influencing Factors for Physical Activity in Urban
Older Adults
A multiple logistic regression analysis was performed to examine factors influencing physical activity in older adults in urban areas. As a result, among individual fac-tors, age, gender, economic activity, current smoking sta-tus, current drinking stasta-tus, obesity level, sleep duration and subjective health status were identified as significant influencing factors. Regarding social factors, exchanges of help among neighbors, the frequencies of meeting with neighbors and friends, and regular participation in reli-gious, socializing, and leisure activities were found to be significant influencing factors. As for environment factors, the experience of a fall within the past year, satisfaction with the living conditions, satisfaction with public trans-portation, and the use of public health facilities were found to be significant influencing factors (Table 2).
With respect to individual factors, smokers were 0.73 times less likely to be in the inactive group than non-smok-ers (95% CI=0.64~0.82), while drinknon-smok-ers were 1.17 times more likely to be in the inactive group than non-smokers (95% CI=1.10~1.28). Regarding the degree of obesity as-sessed by the body mass index, the normal weight group was 1.19 times more likely to be in the inactive group (95% CI=1.10~1.28) and in the health-enhancing physical activ-ity group (95% CI=1.03~1.38), compared to the obese group.
Table 1. Individual, Social, Environmental Factors, and Physical Activity among the Older Adults by Regions (N=57,106)
Variables Characteristics Categories M±SD
Urban (n=23,043) Non-urban (n=34,063) x2(p) n†(%)‡ or M±SD‡ n†(%)‡ or M±SD‡ Individual Demographic characteristics Age (year) 65~74 ≥75 73.40±0.40 14,232 8,811 (62.5) (37.5) 18,066 15,997 (54.4) (45.6) 317.22 (<.001) 73.09±0.51 74.19±0.52 Gender Male Female 10,051 12,992 (45.3) (54.7) 15,124 18,939 (45.8) (54.2) 1.10 (.233)
Living type Alone
With family 4,715 18,328 (17.8) (82.2) 8,899 25,164 (22.5) (77.5) 163.23 (<.001) Household monthly income (10,000 won) <100 100~<300 300~<500 ≥500 1,777 8,597 9,454 3,215 (9.5) (32.9) (41.8) (15.7) 889 19,381 11,451 2,342 (4.3) (52.6) (34.2) (8.9) 2,081.01 (<.001)
Education level ≤Elementary school Middle school High school ≥College 11,501 4,199 4,913 2,430 (46.6) (18.3) (22.6) (12.4) 24,600 4,552 3,697 1,214 (68.2) (14.3) (12.9) (4.5) 2,356.86 (<.001) Employed Yes No 5,897 17,146 (24.3) (75.7) 17,198 16,865 (44.2) (55.8) 2,171.47 (<.001) Health related characteristics Number of chronic disease 0 1 2 3 ≥4 1.38±0.06 5,493 7,422 6,237 3,153 738 (24.2) (32.1) (26.8) (13.8) (3.1) 8,376 11,609 9,044 4,126 908 (24.6) (33.6) (26.5) (12.5) (2.8) 26.88 (<.001) 1.40±0.08 1.35±0.09 Current smoking Yes No 2,144 20,899 (9.1) (90.9) 3,103 30,960 (9.7) (90.3) 4.81 (.061) Current drinking Yes No 10,817 12,226 (48.1) (51.9) 13,905 20,158 (42.6) (57.4) 140.36 (<.001) Body mass
index (kg/m2) UnderweightNormal Obesity 1,034 15,879 6,130 (4.2) (68.9) (26.9) 2,582 23,890 7,591 (7.2) (69.5) (23.3) 253.63 (<.001) Sleep duration (hour) ≤6 7~8 ≥9 6.44±0.09 12,107 9,891 1,045 (52.5) (42.9) (4.5) 16,059 16,033 1,971 (48.5) (45.6) (5.9) 97.23 (<.001) 6.41±0.11 6.52±0.12 Subjective health status Good Moderate Poor 4,852 9,123 9,068 (22.3) (40.0) (37.6) 6,417 11,764 15,882 (19.3) (35.3) (45.4) 288.83 (<.001)
Social Trust with
neighbors Yes No 16,247 6,796 (68.0) (32.0) 30,065 3,998 (84.6) (15.4) 1,575.98 (<.001) Help with neighbors Yes No 11,966 11,077 (46.9) (53.1) 30,796 3,267 (84.9) (15.1) 6,749.20 (<.001) HEPA=health enhancing physical activity; †
Unweighted; ‡
Table 1. Individual, Social, Environmental Factors, and Physical Activity among the Older Adults by Regions (Continued) (N=57,106)
Variables Characteristics Categories M±SD
Urban (n=23,043) Non-urban (n=34,063) x2(p) n†(%)‡ or M±SD‡ n†(%)‡ or M±SD‡
Social Contact with
neighbors ≤1 per month 2~3 per month 1 per week ≥2 per week 8,210 1,546 1,829 11,458 (39.9) (6.8) (8.2) (45.1) 2,551 1,136 1,736 28,590 (11.8) (3.8) (5.5) (78.9) 5,517.45 (<.001) Contact with relatives (family) ≤1 per month 2~3 per month 1 per week ≥2 per week 6,667 3,263 3,351 9,762 (29.7) (14.6) (14.5) (41.2) 6,832 4,462 5,181 17,588 (21.7) (13.3) (15.9) (49.2) 468.78 (<.001) Contact with friends ≤1 per month 2~3 per month 1 per week ≥2 per week 9,353 2,585 2,211 8,894 (41.3) (11.6) (9.9) (37.2) 13,959 3,085 2,477 14,542 (41.0) (9.1) (7.4) (42.5) 232.99 (<.001) Religious activity Yes No 8,767 14,276 (39.2) (60.8) 9,329 24,734 (29.6) (70.4) 457.54 (<.001) Fellowship activity Yes No 12,783 10,260 (55.1) (44.9) 16,472 17,591 (48.8) (51.2) 183.21 (<.001) Leisure activity Yes No 4,737 18,306 (21.6) (78.4) 3,823 30,240 (12.0) (88.0) 680.90 (<.001) Charity activity Yes No 1,509 21,534 (6.7) (93.3) 1,367 32,696 (4.0) (96.0) 146.51 (<.001) Environmental Falls (last year) Yes
No 4,056 18,987 (17.6) (82.4) 5,789 28,274 (17.8) (82.2) 0.29 (.650) Satisfaction with security Yes No 19,455 3,588 (83.8) (16.2) 31,682 2,381 (91.2) (8.8) 515.29 (<.001) Satisfaction with natural environment Yes No 18,872 4,171 (81.3) (18.7) 31,216 2,847 (89.7) (10.3) 579.12 (<.001) Satisfaction with built environment Yes No 20,497 2,546 (89.1) (10.9) 30,443 3,620 (87.6) (12.4) 27.44 (<.001) Satisfaction with a public transportation Yes No 19,274 3,769 (84.6) (15.4) 24,200 9,863 (68.8) (31.2) 1,789.36 (<.001) Using public healthcare (last year) Yes No 10,773 12,270 (44.3) (55.7) 28,008 6,055 (75.8) (24.2) 4,555.80 (<.001) Satisfaction with medical care service Yes No 19,496 3,547 (85.9) (14.1) 25,251 8,812 (71.2) (28.8) 1,657.35 (<.001) Physical activity Physical
activity Inactive Minimally active HEPA 10,391 11,203 1,449 (43.8) (49.6) (6.6) 18,199 13,065 2,799 (53.4) (38.4) (8.2) 481.55 (<.001) HEPA=health enhancing physical activity; †
Unweighted; ‡
Table 2. Multivariate Logistic Regression Analysis of Factors Influencing Physical Activity by Region Variables Categories
Urban (n=23,043) Non-urban (n=34,063)
Minimally active HEPA Minimally active HEPA
OR (95% CI) p OR (95% CI) p OR (95% CI) p OR (95% CI) p Age (year) 65~74 ≥75 1.40 (1.30~1.51) 1.00 <.001 2.16 (1.84~2.55) 1.00 <.001 1.44 (1.33~1.55) 1.00 <.001 1.82 (1.60~2.07) 1.00 <.001 Gender Male Female 1.49 (1.37~1.61) 1.00 <.001 2.85 (2.43~3.34) 1.00 <.001 1.26 (1.16~1.36) 1.00 <.001 1.49 (1.28~1.74) 1.00 <.001 Living type Alone
With family 1.04 (0.95~1.14) 1.00 .376 1.02 (0.98~1.21) 1.00 .484 0.96 (0.88~1.05) 1.00 .362 0.86 (0.73~1.02) 1.00 .088 Household monthly income (10,000 won) <100 100~<300 300~<500 ≥500 0.89 (0.76~1.03) 0.90 (0.80~1.01) 0.97 (0.87~1.08) 1.00 .123 .063 .542 1.01 (0.76~1.33) 0.78 (0.62~0.99) 0.90 (0.73~1.09) 1.00 .963 .043 .253 0.91 (0.69~1.19) 1.02 (0.86~1.21) 1.07 (0.91~1.26) 1.00 .481 .828 .385 1.02 (0.61~1.72) 0.79 (0.59~1.06) 0.97 (0.74~1.28) 1.00 .943 .111 .829 Education level ≤Elementary school Middle school High school ≥College 0.90 (0.79~1.03) 0.89 (0.78~1.03) 0.93 (0.82~1.06) 1.00 .134 .113 .286 0.84 (0.66~1.08) 0.86 (0.67~1.10) 0.99 (0.79~1.24) 1.00 .184 .226 .929 1.07 (0.87~1.29) 1.15 (0.93~1.41) 1.12 (0.92~1.36) 1.00 .485 .204 .262 1.21 (0.85~1.72) 1.17 (0.81~1.68) 1.19 (0.82~1.72) 1.00 .291 .404 .372 Employed Yes No 1.12 (1.03~1.22) 1.00 .006 1.15 (0.98~1.35) 1.00 .087 1.40 (1.30~1.52) 1.00 <.001 3.05 (2.62~3.54) 1.00 <.001 Number of chronic disease 0 1 2 3 ≥4 1.03 (0.85~1.24) 0.97 (0.81~1.16) 1.03 (0.86~1.23) 0.96 (0.79~1.16) 1.00 .775 .744 .783 .650 0.86 (0.58~1.28) 0.80 (0.54~1.19) 0.81 (0.55~1.20) 0.76 (0.50~1.17) 1.00 .469 .284 .297 .212 0.74 (0.65~0.95) 0.82 (0.65~1.03) 0.81 (0.64~1.02) 0.78 (0.61~0.99) 1.00 .018 .091 .078 .041 1.03 (0.71~1.49) 1.12 (0.78~1.60) 1.36 (0.95~1.95) 1.08 (0.75~1.57) 1.00 .886 .539 .095 .676 Current smoking Yes No 0.73 (0.64~0.82) 1.00 <.001 0.66 (0.52~0.82) 1.00 <.001 0.82 (0.73~0.93) 1.00 .002 0.86 (0.70~1.06) 1.00 .165 Current drinking Yes No 1.17 (1.10~1.28) 1.00 <.001 1.15 (0.99~1.33) 1.00 .060 1.14 (1.06~1.23) 1.00 <.001 1.30 (1.14~1.48) 1.00 <.001 Body mass
index (kg/m2) UnderweightStandard Obesity 1.01 (0.86~1.19) 1.19 (1.10~1.28) 1.00 .925 <.001 0.77 (0.51~1.15) 1.19 (1.03~1.38) 1.00 .200 .017 1.02 (0.88~1.78) 1.22 (1.12~1.34) 1.00 .810 <.001 1.07 (0.82~1.43) 1.19 (1.03~1.38) 1.00 .637 .020 Sleep duration (hour) ≤6 7~8 ≥9 1.68 (1.43~1.98) 1.56 (1.33~1.83) 1.00 <.001 <.001 1.26 (0.87~1.82) 1.28 (0.88~1.85) 1.00 .216 .198 1.33 (1.14~1.55) 1.32 (1.13~1.53) 1.00 <.001 <.001 1.50 (1.14~1.96) 1.60 (1.22~2.09) 1.00 .004 .001 Subjective health status Good Moderate Poor 2.01 (1.82~2.22) 1.46 (1.35~1.58) 1.00 <.001 <.001 3.04 (2.49~3.70) 1.72 (1.45~2.04) 1.00 <.001 <.001 1.56 (1.41~1.72) 1.43 (1.31~1.56) 1.00 <.001 <.001 1.56 (1.32~1.85) 1.25 (1.08~1.44) 1.00 <.001 .003 Trust with neighbors Yes No 1.03 (0.94~1.12) 1.00 .557 0.88 (0.74~1.04) 1.00 .138 0.74 (0.64~1.13) 1.00 .913 0.88 (0.68~1.15) 1.00 .358 Help with neighbors Yes No 0.92 (0.85~0.99) 1.00 .030 1.04 (0.89~1.22) 1.00 .621 0.91 (0.79~1.03) 1.00 .143 1.07 (0.78~1.46) 1.00 .683 Contact with neighbors ≤1 per month 2~3 per month 1 per week ≥2 per week 0.74 (0.69~0.81) 0.88 (0.76~1.01) 0.90 (0.79~1.02) 1.00 <.001 .062 .091 0.62 (0.52~0.73) 0.93 (0.72~1.20) 0.68 (0.52~0.89) 1.00 <.001 .558 .005 0.74 (0.64~0.87) 0.81 (0.66~0.99) 0.83 (0.71~0.96) 1.00 <.001 .048 .015 0.38 (0.28~0.52) 0.78 (0.50~1.20) 0.85 (0.62~1.16) 1.00 <.001 .259 .299 Contact with relative (family) ≤1 per month 2~3 per month 1 per week ≥2 per week 0.98 (0.90~1.06) 1.01 (0.91~1.12) 1.02 (0.92~1.13) 1.00 .614 .857 .733 1.06 (0.91~1.24) 0.91 (0.74~1.11) 0.86 (0.69~1.07) 1.00 .456 .346 .174 0.84 (0.76~0.92) 0.94 (0.84~1.04) 0.91 (0.82~1.01) 1.00 <.001 .230 .087 0.98 (0.82~1.17) 1.07 (0.89~1.28) 1.05 (0.87~1.27) 1.00 .819 .471 .604 HEPA=health enhancing physical activity; OR=odds ratio; CI=confidence interval.
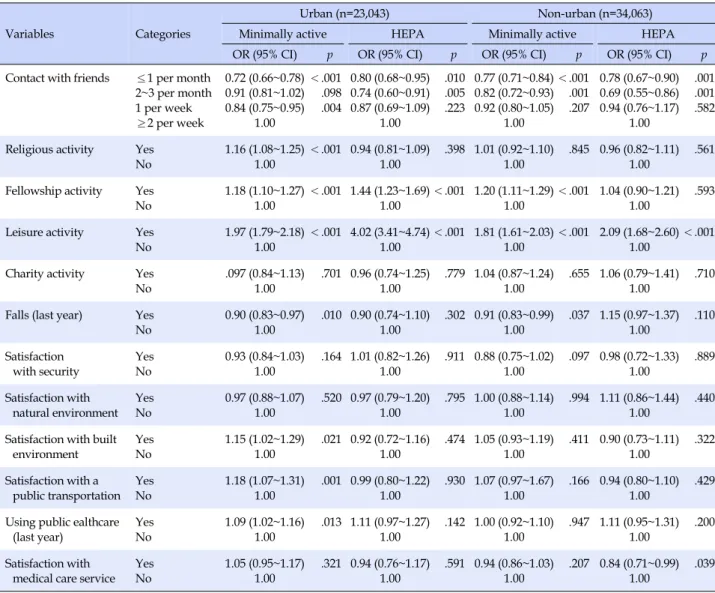
Table 2. Multivariate Logistic Regression Analysis of Factors Influencing Physical Activity by Region (Continued)
Variables Categories
Urban (n=23,043) Non-urban (n=34,063)
Minimally active HEPA Minimally active HEPA
OR (95% CI) p OR (95% CI) p OR (95% CI) p OR (95% CI) p Contact with friends ≤1 per month
2~3 per month 1 per week ≥2 per week 0.72 (0.66~0.78) 0.91 (0.81~1.02) 0.84 (0.75~0.95) 1.00 <.001 .098 .004 0.80 (0.68~0.95) 0.74 (0.60~0.91) 0.87 (0.69~1.09) 1.00 .010 .005 .223 0.77 (0.71~0.84) 0.82 (0.72~0.93) 0.92 (0.80~1.05) 1.00 <.001 .001 .207 0.78 (0.67~0.90) 0.69 (0.55~0.86) 0.94 (0.76~1.17) 1.00 .001 .001 .582 Religious activity Yes
No 1.16 (1.08~1.25) 1.00 <.001 0.94 (0.81~1.09) 1.00 .398 1.01 (0.92~1.10) 1.00 .845 0.96 (0.82~1.11) 1.00 .561 Fellowship activity Yes
No 1.18 (1.10~1.27) 1.00 <.001 1.44 (1.23~1.69) 1.00 <.001 1.20 (1.11~1.29) 1.00 <.001 1.04 (0.90~1.21) 1.00 .593 Leisure activity Yes
No 1.97 (1.79~2.18) 1.00 <.001 4.02 (3.41~4.74) 1.00 <.001 1.81 (1.61~2.03) 1.00 <.001 2.09 (1.68~2.60) 1.00 <.001 Charity activity Yes
No .097 (0.84~1.13) 1.00 .701 0.96 (0.74~1.25) 1.00 .779 1.04 (0.87~1.24) 1.00 .655 1.06 (0.79~1.41) 1.00 .710 Falls (last year) Yes
No 0.90 (0.83~0.97) 1.00 .010 0.90 (0.74~1.10) 1.00 .302 0.91 (0.83~0.99) 1.00 .037 1.15 (0.97~1.37) 1.00 .110 Satisfaction with security Yes No 0.93 (0.84~1.03) 1.00 .164 1.01 (0.82~1.26) 1.00 .911 0.88 (0.75~1.02) 1.00 .097 0.98 (0.72~1.33) 1.00 .889 Satisfaction with natural environment Yes No 0.97 (0.88~1.07) 1.00 .520 0.97 (0.79~1.20) 1.00 .795 1.00 (0.88~1.14) 1.00 .994 1.11 (0.86~1.44) 1.00 .440 Satisfaction with built
environment Yes No 1.15 (1.02~1.29) 1.00 .021 0.92 (0.72~1.16) 1.00 .474 1.05 (0.93~1.19) 1.00 .411 0.90 (0.73~1.11) 1.00 .322 Satisfaction with a public transportation Yes No 1.18 (1.07~1.31) 1.00 .001 0.99 (0.80~1.22) 1.00 .930 1.07 (0.97~1.67) 1.00 .166 0.94 (0.80~1.10) 1.00 .429 Using public ealthcare
(last year) Yes No 1.09 (1.02~1.16) 1.00 .013 1.11 (0.97~1.27) 1.00 .142 1.00 (0.92~1.10) 1.00 .947 1.11 (0.95~1.31) 1.00 .200 Satisfaction with
medical care service Yes No 1.05 (0.95~1.17) 1.00 .321 0.94 (0.76~1.17) 1.00 .591 0.94 (0.86~1.03) 1.00 .207 0.84 (0.71~0.99) 1.00 .039 HEPA=health enhancing physical activity; OR=odds ratio; CI=confidence interval.
In terms of daily sleep duration, the normal sleeping group with a sleep duration of 7~8 hours per day was 1.56 times more likely to belong to the inactive group than the over-sleeping group with a sleep duration of 9 hours or more per day (95% CI=1.33~1.83).
With respect to social factors, older adults meeting with neighbors less than once per month were 0.74 times less like-ly to belong to the minimallike-ly active group (95% CI=0.69~0.81) and 0.62 times less likely to belong to the health-enhancing physical activity group (95% CI=0.52~0.73), compared to those who met with neighbors two or more times a week. Older adults participating in religious activities were 1.16 times more likely to belong to the minimally active group (95% CI=1.08~1.25) than those who did not. Also, older adults participating in socializing activities were 1.18 times more likely to belong to the minimally active group (95% CI=1.10~1.27) and 1.44 times more likely to belong to the
health-enhancing physical activity group (95% CI=1.23~ 1.69) than those who did not. In addition, older adults par-ticipating in leisure activities were 1.97 times more likely to belong to the minimally active group (95% CI=1.79~2.18) and 4.02 times more likely to belong to the health-enhanc-ing physical activity group (95% CI=3.41~4.74) than those who did not.
In terms of environmental factors, those who had expe-rienced a fall in the past year were 0.90 times less likely to belong to the inactive group than those who did not (95% CI=0.83~0.97). Older adults who were satisfied with their living conditions were 1.15 times more likely to belong to the minimally active group than those who were not (95% CI=1.02~1.29), and those satisfied with public transpor-tation were 1.18 times more likely to belong to the mini-mally active group than those who were not (95% CI=1.07~ 1.31). In addition, older adults using public health
facili-ties were 1.09 times more likely to be in the minimally ac-tive group than those who did not (95% CI=1.02~1.16).
3. Influencing Factors for Physical Activity in Non-urban
Older Adults
The multiple logistic regression analysis was performed to analyze factors influencing physical activity among old-er adults in non-urban areas, and the results showed that among individual factors, age, gender, economic activity, the number of chronic diseases, current smoking status, current drinking status, obesity level, sleep duration, and subjective health status were identified as significant in-fluencing factors. As for social factors, the frequencies of meeting with neighbors, family and friends and the regu-lar participation in socializing and leisure activities were identified as influencing factors. Regarding environmental factors, the experience of a fall within the past year and satisfaction with medical services were found to affect physical activity in non-urban older adults (Table 2).
In terms of individual factors, those without chronic diseases were 0.74 times less likely to belong to the mini-mally active group (95% CI=0.65~0.95) than those with 4 or more chronic diseases. Among older adults, smokers were 0.82 times less likely to belong to the minimally active group than non-smokers (95% CI=0.73~0.93), whereas drinkers were 1.14 times more likely (95% CI=1.06~1.23) and 1.30 times more likely (95% CI=1.14~1.48) to belong to the min-imally active group and the health-enhancing physical ac-tivity group than non-drinkers. In terms of the degree of obesity, the normal weight group was 1.22 times more like-ly to belong to the minimallike-ly active group (95% CI=1.12~ 1.34) and 1.19 times more likely to belong to the health-en-hancing physical activity group (95% CI=1.03~1.38), re-spectively, compared to the obese group. Regarding the daily sleep duration, the normal sleeping group with an average sleep duration of 7~8 hours was 1.32 times more likely to belong to the minimally active group (95% CI= 1.13~1.53) and 1.60 times more likely to belong to the health-enhancing physical activity group (95% CI=1.22~ 2.09), compared to the oversleeping group with a sleep du-ration of 9 hours or more.
In terms of social factors, when the frequency of meet-ing between neighbors was less than once a month, the likelihoods of belonging to the minimum activity group and the health-enhancing physical activity group were 0.74 times (95% CI=0.64~0.87) and 0.38 times lower (95% CI=0.28~0.52), respectively, compared to when the fre-quency of meeting between neighbors was two or more times a week. Older adults who participated in social
ac-tivities were 1.20 times more likely to belong to the mini-mally active group than those who did not (95% CI=1.11 ~1.29). Also, older adults who participated in leisure activ-ities were 1.81 times more likely to belong to the minimally active group (95% CI=1.61~2.03) and 2.09 times more likely to belong to the health-enhancing physical activity group (95% CI=1.68~2.60) than those who did not.
Regarding environmental factors, older adults who had experienced a fall in the past year were 0.91 times less likely to belong to the minimally active group (95% CI=0.83~0.99) than those without the experience of falls. Older adults who were satisfied with medical services were 0.84 times more likely to belong to the health-enhancing physical activity group than the inactive group (95% CI=0.71~0.99).
DISCUSSION
This study aimed to identify differences in individual, social, and environmental factors between older adults re-siding in urban and non-urban areas, and to identify fac-tors that affect the physical activities of older adults by re-gion by using data from the 2017 Community Health Sur-vey in order to provide basic data for the development of community programs to promote physical activity in old-er adults and for the exploration of strategies to create a so-cial environment to reduce health inequalities between regions.
Regarding the health-related characteristics of older adults in urban and non-urban areas, the prevalence of multimorbidity and the percentages of the drinking group and the obese group related to undesirable lifestyle habits were higher among urban older adults. These findings were consistent with those of prior studies in Korea [11, 12], which reported that the prevalence of major chronic diseases was higher among urban or metropolitan older adults than rural older adults, but the results were incon-sistent with the findings of a foreign study [14], which found that the prevalence of multimorbidity was higher among rural older adults. Considering the health care sys-tem of Korea, this disagreement in study results can be at-tributed to the fact that the use of medical services is not constrained by a high financial burden in Korea because of low medical costs due to the National Health Insurance system [20] and that since urban areas provide greater ease of use for medical institutions and higher accessibility to them than rural areas [11], the percentage of older adults who get an early diagnosis and management of dis-eases through regular health check-ups or visits to hospi-tals is higher in urban areas than rural areas. In contrast with the findings of this study, some previous studies
[12,21] reported that there was no difference between resi-dential areas in the drinking or smoking rate. The body mass index can be affected by factors related to dietary be-havior or weight control attempts, so these factors should also be considered in future studies. As for daily sleep du-ration, the percentage of under-sleeping people with a dai-ly sleep duration of less than 6 hours was higher among urban older adults than non-urban older adults, while the percentage of people sleeping 7 hours or longer was high-er among oldhigh-er adults in rural areas than those in urban areas. These findings are thought to be due to the fact that the characteristic living conditions of rural communities affect sleep duration in rural older adults of whom a high percentage are engaged in agriculture. In the case of older adults in urban areas, it is thought that their sleep duration is affected by the social atmosphere of enjoying a lot of lei-sure activities in the evening and environmental factors due to higher levels of noise in urban areas [22].
With respect to social factors, the proportion of social networks, such as trust and exchanges of help among neighbors and the frequency of meetings with neighbors, relatives (family members), and friends, was higher among non-urban older adults, while the proportion of social ac-tivities such as religious, socializing, leisure and charitable activities was higher among urban older adults. These findings are considered to be largely consistent with the results of a prior study [13], which reported that rural old-er adults living along with their neighbors have a bettold-er peer relationship while urban older adults have more op-portunities for leisure activities since they have more time to spare compared to rural adults who are busy with farm-ing. Regarding the environmental factors, older adults in non-urban areas showed greater use of health institutions compared to those in urban areas, while the level of sat-isfaction with medical services was higher among older adults in urban areas. In other words, considering that while older adults in urban areas show greater use of sec-ondary and tertiary medical institutions such as general hospitals, older adults in non-urban areas show greater use of primary medical institutions such as public health centers and their branch offices [11], the analysis results of this study are thought to reflect the differences in the size and type of health care institutions used and the health care services offered.
As for physical activity, 55.2 percent of urban older adults and 46.6 percent of non-urban older adults were found to perform at least minimal physical activities, in-dicating that the practice rate of physical activity is higher among older adults in urban areas than those in non-ur-ban areas. This finding is consistent with a previous study
[23], which reported that urban older adults showed a higher level of physical activity. Although physical activ-ity is one of the major areas which require improvements among health promotion behaviors for older adults [23], differences in physical activity levels found in this study are thought to be due to the fact that the health infrastruc-ture for the promotion of physical activity is concentrated in urban areas and the proportion of people spending time on activities to earn a living such as agriculture is higher among non-urban older adults.
Individual factors affecting the physical activity of old-er adults common to both urban and nonurban areas wold-ere found to be age, gender, economic activity, current smok-ing status, current drinksmok-ing status, degree of obesity, sleep duration and subjective health status. In this study, it was found that current smokers, current drinkers, and those who rated their subjective health status as good were sig-nificantly more likely to be in the physical activity group than in the inactive group, which is inconsistent with the results of a previous study [14]. In addition, the current smoker group, the obese group, and the poor subjective health status group were significantly less likely to be in the physical activity group than in the inactive group. In consideration of these results, it is urgently needed to de-velop and apply community-oriented health promotion programs that take into account the characteristics and en-vironmental factors of older adult groups according to re-gions in order to increase physical activity in older adults focusing on older adults who practice relatively fewer health promotion behaviors.
Among older adults in non-urban areas, the group with no chronic diseases and the group with three or more chronic diseases were significantly less likely to belong to the minimally active group than the inactive group, com-pared to the group with four or more chronic diseases. In this regard, older adults tend to assess their health con-ditions favorably [25], and in the case of older adults with-out chronic diseases, their excessive confidence in their health is thought to hinder them from getting motivated to promote their health status, which may be a factor influ-encing the reduction in physical activity. However, in old-er adults in urban areas, the numbold-er of chronic diseases was found to have no significant impact on physical activ-ity, and these results suggest that physical activity may be affected by differences in other social and environmental factors between urban and non-urban areas, so a follow- up study is needed to confirm them.
Common social factors affecting physical activities in both urban and non-urban older adults were found to be exchanges of help among neighbors, frequencies of
meet-ing with neighbors and friends, and regular participation in socializing and leisure activities. In particular, lower frequencies of meeting with neighbors and friends were associated with a lower likelihood of being in the physical activity group. However, considering that the frequency of meeting with relatives or family members was found to have no significant impact on physical activity among ur-ban older adults, it is thought that neighbors and friends who older adults meet frequently near their residence function as an important source of social support for older adults and they have a significant effect on health promo-tion behaviors including physical activities in older adults. In the case of older adults in non-urban areas, the fre-quency of meeting with relatives was also identified as a factor affecting physical activity, showing a difference be-tween urban and nonurban older adults. This difference is thought to reflect the regional characteristics of rural areas where people live with their relatives in the same village and interact with each other in various ways [13]. In addi-tion, regular participation in social activities, that is, regu-lar participation in socializing activities and leisure activ-ities at least once a month was found to affect physical ac-tivities in older adults, and regular participation in reli-gious activities was also identified as a significant influ-encing factor among urban older adults. Therefore, it is al-so considered a useful method for promoting physical ac-tivities among older adults to encourage older adults' par-ticipation in various programs for older adults provided by facilities in the community, such as welfare centers, public health centers, and religious facilities, by promot-ing such programs so that older adults can regularly go out and maintain physical activities without staying only at home [26]. On the other hand, since the proportion of people engaged in economic activities such as agriculture is higher among older adults in non-urban areas [13], poli-cies to encourage social activities should be developed taking into account these situations.
A common environmental factor significantly affecting physical activity in both urban and non-urban older adults was the experience of a fall in the past year, and for other influencing factors, there were some differences between the two groups. Deaths from falls are reported to account for more than two-thirds of deaths caused by accidents among older adults aged 65 and older [27] and they are greatly affected by environmental factors, such as the resi-dential environment or living conditions in which older adults actually reside [28]. Therefore, the government and local governments should pay more attention to the ex-pansion of safety facilities when creating physical envi-ronments, including those of existing health-related
in-stitutions. Especially, there is a need for active discussion on welfare policies for the safety management of resident-ial environments in non-urban areas that have a higher percentage of older adults living alone, as shown in this study.
Among older adults in urban areas, satisfaction with the living conditions as well as satisfaction with public trans-portation was significantly associated with a higher like-lihood to belong to the physical activity group. These find-ings are significant because they show that not only the health status of individuals but also the neighborhood fa-cilities or environmental factors of the community affect physical activities in older adults. A previous study re-ported that older adults in rural areas have many obstacles to performing regular physical activity [29]. More specifi-cally, in rural areas, there is a lack of health service facili-ties such as gyms and welfare centers where people can perform active physical activities such as leisure activities and various sports, making it difficult for older adults to take interest in and participate in physical activities for a long time [29]. Therefore, in order to improve the health status level in older adults in non-urban areas by increas-ing their physical activity, the improvement of the neigh-borhood environments and the establishment of health-re-lated policies by local governments are required.
In addition, among older adults in urban areas, the use of public health facilities was associated with a higher like-lihood of belonging to the physical activity group. This re-sult is thought to be due to the fact that more improve-ments in lifestyle habits, including the promotion of phys-ical activities, are made in urban older adults since they are given opportunities to receive counseling on chronic dis-ease management requiring an improvement in lifestyle habits or on physical activities from professional health care providers through the use of health institutions. On the other hand, older adults in non-urban areas are more vulnerable in terms of disease management through regu-lar hospital visits or medical checkups [29], and have low-er accessibility to public health facilities such as public health centers and branch offices of public health centers, so community health policies should be developed and implemented to reduce the vunerability of rural older adults. Specifically, in order to enable non-urban older adults to maintain healthy lifestyles, including the prac-tice of physical activities, and to efficiently manage vari-ous chronic diseases, health service facilities which can fulfill the diverse needs of older adults should be expand-ed. In addition, it is necessary to increase the number of health professionals in the community, including nurses, so that appropriate exercise prescription and counseling
can be provided for older adults in non-urban areas who are relatively more vulnerable.
Unlike previous studies, this study attempted to identi-fy individual- and regional-level health determinants based on a social-ecological model and to conduct a com-prehensive analysis of individual, social and environ-mental factors affecting physical activity in older adults by region in order to elucidate compositional and contextual factors which contribute to health inequalities between regions. The results of this study can be utilized as basic data for the development of community-based health management programs for older adults which include physical activity promotion. In addition, based on the findings of the present study, community healthcare man-agement professionals will be able to take a compre-hensive approach considering various factors when they operate health promotion programs for older adults with chronic diseases.
In a prior study [3], psychological factors such as beliefs about exercise, health attitude, and depression were also reported as significant predictors of physical activity in older adults. However, in this study, psychological factors such as depression and stress were not included in the analysis, and this is one of the limitations of this study. Thus, there is a need to investigate psychological factors affecting physical activities in older adults in a follow-up study. In addition, further analysis of the data used in this study revealed that general characteristics of the sub-population groups used in the study and those of non-sub-population groups among older adults aged 65 or older were not homogeneous, so there is a limitation in general-izing the results of this study.
CONCLUSION
This study was conducted using the data from the 2017 Community Health Survey to identify differences in in-dividual, social and environmental factors between urban and non-urban older adults and to identify factors affect-ing physical activities in older adults by region. Common factors affecting physical activity in both urban and non- urban older adults were found to be current smoking sta-tus, current drinking stasta-tus, obesity level, sleep duration and subjective health status. Among social factors, ex-changes of help among neighbors, the frequencies of meet-ing with neighbors and friends, and regular participation in socializing and leisure activities were identified as com-mon influencing factors. As for environmental factors, the experience of a fall was a common influencing factor for physical activity in both urban and nonurban older adults,
but there were some regional differences. Specifically, sat-isfaction with the living conditions, satsat-isfaction with pub-lic transportation, and the use of medical services were significant factors affecting physical activity among older adults in urban areas, but they were not significant factors for physical activity among those in non-urban areas. Therefore, in order to promote physical activities among older adults in the community, it is necessary to develop strategies for health promotion programs by taking into account social and environmental factors as well as im-provements in individual factors in relation to the practice of health behaviors. In addition, since there are regional differences in the physical environment, they should also be considered in developing intervention programs. Fur-thermore, it is also necessary to develop and establish poli-cies suitable for the community at the level of local govern-ments to narrow health gaps, taking into account regional differences in population composition and diversities in terms of health indicators by identifying factors influenc-ing regional health inequalities.
ACKNOWLEDGEMENT
We would like to express our gratitude toJae-Hyun, Ha (Professor, Masan University) for designing the conceptual framework.
REFERENCES
1. Statistics Korea. Life expectancy and disability adjusted life expectancy [Internet]. Daejeon: Statistics Korea. 2017 [cited 2020 March 2]. Available from:
http://www.index.go.kr/potal/main/EachDtlPageDetail.do ?idx_cd=2758
2. Chung KH, Oh YH, Kang EN, KimJW, Sunwoo D, Oh MA, et al. A survey of Korean older persons. Sejong: Ministry of Health and Welfare, Korea Institute for Health and Social Affairs; 2014 Dec. Report No.: Policy Report 2014-61.
3. Browning C, SimsJ, Kendig H, Teshuva K. Predictors of phys-ical activity behavior in older community-dwelling adults. Journal of Allied Health. 2009;38(1):8-17.
4. World Health Organization. Health topics: physical activity [Internet]. Geneva: World Health Organization. 2017 [cited 2019 February 17] Available from:
http://www.who.int/topics/physical_activity/en/
5. McKee G, Kearney P, Kenny R. The factors associated with self-reported physical activity in older adults living in the community. Age and Ageing. 2015;44(4):586-592.
https://doi.org/10.1093/ageing/afv042
6. LeeJH. The regional health inequity, and individual and neighborhood level health determinants. Health and Social Welfare Review. 2016;36(2):345-384.
https://doi.org/10.15709/hswr.2016.36.2.345
7. Notthoff N, Reisch P, Gerstorf D. Individual characteristics and physical activity in older adults: A systematic review. Gerontology. 2017;63(5):443-459.
https://doi.org/10.1159/000475558
8. McNeill LH, Kreuter MW, Subramanian SV. Social environ-ment and physical activity: A review of concepts and evidence. Social Science & Medicine. 2006;63(4):1011-1022.
https://doi.org/10.1016/j.socscimed.2006.03.012
9. Troped PJ, Saunders RP, Pate RR, Reininger B, Addy CL. Correlates of recreational and transportation physical activity among adults in a New England community. Preventive Me-dicine. 2003;37(4):304-310.
https://doi.org/10.1016/s0091-7435(03)00137-3
10. Wilcox S, Bopp M, Oberrecht L, Kammermann SK, McElmurray CT. Psychosocial and perceived environmental correlates of physical activity in rural and older African American and white women. TheJournals of Gerontology Series B. 2003;58 (6):329-337. https://doi.org/10.1093/geronb/58.6.P329 11. LeeJ, Lee Y. Comparison of healthy life style and chronic
dis-ease management between urban and rural older adults. The KoreanJournal of Rehabilitation Nursing. 2012;15(2):100-108.
https://doi.org/10.7587/kjrehn.2012.100
12. JeonJD, Ryu SY, Han MA, ParkJ. Comparisons of health sta-tus and health behaviors among the elderly between urban and rural areas.Journal of Agricultural Medicine and Com-munity Health. 2013;38(3):182-194.
https://doi.org/10.5393/JAMCH.2013.38.3.182
13. LeeJH. Comparative study of lifestyles of seniors in urban and rural areas [master's thesis]. [Daegu]: Daegu Haany Universi-ty; 2010. 60 p.
14. Kim YM, Suh SR. Factors affecting the physical activity of older adults in the community.Journal of Korean Gerontological Nursing. 2017;19(2):154-163.
https://doi.org/10.17079/jkgn.2017.19.2.154
15. Park S, Park YH. Predictors of physical activity in Korean older adults: Distinction between urban and rural Areas.Journal of Korean Academy of Nursing. 2010;40(2):191-201.
https://doi.org/10.4040/jkan.2010.40.2.191
16. Yoon TH. To resolve the health inequality among regions. Welfare Now. 2011;157:10-14.
17. Wen M, Browning CR, Cagney KA. Poverty, affluence, and in-come inequality: Neighborhood economic structure and its implications for health. Social Science & Medicine. 2003;57(5): 843-860. https://doi.org/10.1016/s0277-9536(02)00457-4 18. McLeroy KR, Bibeau D, Steckler A, Glanz K. An ecological
per-spective on health promotion programs. Health Education Quarterly. 1988;15(4):351-377.
https://doi.org/10.1177/109019818801500401
19. Pan SY, Cameron C, Desmeules M, Morrison H, Craig CL, Jiang X. Individual, social, environmental, and physical envi-ronmental correlates with physical activity among Canadians: A cross-sectional study. BMC Public Health. 2009;9:21. https://doi.org/10.1186/1471-2458-9-21
20. Cho KS, Lee HJ. Accessibility of medical care in an elderly popul-ation. KoreanJournal of Adult Nursing. 2000;12(4):641-653. 21. HeoJH, Cho YT, Kwon SM. The effects of socioeconomic
dep-rivations on health. KoreanJournal of Sociology. 2010;44(2): 93-120.
22. Shin EY. Relationships between health status, physical activity level, health related quality of life and sleep duration in the elderly. Korean Public Health Research. 2016;42(3):53-65. 23. Deluga A, Kosicka B, Dobrowolska B, Chrzan-Rodak A,Jurek
K, Wrońska I, et al. Lifestyle of the elderly living in rural and urban areas measured by the FANTASTIC Life Inventory. An-nals of Agricultural and Environmental Medicine. 2018;25(3): 562-567. https://doi.org/10.26444/aaem/86459
24. Watson NF, Badr MS, Belenky G, Bliwise DL, Buxton OM, Buysse D, et al. Recommended amount of sleep for a healthy adult: Ajoint consensus statement of the American academy of sleep medicine and sleep research society. Sleep. 2015;38(6): 843-844. https://doi.org/10.5665/sleep.4716
25. Hassinger EW, Hicks LL, Godino V. A literature review of health issues of the rural elderly. TheJournal of Rural Health. 1993;9(1):68-75.
https://doi.org/10.1111/j.1748-0361.1993.tb00498.x
26. Park YH. Physical activity and sleep patterns in elderly who visited a community senior center.Journal of Korean Acade-my of Nursing. 2007;37(1):5-13.
https://doi.org/10.4040/jkan.2007.37.1.5
27. Sleet DA, Moffett DB, StevensJ. CDC's research portfolio in old adult fall prevention: A review of process, 1985-2005, and future research directions.Journal of Safety Research. 2008;39(3): 259-267. https://doi.org/10.1016/j.jsr.2008.05.003
28. KimJM, Lee MS, Song HJ. An analysis of risk factors for falls in the elderly by gender. Journal of Korean Society of Health Education and Promotion. 2008;25(2):1-18.
29. Pullen C, Fiandt K, Walker SN. Determinants of preventive serv-ices utilization in rural older women.Journal of Gerontological Nursing. 2001;27(1):40-51.