Introduction
Problems caused by vibrations over extended periods of time can result in hazardous working conditions for tractor drivers, and can cause them physical or health problems. Vibrations are an ongoing problem that have needed continuous attention in the field of agricultural machinery, and numerous technical innovations and performance improvements are required.
To reduce vibration in an agricultural tractor, a rubber mount is typically installed between the cabin and the cabin mount frame. However, when the rubber mount does not perform satisfactorily, an excessive ride vibration
is generated. Chung et al. (2017) developed a simulation model that could predict the ride vibration of a tractor, and it has been actively used in studies to propose optimal design values for factors affecting ride vibration. However, further studies on the results of this study are required because tests to date were based on assum-ptions regarding the dynamic characteristics of rubber mounts.
To predict ride vibration using a simulation model, the spring stiffness and damping coefficient of the seat, rubber mount, and tire affecting the vibration must be accurately determined. Information regarding the dynamic characteristics of the rubber mount are not provided by manufacturers, and only limited studies have been conducted regarding the dynamic characteristics.
Methods of determining the dynamic characteristics of
Experimental Study of the Dynamic Characteristics of Rubber Mounts for
Agricultural Tractor Cabin
Kyujeong Choi1, Jooseon Oh1, Davin Ahn1, Young-Jun Park1,2*, Sung-Un Park3, Heung-Sub Kim4 1Department of Biosystems & Biomaterials Science and Engineering, Seoul National University, Seoul, 08826, Korea 2Research Institute of Agriculture and Life Sciences, College of Agriculture and Life Sciences, Seoul National University,
Seoul, 08826, Korea
3Research and Development Institute, Tongyang Moolsan Co., Ltd. Gongju, 32530, Korea
4Department of Smart Industrial Machine Technologies, Korea Institute of Machinery and Materials, Daejeon, 34103, Korea
Received: November 4th, 2018; Revised: November 15th, 2018; Accepted: November 16th, 2018
Purpose: To obtain the dynamic characteristics (spring stiffness and damping coefficient) of a rubber mount supporting a tractor cabin in order to develop a simulation model of an agricultural tractor. Methods: The KS M 6604 rubber mount test method was used to test the dynamic characteristics of the rubber mount. Of the methods proposed in the standard, the resonance method was used. To perform the test according to the standard, a base excitation test device was constructed and the accelerations were measured. Results: Displacement transmissibility was measured by varying the frequency from 3–30 Hz. The vibration transmissibility at resonance was confirmed, and the dynamic stiffness and damping coefficient of the rubber mount were obtained. The front rubber mount has a spring constant of 1247 N/mm and damping ratio of 3.27 Ns/mm, and the rear rubber mount has a spring constant of 702 N/mm and damping ratio of 1.92 Ns/mm. Conclusions: The parameters in the z-direction were obtained in this study. In future studies, we will develop a more complete tractor simulation model if the parameters for the x- and y-directions can be obtained.
Keywords: Base excitation system, Dynamic characteristics, Rubber mount, Tractor simulation model
J. Biosyst. Eng. 43(4):255-262. (2018. 12) https://doi.org/10.5307/JBE.2018.43.4.255
eISSN : 2234-1862 pISSN : 1738-1266
*Corresponding author: Young-Jun Park Tel: +82-2-880-4602; Fax: +82-2-873-2049 E-mail: [email protected]
the rubber mount include modeling techniques and tests. Lee et al. (2013) compared the results of the dynamic analysis using Abaqus and the results from non- resonance methods on a single piece of rubber, and reported the validity of the analysis. However, there were numerous values with error rates greater than 20% between the analysis and test results. Therefore, it is difficult to determine whether the analysis results for the rubber mount is accurate in all cases.
To improve the performance of the rubber mount as an insulator, Choi et al. (2018) performed shape optimization of the rubber mount. The properties of the rubber were analyzed using a rubber tensile test, and a finite element analysis was also conducted. Analysis of the rubber mount with the optimum design indicated a 35% vibration insulation effect compared to the initial rubber mount.
Cho et al. (1999) proposed a direct system method to directly determine the dynamic characteristics of rubber mounts using excitation and response vectors and excitation frequencies obtained from modal tests. However, the direct system determination method is relatively accurate only when system behavior in the frequency band of interest is applied to a rigid body motion system, therefore, there are limits to how it responds to the dynamic characteristics of rubber mounts. The results of study indicated that spring stiffness included errors of up to 14.8% and that damping coefficients included errors up to 8.7%.
Hur et al. (2004) conducted static and dynamic tests using rubber specimens for rubber mounts supporting automotive transmissions and reported superelastic and viscoelastic properties. The rubber mount was analyzed for comparison with test results and to confirm the validity of the study. Yim et al. (2000) developed a program that enabled the dynamic analysis and optimal design of automotive engine mounts. Using this analysis, it was possible to investigate the validity of a designed system and study the static mount, vibration mode, and frequency response analyses of an engine mount system.
Kwon et al. (2001) used experimental methods to determine the dynamic characteristics of rubber mounts that depended on the deformation amplitude and frequency of rubber mounts subjected to compressive and shear loads. They obtained the dynamic and static characteristics for all three axes, and validated their results by comparing them with analytical results from the finite element method.
As can be seen, only limited studies have been conducted to confirm the dynamic characteristics of rubber mounts for agricultural tractors. In addition, as the dynamic characteristics of rubber mounts are unknown, static test results or methods that assume appropriate values for parameters of dynamic characteristics are used, resulting in inaccurate results. Therefore, this study, by deter-mining the dynamic characteristics, is innovative in that it can improve the accuracy of tractor simulation models.
Studies have been conducted in the automotive field on rubber mounts supporting engines and transmissions, however, these studies, to confirm dynamic characteristics, were conducted using rubber specimens. As the rubber mounts supporting the cabins of agricultural tractors are a combination of steel plate and rubber, it is difficult to apply research methods utilizing rubber specimens.
In this study, the dynamic characteristics (spring stiffness, damping coefficient) of a rubber mount supporting a tractor cabin were determined by using the resonance method presented in KS M 6604. Through this study, we expect to be able to construct an accurate simulation model for ride vibration prediction.
Materials and Methods
Tractor and rubber mount used in study
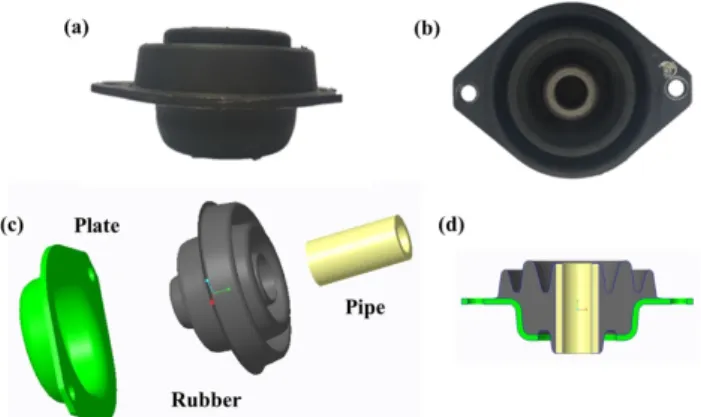
This study analyzed the rubber mount used in the 107 kW domestic tractor. The specifications of the tractor and cabin are presented in Table 1. The rubber mount used to measure the dynamic characteristics is shown in Figure 1. The rubber mount for tractors comprises a base plate, rubber, and a pipe used to fasten the bolt.
The tractor cabin is supported by four rubber mounts. Typically, rubber mounts with different physical pro-perties are used for the front and rear, and the same rubber mounts are installed on the left- and right-hand sides. The reason for this is that the left and right weights of the cabin are similar, but the front and rear weights differ. Figure 2 shows the rubber mounts installed in the tractor.
Table 1. Tractor specifications
Item Specification
Power 106.65 kW
Total Weight 5655 kg
Cabin Weight (Front) 265.1 kg Cabin Weight (Rear) 292.4 kg
Theory of dynamic system
As a method of confirming the dynamic characteristics of a rubber mount, the KS M 6604 standard proposes a resonance method and a non-resonance method. The same test criteria are used for both methods, and are presented in Table 2.
The test frequency is only applicable to the non- resonance method. When a test using the resonance method is conducted, the test frequency becomes the resonance frequency.
Non-resonance method
To confirm the dynamic characteristics of a rubber mount using a non-resonance method, tests are typically performed by applying load to the rubber mount and determining the deformation resulting from the load. First, construct a load–strain curve with the test results
and draw a rectangle circumscribing this curve. Figure 3 shows the circumscribed rectangle on a graph. The x-axis is load and the width corresponds to 2, and the y-axis is
strain and the height corresponds to 2.
The area 2 W enclosed by the rectangle and area ΔW enclosed by the load–deformation curve are then calculated and applied to Eq. (1)–(3) to calculate the spring constant. (1) ∆ ′ ′ (2)
(3)where : half the height of circumscribed rectangle, m
: half the width of circumscribed rectangle, m
ΔW: area enclosed by load–strain curve,
W: half the area of circumscribed rectangle,
δ: loss angle, rad
: absolute spring stiffness, N/m k: spring stiffness, N/m
Resonance method
This chapter was inspired by the theory based on book of Inman et al. (2014). To confirm the dynamic characte-ristics of a rubber mount using the resonance method, the resonance curve is recorded and the base excitation amplitude ξ0 of the forced displacement is measured. The
mass amplitude is then measured by varying the
frequency while keeping ξ0 constant. When is at its
maximum, it is referred to as the resonance frequency, and Figure 1. Rubber mount front view (a), top view (b), its individual
components (c), and cross-section view (d).
Figure 2. Location of rubber mounts (left), and detailed view of rear rubber mount (right).
Table 2. Test conditions in KS M 6604 standard
Value
Test Temperature (℃) 20
Test Frequency (Hz) 10
Average Strain (%) 0
Shear Strain Amplitude (%) 1.0
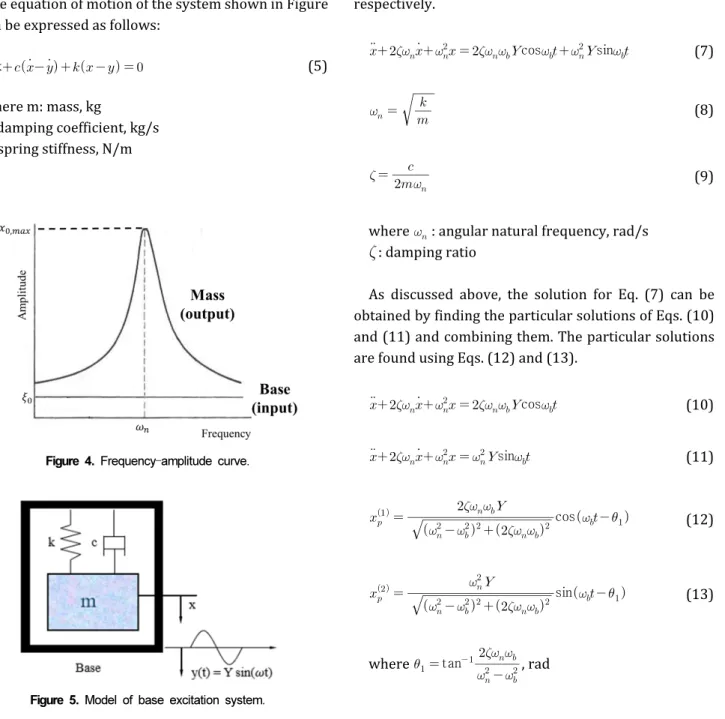
the amplitudes measured at this time are shown in Figure 4. The vertical ride vibration model for tractors can be simplified by a system that excites movement at the base, the so-called base excitation system. The simplified vibration model can be expressed as shown in Figure 5. Displacement at the base is given by y(t) and the displacement of the cabin placed on the rubber mount is x(t). The displacement of the base is defined in Eq. (4).
yt Ysin (4)
where Y: amplitude of base excitation, Hz
: frequency of base excitation, Hz
The equation of motion of the system shown in Figure 4 can be expressed as follows:
mx (5) where m: mass, kg
c: damping coefficient, kg/s k: spring stiffness, N/m
Equation (4) is substituted into Eq. (5) as follows:
cossin (6)
Equation (6) represents a spring-mass-damper system with two harmonic inputs. The solution is obtained using linear equations of motion. The solution is found by adding the particular solution , which is obtained by
assuming the input cos, and the particular solution
, which is obtained by assuming the input sin.
Equation (7) is obtained by dividing both sides of Eq. (6) by m and summarizing them. The angular natural frequency, and damping ratio, ζ are used in Eq. (7), and
these parameters are calculated by Eq. (8) and (9), respectively. cossin (7)
(8) (9) where : angular natural frequency, rad/sζ : damping ratio
As discussed above, the solution for Eq. (7) can be obtained by finding the particular solutions of Eqs. (10) and (11) and combining them. The particular solutions are found using Eqs. (12) and (13).
cos (10) sin (11)
cos (12)
sin (13) where tan , radFigure 4. Frequency–amplitude curve.
The particular solution with two solutions is as follows:
cos (14) where tan , radIf the amplitude of the particular solution is
defined as X, then the ratio of the magnitude X (amplitude of mass) to magnitude Y (amplitude of base vibration input to system) can be obtained. This ratio is called the displacement transmissibility, μ, and can be expressed as follows:
(15) where μ : displacement transmissibilityIn Eq. (15), when —that is, when the frequency of
the excitation base is equal to the natural frequency—the excited part transmits the greatest motion to the system. The natural frequency is measured using the dis-placement transmissibility, and the dynamic charac-teristics are confirmed. This study measures the ratio of accelerations. The displacement and acceleration trans-missibility are theoretically identical.
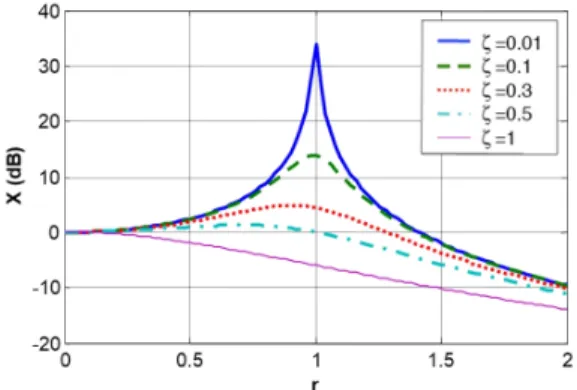
The natural frequency of the damping ratio ξ can be obtained by substituting r=1 in Eq. (15). From the theory, it can be confirmed that the maximum displacement transmissibility is obtained when the frequency ratio is 1 at any damping ratio. This can be seen in Figure 6.
(16) where ξ : the natural frequency of the damping ratio From the damping ratio, the spring stiffness and damping coefficient can be obtained from Eq. (17) and (18).
(17)
(18)
Experimental condition
The top figure in Figure 7 shows the actual dynamic characteristics test of a rubber mount, and the bottom figure shows a schematic of the setup. An accelerometer is mounted on the exciter to measure the mass of the testing device and other data.
We applied a mass identical to the mass of the actual tractor cabin to the rubber mount on the test device. Accelerometers were installed on the base of the test device and on the surface of the rubber mount, and accelerations were measured while constantly increasing the vibration frequency. A number of preliminary tests confirmed that the natural frequencies appear between 3
Figure 6. Amplitude and frequency ratio (r) of steady state response for several damping ratios (ζ).
Hz–30 Hz, and these tests were conducted in that frequency range. An example of base excitation is shown graphically in Figure 8.
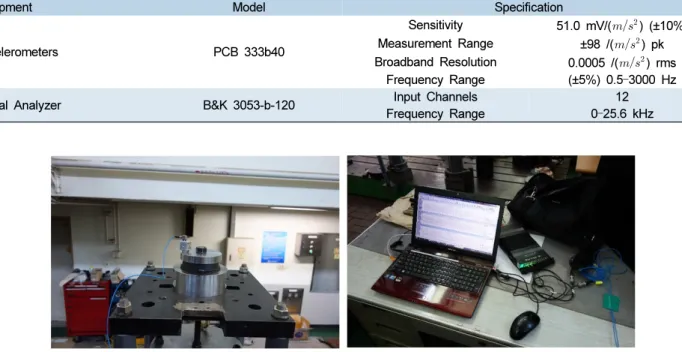
The specifications of the accelerometer and signal analyzer used in this study are presented in Table 3. Figure 9 shows the accelerometer and signal analyzer used in this study.
Assuming that the measured acceleration of the excitation surface is and the measured acceleration of
mass is , the relationship between displacement and
acceleration can be obtained as follows:
(19)
(20) where f : frequency of base excitation, Hz : acceleration at mass,
: acceleration at base,
Figure 8. Example of base excitation.
Table 3. Specification of accelerometer and signal analyzer
Equipment Model Specification
Accelerometers PCB 333b40
Sensitivity 51.0 mV/() (±10%)
Measurement Range ±98 /() pk Broadband Resolution 0.0005 /() rms
Frequency Range (±5%) 0.5–3000 Hz
Signal Analyzer B&K 3053-b-120 Input Channels 12
Frequency Range 0–25.6 kHz
The displacement transmissibility for the frequency can be obtained by using the X and Y values obtained at the respective frequencies. The values of X and Y are shown in Figure 10.
The maximum displacement transmissibility point for each frequency is called the resonance point, and the dynamic characteristics of the rubber mount are calculated using the natural frequency. The tests were conducted twice for the front and rear rubber mounts.
Results and Discussion
Figure 11 shows the displacement transmissibility versus excitation frequency of the front rubber mount. As the graphs of test 1 and 2 are essentially identical, it was judged that the error between the first and second tests insignificant. Table 4 presents the dynamic characteristics calculated using the natural frequencies from the two tests.
The applied mass was 132.55 kg, which is half of the front mass of the cabin presented in Table 1. The natural frequency and displacement transmissibility were obtained from the tests, and the spring stiffness, damping coefficient, and damping ratio were calculated using Eqs. (16)–(18).
Figure 12 shows the displacement transmissibility versus excitation frequency of the rear rubber mount. As per the front rubber mount, it was judged that the error between the first and second tests was insignificant. Table 5 presents the dynamic characteristics using the natural frequency of the rear rubber mount test.
The results of this test confirmed that the spring stiffness and damping coefficient of the front rubber mount are greater by 77% and 71%, respectively, than those of the rear rubber mounts.
Figure 10. displacement at base and mass (Front rubber mount test #1).
Table 4. Results of front (FR) rubber mount test
Item FR Test 1 FR Test 2
Mass (kg) 132.55 Natural Frequency (Hz) 15.438 15.438 Displacement Transmissibility, μ 4.099 4.012 Spring Stiffness, k (N/mm) 1247.077 1247.077 Damping Coefficient, c (Ns/mm) 3.234 3.309 Damping Ratio, ζ 0.126 0.129
Figure 12. Displacement transfer ratio curve of rear rubber mount.
Figure 11. Displacement transmissibility curve of front rubber mount.
Table 5. Results of rear (RR) rubber mount test
RR Test 1 RR Test 2 Mass, m (kg) 146.2 Natural Frequency (Hz) 10.9375 11.125 Displacement Transmissibility, μ 5.556 5.211 Spring Stiffness, k (N/mm) 690.468 714.344 Damping Coefficient, c (Ns/mm) 1.838 1.998 Damping Ratio, ζ 0.091 0.098
Conclusions
This study determined the spring stiffnesses and damping coefficients, which are the dynamic charac-teristics of rubber mounts supporting a tractor cabin, in order to develop models that simulate ride vibrations in agricultural tractors. The theoretical background of the method proposed in the KS M 6604 standard was confirmed and the results were then verified by a test.
However, a limitation of this study is that it only determined the dynamic characteristics in the vertical direction, as the KS M 6604 standard only defines tests for this direction. If the dynamic characteristics of rubber mounts in other directions can be confirmed in future studies, simulation models of ride vibration predictions will be more accurate. The dynamic characteristics of translational motion and rolling directions (rolling, yawing, and pitching) should be obtained.
It is also necessary to confirm the influence of the spring stiffness and the damping coefficient of the rubber mount on the behavior of the cabin, and to investigate whether the design of the rubber mount is valid.
Conflict of Interest
The authors have no conflicting financial or other interests.
Acknowledgement
This work was supported by the Technology Develop-ment Program (S2305668) funded by the Ministry of SMEs and Startups (MSS, Korea)
References
Cho, J. S., K. U. Kim and H. J. Park. 2000. Determination of dynamic parameters of agricultural tractor cab mount system by a modified DSIM. Transactions of the ASAE 43(6): 1365-1369.
https://doi.org/10.13031/2013.3033
Choi, H.-J. and S.-H. Lee. 2018. Shape optimal design of anti-vibration rubber assembly to reduce the vibration of a tractor cabin. Journal of the Korea Academia- Industrial Cooperation Society 19(4): 657-663. https://doi.org/10.5762/KAIS.2018.19.4.657 Chung, W. J., J.-S. Oh, Y. N. Park, D.-C. Kim and Y. -J. Park.
2017. Optimization of the suspension design to reduce the ride vibration of 90kW-class tractor cabin. Journal of the Korean Society of Manufacturing Process Engineers 16(5): 91-98.
https://doi.org/10.14775/ksmpe.2017.16.5.091 Hur, S., W. D. Kim, C. S. Woo, W. S. Kim and S. B. Lee. 2004.
The study of static and dynamic characteristics for TM rubber mount. In Proceedings of the KSAE Conference, pp. 1243-1248, Jeongseon, Kangwon, Korea: June 2004. Inman, D. J. 2014. Engineering Vibration, 4th ed. Boston:
Pearson Education, Inc.
KS. 2016. KS M 6604:2016. Testing method for rubber vibration isolators. Seoul, Rep. Korea: Korean Standard Association.
Kwon, O. B., J. Y. Kim, Y. K. Kim, M. S. Han and C. S. Ko. 2001. The study of static and dynamic characteristics for a isolation rubber mount using the complex stiffness. In: Proceedings of the KSNVE Conference, pp. 927-932, Pyeongchang, Gangwon-do, Korea: November 2001. Lee, S.-B., J.-H. Jung, J.-H. Choi and Y.-H. Lee. 2013.
Development of dynamic modeling of rubber mount. In: Proceedings of the KSNVE, pp. 87-91, Gyeongju, Gyeongsangbuk-do, Korea: October 2013.
Yim, H. J., S. J. Sung and S. B. Lee. 2001. Integrated system for dynamic analysis and optimal design of engine mount systems. Journal of the KSNVE 11(1), 36-40.